Modern Blanket Toss: Findings and Observations
This book is the last in a series of three covering the National Science Foundation awarded Modern Blanket Toss project. In this book are the evaluation findings for each of the three years as well as observations from Modern Blanket Toss staff.
This book is the last in a series of three covering the National Science Foundation awarded Modern Blanket Toss project. In this book are the evaluation findings for each of the three years as well as observations from Modern Blanket Toss staff.

You also want an ePaper? Increase the reach of your titles
YUMPU automatically turns print PDFs into web optimized ePapers that Google loves.
2014 FINDINGS<br />
Analysis <strong>and</strong> Results<br />
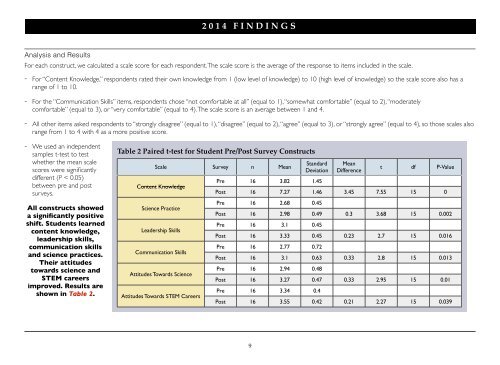
For each construct, we calculated a scale score for each respondent. The scale score is the average of the response to items included in the scale.<br />
- For “Content Knowledge,” respondents rated their own knowledge from 1 (low level of knowledge) to 10 (high level of knowledge) so the scale score also has a<br />
range of 1 to 10.<br />
- For the “Communication Skills” items, respondents chose “not comfortable at all” (equal to 1), “somewhat comfortable” (equal to 2), “moderately<br />
comfortable” (equal to 3), or “very comfortable” (equal to 4). The scale score is an average between 1 <strong>and</strong> 4.<br />
- All other items asked respondents to “strongly disagree” (equal to 1), “disagree” (equal to 2), “agree” (equal to 3), or “strongly agree” (equal to 4), so those scales also<br />
range from 1 to 4 with 4 as a more positive score.<br />
- We used an independent<br />
samples t-test to test<br />
whether the mean scale<br />
scores were significantly<br />
different (P < 0.05)<br />
between pre <strong>and</strong> post<br />
surveys.<br />
All constructs showed<br />
a significantly positive<br />
shift. Students learned<br />
content knowledge,<br />
leadership skills,<br />
communication skills<br />
<strong>and</strong> science practices.<br />
Their attitudes<br />
towards science <strong>and</strong><br />
STEM careers<br />
improved. Results are<br />
shown in Table 2.<br />
Table 2 Paired t-test for Student Pre/Post Survey Constructs<br />
Scale Survey n Mean<br />
Content Knowledge<br />
Science Practice<br />
Leadership Skills<br />
Communication Skills<br />
Attitudes Towards Science<br />
Attitudes Towards STEM Careers<br />
St<strong>and</strong>ard<br />
Deviation<br />
Pre 16 3.82 1.45<br />
Mean<br />
Difference<br />
t df P-Value<br />
Post 16 7.27 1.46 3.45 7.55 15 0<br />
Pre 16 2.68 0.45<br />
Post 16 2.98 0.49 0.3 3.68 15 0.002<br />
Pre 16 3.1 0.45<br />
Post 16 3.33 0.45 0.23 2.7 15 0.016<br />
Pre 16 2.77 0.72<br />
Post 16 3.1 0.63 0.33 2.8 15 0.013<br />
Pre 16 2.94 0.48<br />
Post 16 3.27 0.47 0.33 2.95 15 0.01<br />
Pre 16 3.34 0.4<br />
Post 16 3.55 0.42 0.21 2.27 15 0.039<br />
9