CRC 2015. English

You also want an ePaper? Increase the reach of your titles
YUMPU automatically turns print PDFs into web optimized ePapers that Google loves.
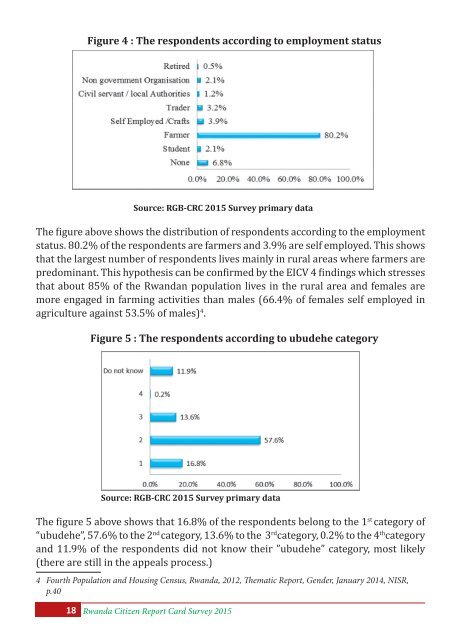
Figure 4 : The respondents according to employment status<br />
Source: RGB-<strong>CRC</strong> 2015 Survey primary data<br />
The figure above shows the distribution of respondents according to the employment<br />
status. 80.2% of the respondents are farmers and 3.9% are self employed. This shows<br />
that the largest number of respondents lives mainly in rural areas where farmers are<br />
predominant. This hypothesis can be confirmed by the EICV 4 findings which stresses<br />
that about 85% of the Rwandan population lives in the rural area and females are<br />
more engaged in farming activities than males (66.4% of females self employed in<br />
agriculture against 53.5% of males) 4 .<br />
Figure 5 : The respondents according to ubudehe category<br />
Source: RGB-<strong>CRC</strong> 2015 Survey primary data<br />
The figure 5 above shows that 16.8% of the respondents belong to the 1 st category of<br />
“ubudehe”, 57.6% to the 2 nd category, 13.6% to the 3 rd category, 0.2% to the 4 th category<br />
and 11.9% of the respondents did not know their ”ubudehe” category, most likely<br />
(there are still in the appeals process.)<br />
4 Fourth Population and Housing Census, Rwanda, 2012, Thematic Report, Gender, January 2014, NISR,<br />
p.40<br />
18 Rwanda Citizen Report Card Survey 2015