CRC 2015. English

You also want an ePaper? Increase the reach of your titles
YUMPU automatically turns print PDFs into web optimized ePapers that Google loves.
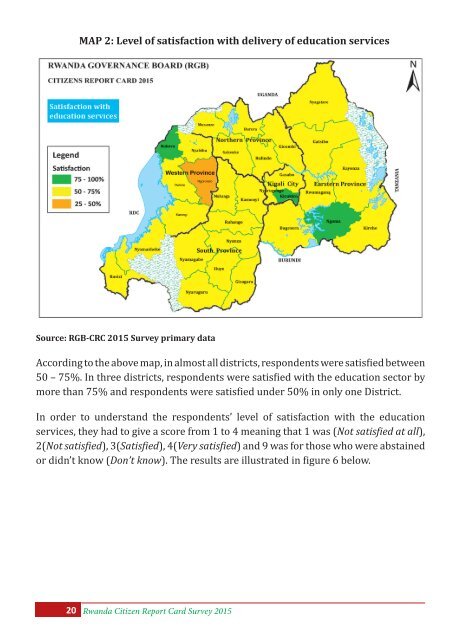
MAP 2: Level of satisfaction with delivery of education services<br />
Source: RGB-<strong>CRC</strong> 2015 Survey primary data<br />
According to the above map, in almost all districts, respondents were satisfied between<br />
50 – 75%. In three districts, respondents were satisfied with the education sector by<br />
more than 75% and respondents were satisfied under 50% in only one District.<br />
In order to understand the respondents’ level of satisfaction with the education<br />
services, they had to give a score from 1 to 4 meaning that 1 was (Not satisfied at all),<br />
2(Not satisfied), 3(Satisfied), 4(Very satisfied) and 9 was for those who were abstained<br />
or didn’t know (Don’t know). The results are illustrated in figure 6 below.<br />
20 Rwanda Citizen Report Card Survey 2015