

SAS/STAT 922 User's Guide: The MIXED Procedure (Book Excerpt)
SAS/STAT 922 User's Guide: The MIXED Procedure (Book Excerpt)
SAS/STAT 922 User's Guide: The MIXED Procedure (Book Excerpt)

Create successful ePaper yourself
Turn your PDF publications into a flip-book with our unique Google optimized e-Paper software.
Example 56.8: Influence Analysis for Repeated Measures Data ✦ 4695<br />
update the fixed effects only. <strong>The</strong> following statements request this noniterative maximum likelihood<br />
analysis and produce Output 56.8.1:<br />
proc mixed data=pr method=ml;<br />
class person gender;<br />
model y = gender age gender*age /<br />
influence(effect=person);<br />
repeated / type=un subject=person;<br />
ods select influence;<br />
run;<br />
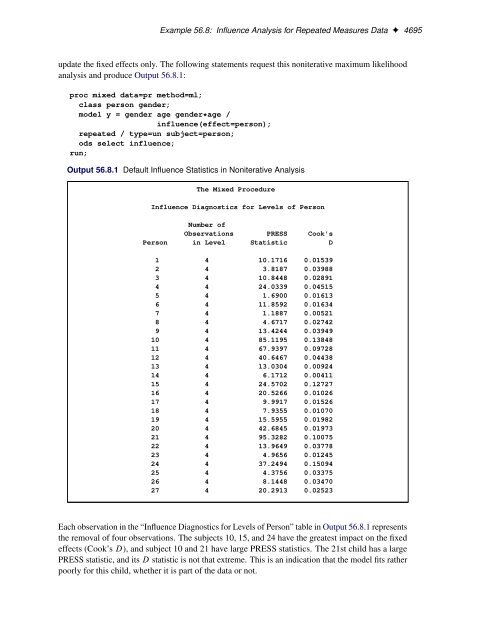
Output 56.8.1 Default Influence Statistics in Noniterative Analysis<br />
<strong>The</strong> Mixed <strong>Procedure</strong><br />
Influence Diagnostics for Levels of Person<br />
Number of<br />
Observations PRESS Cook's<br />
Person in Level Statistic D<br />
1 4 10.1716 0.01539<br />
2 4 3.8187 0.03988<br />
3 4 10.8448 0.02891<br />
4 4 24.0339 0.04515<br />
5 4 1.6900 0.01613<br />
6 4 11.8592 0.01634<br />
7 4 1.1887 0.00521<br />
8 4 4.6717 0.02742<br />
9 4 13.4244 0.03949<br />
10 4 85.1195 0.13848<br />
11 4 67.9397 0.09728<br />
12 4 40.6467 0.04438<br />
13 4 13.0304 0.00924<br />
14 4 6.1712 0.00411<br />
15 4 24.5702 0.12727<br />
16 4 20.5266 0.01026<br />
17 4 9.9917 0.01526<br />
18 4 7.9355 0.01070<br />
19 4 15.5955 0.01982<br />
20 4 42.6845 0.01973<br />
21 4 95.3282 0.10075<br />
22 4 13.9649 0.03778<br />
23 4 4.9656 0.01245<br />
24 4 37.2494 0.15094<br />
25 4 4.3756 0.03375<br />
26 4 8.1448 0.03470<br />
27 4 20.2913 0.02523<br />
Each observation in the “Influence Diagnostics for Levels of Person” table in Output 56.8.1 represents<br />
the removal of four observations. <strong>The</strong> subjects 10, 15, and 24 have the greatest impact on the fixed<br />
effects (Cook’s D), and subject 10 and 21 have large PRESS statistics. <strong>The</strong> 21st child has a large<br />
PRESS statistic, and its D statistic is not that extreme. This is an indication that the model fits rather<br />
poorly for this child, whether it is part of the data or not.


