

Factors Affecting Trade Patterns of - United States International ...
Factors Affecting Trade Patterns of - United States International ...
Factors Affecting Trade Patterns of - United States International ...

You also want an ePaper? Increase the reach of your titles
YUMPU automatically turns print PDFs into web optimized ePapers that Google loves.
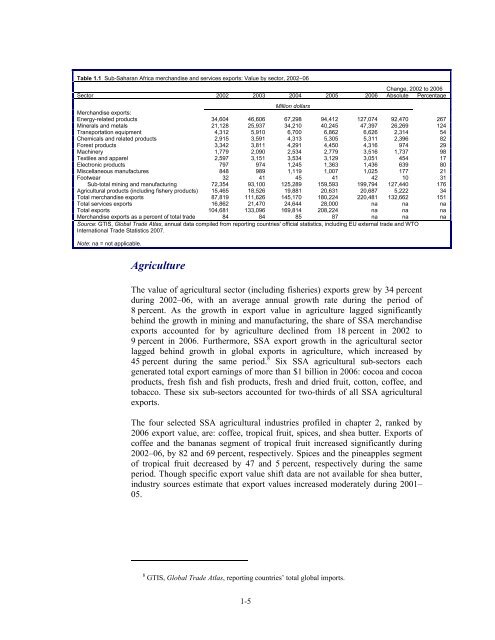
Table 1.1 Sub-Saharan Africa merchandise and services exports: Value by sector, 2002−06<br />
Change, 2002 to 2006<br />
Sector 2002 2003 2004 2005 2006 Absolute Percentage<br />
Million dollars<br />
Merchandise exports:<br />
Energy-related products 34,604 46,606 67,298 94,412 127,074 92,470 267<br />
Minerals and metals 21,128 25,937 34,210 40,245 47,397 26,269 124<br />
Transportation equipment 4,312 5,910 6,700 6,862 6,626 2,314 54<br />
Chemicals and related products 2,915 3,591 4,313 5,305 5,311 2,396 82<br />
Forest products 3,342 3,811 4,291 4,450 4,316 974 29<br />
Machinery 1,779 2,090 2,534 2,779 3,516 1,737 98<br />
Textiles and apparel 2,597 3,151 3,534 3,129 3,051 454 17<br />
Electronic products 797 974 1,245 1,363 1,436 639 80<br />
Miscellaneous manufactures 848 989 1,119 1,007 1,025 177 21<br />
Footwear 32 41 45 41 42 10 31<br />
Sub-total mining and manufacturing 72,354 93,100 125,289 159,593 199,794 127,440 176<br />
Agricultural products (including fishery products) 15,465 18,526 19,881 20,631 20,687 5,222 34<br />
Total merchandise exports 87,819 111,626 145,170 180,224 220,481 132,662 151<br />
Total services exports 16,862 21,470 24,644 28,000 na na na<br />
Total exports 104,681 133,096 169,814 208,224 na na na<br />
Merchandise exports as a percent <strong>of</strong> total trade 84 84 85 87 na na na<br />
Source: GTIS, Global <strong>Trade</strong> Atlas, annual data compiled from reporting countries' <strong>of</strong>ficial statistics, including EU external trade and WTO<br />
<strong>International</strong> <strong>Trade</strong> Statistics 2007.<br />
Note: na = not applicable.<br />
Agriculture<br />
The value <strong>of</strong> agricultural sector (including fisheries) exports grew by 34 percent<br />
during 2002–06, with an average annual growth rate during the period <strong>of</strong><br />
8 percent. As the growth in export value in agriculture lagged significantly<br />
behind the growth in mining and manufacturing, the share <strong>of</strong> SSA merchandise<br />
exports accounted for by agriculture declined from 18 percent in 2002 to<br />
9 percent in 2006. Furthermore, SSA export growth in the agricultural sector<br />
lagged behind growth in global exports in agriculture, which increased by<br />
45 percent during the same period. 8 Six SSA agricultural sub-sectors each<br />
generated total export earnings <strong>of</strong> more than $1 billion in 2006: cocoa and cocoa<br />
products, fresh fish and fish products, fresh and dried fruit, cotton, c<strong>of</strong>fee, and<br />
tobacco. These six sub-sectors accounted for two-thirds <strong>of</strong> all SSA agricultural<br />
exports.<br />
The four selected SSA agricultural industries pr<strong>of</strong>iled in chapter 2, ranked by<br />
2006 export value, are: c<strong>of</strong>fee, tropical fruit, spices, and shea butter. Exports <strong>of</strong><br />
c<strong>of</strong>fee and the bananas segment <strong>of</strong> tropical fruit increased significantly during<br />
2002–06, by 82 and 69 percent, respectively. Spices and the pineapples segment<br />
<strong>of</strong> tropical fruit decreased by 47 and 5 percent, respectively during the same<br />
period. Though specific export value shift data are not available for shea butter,<br />
industry sources estimate that export values increased moderately during 2001–<br />
05.<br />
8 GTIS, Global <strong>Trade</strong> Atlas, reporting countries’ total global imports.<br />
1-5


