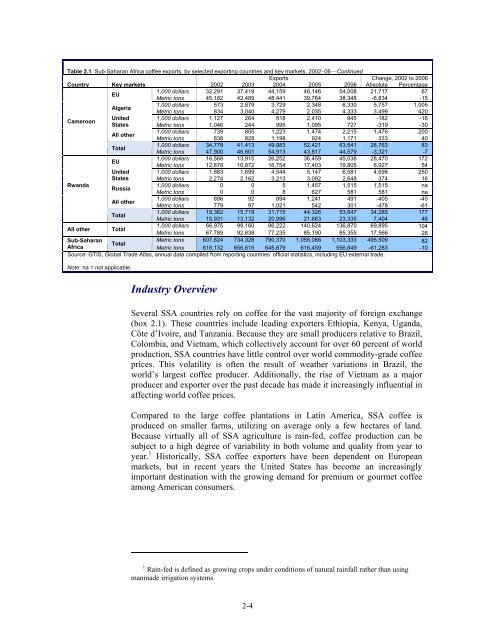
Table 2.1 Sub-Saharan Africa c<strong>of</strong>fee exports, by selected exporting countries and key markets, 2002−06−−Continued Exports Change, 2002 to 2006 Country Key markets 2002 2003 2004 2005 2006 Absolute Percentage EU 1,000 dollars Metric tons 32,291 45,182 37,419 42,489 44,159 48,441 46,146 39,764 54,008 38,348 21,717 -6,834 67 -15 Algeria 1,000 dollars Metric tons 573 834 2,879 3,040 3,729 4,279 2,348 2,035 6,330 4,333 5,757 3,499 1,005 420 Cameroon <strong>United</strong> <strong>States</strong> 1,000 dollars Metric tons 1,127 1,046 264 244 818 995 2,410 1,095 945 727 -182 -319 -16 -30 All other 1,000 dollars Metric tons 739 838 805 828 1,223 1,198 1,474 924 2,215 1,171 1,476 333 200 40 Total 1,000 dollars Metric tons 34,778 47,900 41,413 46,601 49,983 54,913 52,421 43,817 63,541 44,579 28,763 -3,321 83 -7 EU 1,000 dollars Metric tons 16,568 12,878 13,915 10,872 26,252 16,754 36,459 17,403 45,038 19,805 28,470 6,927 172 54 <strong>United</strong> 1,000 dollars 1,883 1,699 4,544 5,147 6,581 4,698 250 <strong>States</strong> Metric tons 2,274 2,162 3,213 3,092 2,648 374 16 Rwanda Russia 1,000 dollars Metric tons 0 0 0 0 5 8 1,457 627 1,515 581 1,515 581 na na All other 1,000 dollars Metric tons 896 779 92 97 894 1,021 1,241 542 491 301 -405 -478 -45 -61 Total 1,000 dollars Metric tons 19,362 15,931 15,719 13,132 31,715 20,996 44,326 21,663 53,647 23,335 34,285 7,404 177 46 All other Total 1,000 dollars Metric tons 66,975 67,789 99,160 92,838 86,222 77,235 140,624 85,190 136,870 85,355 69,895 17,566 104 26 Sub-Saharan Africa Total Metric tons Metric tons 607,824 618,132 734,328 656,615 790,370 645,679 1,055,086 616,459 1,103,333 556,849 495,509 -61,283 82 -10 Source: GTIS, Global <strong>Trade</strong> Atlas, annual data compiled from reporting countries’ <strong>of</strong>ficial statistics, including EU external trade. Note: na = not applicable. Industry Overview Several SSA countries rely on c<strong>of</strong>fee for the vast majority <strong>of</strong> foreign exchange (box 2.1). These countries include leading exporters Ethiopia, Kenya, Uganda, Côte d’Ivoire, and Tanzania. Because they are small producers relative to Brazil, Colombia, and Vietnam, which collectively account for over 60 percent <strong>of</strong> world production, SSA countries have little control over world commodity-grade c<strong>of</strong>fee prices. This volatility is <strong>of</strong>ten the result <strong>of</strong> weather variations in Brazil, the world’s largest c<strong>of</strong>fee producer. Additionally, the rise <strong>of</strong> Vietnam as a major producer and exporter over the past decade has made it increasingly influential in affecting world c<strong>of</strong>fee prices. Compared to the large c<strong>of</strong>fee plantations in Latin America, SSA c<strong>of</strong>fee is produced on smaller farms, utilizing on average only a few hectares <strong>of</strong> land. Because virtually all <strong>of</strong> SSA agriculture is rain-fed, c<strong>of</strong>fee production can be subject to a high degree <strong>of</strong> variability in both volume and quality from year to year. 1 Historically, SSA c<strong>of</strong>fee exporters have been dependent on European markets, but in recent years the <strong>United</strong> <strong>States</strong> has become an increasingly important destination with the growing demand for premium or gourmet c<strong>of</strong>fee among American consumers. 1 Rain-fed is defined as growing crops under conditions <strong>of</strong> natural rainfall rather than using manmade irrigation systems. 2-4
Box 2.1 Product description for c<strong>of</strong>fee C<strong>of</strong>fee is produced in tropical and subtropical climates in Latin America, Asia, and Africa, largely by small landowners. There are two main types <strong>of</strong> c<strong>of</strong>fee: Arabica and Robusta. Arabica is grown in higher altitudes in Latin America and northeastern Africa and accounts for two-thirds <strong>of</strong> total world production. Robusta is produced in low altitudes in Asia, western and southern Africa, and Brazil. Because <strong>of</strong> its superior flavor and aroma, Arabica c<strong>of</strong>fee usually receives a higher price than Robusta, which is <strong>of</strong>ten used as a filler in c<strong>of</strong>fee blends. There are only five c<strong>of</strong>fee producing countries that consume a substantial amount <strong>of</strong> their own production: Brazil, Ethiopia, Indonesia, Mexico, and Colombia. 2 C<strong>of</strong>fee is one <strong>of</strong> the most actively traded commodities in the world. In many years, it is second only to oil as a source <strong>of</strong> foreign exchange for developing countries. For several <strong>of</strong> the world’s least developed countries, exports <strong>of</strong> c<strong>of</strong>fee account for over 80 percent <strong>of</strong> foreign exchange earnings. Most <strong>of</strong> the world’s c<strong>of</strong>fee is exported to the high-income countries <strong>of</strong> Europe, North America, Japan, and Australia. C<strong>of</strong>fee is a traded on major futures and commodity exchanges, most prominently in New York and London. 1 C<strong>of</strong>fee is a beverage that is made from the roasted beans <strong>of</strong> the c<strong>of</strong>fee plant. The process <strong>of</strong> making c<strong>of</strong>fee begins when the green beans (or berries) are picked from the c<strong>of</strong>fee plant (usually by hand) and then washed and dried. The c<strong>of</strong>fee beans are heated to between 180ºC and 240ºC for 8 to 15 minutes, depending on the degree <strong>of</strong> roast required. The longer the c<strong>of</strong>fee is roasted, the darker it becomes. The roasted beans are then ground and brewed in order to create the c<strong>of</strong>fee beverage. ____________ 1 <strong>International</strong> C<strong>of</strong>fee Organization Web site. http://www.ico.org/index.asp (accessed various dates). 2 Baffes, Lewin, and Varangis, “C<strong>of</strong>fee: Market Setting and Policies,” 2005. Ethiopia The Ethiopian economy is highly dependent on agriculture, with agriculture accounting for almost half <strong>of</strong> its GDP. 2 C<strong>of</strong>fee is the leading cash crop and consistently the leading export product, accounting for 35 percent <strong>of</strong> total export value in 2006. 3 Ethiopia has been the fourth- or fifth-leading exporter <strong>of</strong> c<strong>of</strong>fee in the world over the past 5 years. 4 In addition, more than 25 percent <strong>of</strong> Ethiopia’s population is dependent on c<strong>of</strong>fee production and trade. 5 Ethiopia is the birthplace <strong>of</strong> Arabica 6 c<strong>of</strong>fee and, unlike the rest <strong>of</strong> SSA, domestic consumption is large, accounting for a significant proportion <strong>of</strong> its usage. 7 The combination <strong>of</strong> good rainfall during the past three years, following a severe drought in 2002−03, and a recovery in world c<strong>of</strong>fee prices has benefited the Ethiopian c<strong>of</strong>fee industry immensely. C<strong>of</strong>fee is produced largely in the central and southern areas <strong>of</strong> the country, 8 and 95 percent <strong>of</strong> production is from small landholders. 9 2 EIU, Country Pr<strong>of</strong>ile 2007: Ethiopia, 2007, 23. 3 Ibid., 56. 4 USDA, FAS, Tropical Products: World Markets and <strong>Trade</strong>, June 2007, 9. 5 McCarthy, “Linking Smallholder Producer Groups to Higher Value Markets,” February 12, 2007, 10. 6 One <strong>of</strong> the two major species <strong>of</strong> c<strong>of</strong>fee, Arabica, represents about two-thirds <strong>of</strong> the world market. Compared to the other major species, Robusta, Arabica c<strong>of</strong>fee plants thrive at higher elevations in a cooler, drier climate. Arabica beans are generally considered to produce betterquality and more flavorful c<strong>of</strong>fee. 7 According to USDA, Ethiopia’s c<strong>of</strong>fee consumption averaged 42 percent <strong>of</strong> production during 2002−06. USDA, FAS, Production, Supply and Distribution Online. 8 EIU, Country Pr<strong>of</strong>ile 2007: Ethiopia, 2007, 24. 9 McCarthy, “Linking Smallholder Producer Groups to Higher Value Markets,” February 12, 2007, 10. 2-5
- Page 2 and 3: U.S. International Trade Commission
- Page 4 and 5: This report was prepared principall
- Page 7 and 8: CONTENTS Abstract .................
- Page 9 and 10: CONTENTS—Continued Chapter 2 Agri
- Page 11 and 12: CONTENTS—Continued Chapter 3 Mini
- Page 13 and 14: CONTENTS-Continued Chapter 4 Servic
- Page 15: CONTENTS-Continued Figures—Contin
- Page 18 and 19: several multinational companies to
- Page 20 and 21: Table ES.1 Sub-Saharan Africa: Summ
- Page 22 and 23: xviii Table ES.2 Sub-Saharan Africa
- Page 25 and 26: CHAPTER 1 Introduction and Overview
- Page 27 and 28: Approach The approach employed by t
- Page 29 and 30: Table 1.1 Sub-Saharan Africa mercha
- Page 31: divided between transportation serv
- Page 34 and 35: Coffee Summary of Findings The valu
- Page 38 and 39: Kenya Coffee is a major export for
- Page 40 and 41: 95 percent of Tanzania’s coffee i
- Page 42 and 43: Figure 2.2 Leading markets for glob
- Page 44 and 45: improvement in quality over the pas
- Page 46 and 47: usiness and conducts central coffee
- Page 48 and 49: Coffee Bibliography Akiyama, Takama
- Page 50 and 51: Wasserman, Miriam. “Trouble in Co
- Page 52 and 53: Box 2.2 Shea butter production, pro
- Page 54 and 55: Shea butter competes with a number
- Page 56 and 57: Table 2.2 Sub-Saharan Africa shea n
- Page 58 and 59: Figure 2.6 SSA shea exports for sel
- Page 60 and 61: Leading Export Markets The leading
- Page 62 and 63: include specific iodine values, mel
- Page 64 and 65: utter. Blue Mont Trading LTD instal
- Page 66 and 67: ——. “The Shea Butter Value Ch
- Page 68 and 69: Table 2.4 Sub-Saharan Africa export
- Page 70 and 71: Box 2.4 Product description for spi
- Page 72 and 73: Table 2.5 Sub-Saharan Africa export
- Page 74 and 75: Vanilla In 2006, the leading world
- Page 76 and 77: Figure 2.10 SSA vanilla and clove e
- Page 78 and 79: Spices Bibliography Angrisani, Caro
- Page 80 and 81: Tropical Fruit 155 Summary of Findi
- Page 82 and 83: chains, as well as more dependable
- Page 84 and 85: Pacific (ACP) regions to reduce the
- Page 86 and 87:
Table 2.6 Sub-Saharan Africa export
- Page 88 and 89:
terms of value was much more signif
- Page 90 and 91:
Figure 2.13 Leading markets for glo
- Page 92 and 93:
Box 2.7 EU tariff preferences for b
- Page 94 and 95:
a corresponding contraction in mark
- Page 96 and 97:
product, the largest suppliers to t
- Page 98 and 99:
has a controlling interest, was the
- Page 100 and 101:
(2,471 acres) at the Paradise pinea
- Page 102 and 103:
port, and provides market informati
- Page 104 and 105:
Tropical Fruit Bibliography Adongo,
- Page 106 and 107:
Heller, Lorraine, “Chiquita Raise
- Page 108 and 109:
Footwear Summary of Findings Althou
- Page 110 and 111:
Box 3.1 Product description for foo
- Page 112 and 113:
Leading Exporters China dominates e
- Page 114 and 115:
SSA footwear exports reached $42.5
- Page 116 and 117:
companies. Footwear and apparel exp
- Page 118 and 119:
factories and to train employees to
- Page 120 and 121:
Box 3.3 TSONGA USA LLC: An example
- Page 122 and 123:
Van der Loop, Theo. Clothing and Fo
- Page 124 and 125:
Table 3.2 Sub-Saharan Africa natura
- Page 126 and 127:
Profiles of Leading SSA NR Producer
- Page 128 and 129:
Nigeria; however Michelin ceased op
- Page 130 and 131:
Proposals to Promote the Industry a
- Page 132 and 133:
Figure 3.4 Leading markets for glob
- Page 134 and 135:
Natural Rubber Bibliography AFP.
- Page 136 and 137:
Processed Diamonds Summary of Findi
- Page 138 and 139:
Box 3.6 Precious-metal jewelry An e
- Page 140 and 141:
Box 3.7 The Kimberley Process Certi
- Page 142 and 143:
Figure 3.5 Leading markets for glob
- Page 144 and 145:
The opening and success of the plan
- Page 146 and 147:
Box 3.8 Petra Diamonds’ for SSA b
- Page 148 and 149:
MBendi, “Africa: Mining-Diamond M
- Page 150 and 151:
Table 3.5 Sub-Saharan Africa textil
- Page 152 and 153:
High demand for apparel inputs such
- Page 154 and 155:
For example, Lesotho’s export gro
- Page 156 and 157:
increased European demand for appar
- Page 158 and 159:
Tanzania In 2004, A to Z Textile Mi
- Page 160 and 161:
Textiles Bibliography Brenton, Paul
- Page 162 and 163:
Wood Furniture Summary of Findings
- Page 164 and 165:
European Commission for the Promoti
- Page 166 and 167:
Figure 3.8 Leading global and sub-S
- Page 168 and 169:
Figure 3.9 Leading markets for glob
- Page 170 and 171:
producers to pursue increasingly di
- Page 172 and 173:
Box 3.11 Shift in sourcing of wood
- Page 174 and 175:
$805,000. 241 Consequently, the com
- Page 176 and 177:
A smaller exporter, Semak Ghana Ltd
- Page 178 and 179:
egulations are often part of a fore
- Page 180 and 181:
South Africa A focus in the 1994 Fo
- Page 182 and 183:
Wood Furniture Bibliography African
- Page 184 and 185:
International Log & Sawnwood Prices
- Page 186 and 187:
Wood Southern Africa & Timber Times
- Page 188 and 189:
Africa, 3 Kenya, and Ethiopia were
- Page 190 and 191:
Table 4.2 Leading sub-Saharan Afric
- Page 192 and 193:
Figure 4.1 Leading global a and sub
- Page 194 and 195:
sharing agreements, 19 capital inve
- Page 196 and 197:
Infrastructure Development Investme
- Page 198 and 199:
Ethiopia Aviation services exports
- Page 200 and 201:
South Africa is serviced by three i
- Page 202 and 203:
Aviation Services Bibliography Afri
- Page 204 and 205:
Otieno, Tobias. “Aircraft and Air
- Page 206 and 207:
Industry Overview The voice telecom
- Page 208 and 209:
Commensurate with the relatively la
- Page 210 and 211:
Factors Affecting Export Patterns D
- Page 212 and 213:
Table 4.4 Competition and state own
- Page 214 and 215:
the region. 114 National fiberoptic
- Page 216 and 217:
agricultural productivity and farm
- Page 218 and 219:
Nigeria Nigeria became the largest
- Page 220 and 221:
low penetration rates and liberaliz
- Page 222 and 223:
International Monetary Fund (IMF).
- Page 225:
APPENDIX A REQUEST LETTER
- Page 228 and 229:
A-4
- Page 231 and 232:
Federal Register / Vol. 72, No. 137
- Page 233:
APPENDIX C HEARING LIST OF PARTICPA
- Page 237:
APPENDIX D SUMMARY OF VIEWS OF INTE
- Page 240 and 241:
He indicated that COMESA has develo
- Page 242 and 243:
textile, apparel, and related indus
- Page 245:
Table E.1 Harmonized tariff schedul
- Page 249 and 250:
F‐3 App. F.1 Top 10 exports, by H
- Page 251 and 252:
F‐5 App. F.1 Top 10 exports, by H
- Page 253 and 254:
F‐7 App. F.1 Top 10 exports, by H
- Page 255 and 256:
F‐9 App. F.1 Top 10 exports, by H
- Page 257 and 258:
F‐11 App. F.1 Top 10 exports, by
- Page 259 and 260:
F‐13 App. F.1 Top 10 exports, by
- Page 261 and 262:
F‐15 App. F.1 Top 10 exports, by
- Page 263 and 264:
F‐17 App. F.1 Top 10 exports, by
- Page 265 and 266:
F‐19 App. F.1 Top 10 exports, by
- Page 267 and 268:
F‐21 App. F.1 Top 10 exports, by
- Page 269 and 270:
F‐23 App. F.1 Top 10 exports, by
- Page 271 and 272:
F‐25 App. F.1 Top 10 exports, by
- Page 273 and 274:
F‐27 App. F.1 Top 10 exports, by
- Page 275 and 276:
F‐29 App. F.1 Top 10 exports, by
- Page 277 and 278:
F‐31 App. F.1 Top 10 exports, by
- Page 279 and 280:
F‐33 App. F.1 Top 10 exports, by
- Page 281 and 282:
F‐35 App. F.1 Top 10 exports, by
- Page 283 and 284:
App. F.2 Leading SSA services expor
- Page 285 and 286:
App. F.2 Leading SSA services expor