CPT International 03/2015
The leading technical journal for the global foundry industry – Das führende Fachmagazin für die weltweite Gießerei-Industrie
The leading technical journal for the
global foundry industry – Das führende Fachmagazin für die
weltweite Gießerei-Industrie

Create successful ePaper yourself
Turn your PDF publications into a flip-book with our unique Google optimized e-Paper software.
MATERIALS<br />
a<br />
b<br />
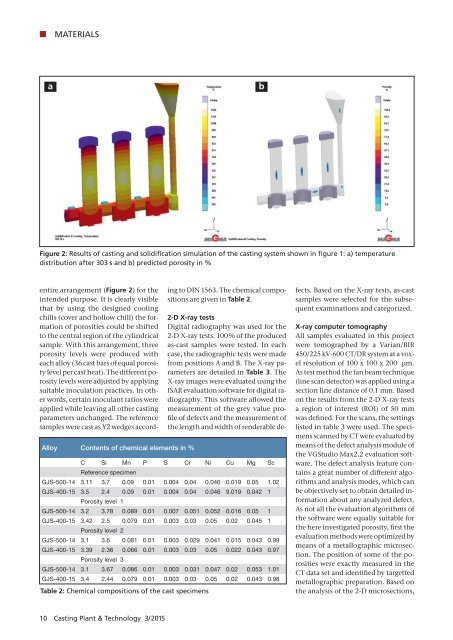
Figure 2:<br />
distribution after 3<strong>03</strong> s and b) predicted porosity in %<br />
Alloy Contents of chemical elements in %<br />
entire arrangement (Figure 2) for the<br />
intended purpose. It is clearly visible<br />
that by using the designed cooling<br />
chills ( cover and hollow chill) the formation<br />
of porosities could be shifted<br />
to the central region of the cylindrical<br />
sample. With this arrangement, three<br />
porosity levels were produced with<br />
each alloy (36 cast bars of equal porosity<br />
level per cast heat). The different porosity<br />
levels were adjusted by applying<br />
suitable inoculation practices. In other<br />
words, certain inoculant ratios were<br />
applied while leaving all other casting<br />
parameters unchanged. The reference<br />
samples were cast as Y2 wedges according<br />
to DIN 1563. The chemical compositions<br />
are given in Table 2.<br />
C Si Mn P S Cr Ni Cu Mg Sc<br />
Reference specimen<br />
GJS-500-14 3.11 3.7 0.09 0.01 0.004 0.04 0.046 0.019 0.05 1.02<br />
GJS-400-15 3.5 2.4 0.09 0.01 0.004 0.04 0.046 9.019 0.042 1<br />
Porosity level 1<br />
GJS-500-14 3.2 3.78 0.089 0.01 0.007 0.051 0.052 0.016 0.05 1<br />
GJS-400-15 3.42 2.5 0.079 0.01 0.0<strong>03</strong> 0.<strong>03</strong> 0.05 0.02 0.045 1<br />
Porosity level 2<br />
GJS-500-14 3.1 3.6 0.081 0.01 0.0<strong>03</strong> 0.029 0.041 0.015 0.043 0.99<br />
GJS-400-15 3.39 2.36 0.066 0.01 0.0<strong>03</strong> 0.<strong>03</strong> 0.05 0.022 0.043 0.97<br />
Porosity level 3<br />
GJS-500-14 3.1 3.67 0.086 0.01 0.0<strong>03</strong> 0.<strong>03</strong>1 0.047 0.02 0.053 1.01<br />
GJS-400-15 3.4 2.44 0.079 0.01 0.0<strong>03</strong> 0.<strong>03</strong> 0.05 0.02 0.043 0.98<br />
Table 2: Chemical compositions of the cast specimens<br />
2-D X-ray tests<br />
Digital radiography was used for the<br />
2-D X-ray tests. 100 % of the produced<br />
as-cast samples were tested. In each<br />
case, the radiographic tests were made<br />
from positions A and B. The X-ray parameters<br />
are detailed in Table 3. The<br />
X-ray images were evaluated using the<br />
ISAR evaluation software for digital radiography.<br />
This software allowed the<br />
measurement of the grey value profile<br />
of defects and the measurement of<br />
the length and width of renderable defects.<br />
Based on the X-ray tests, as-cast<br />
samples were selected for the subsequent<br />
examinations and categorized.<br />
X-ray computer tomography<br />
All samples evaluated in this project<br />
were tomographed by a Varian/BIR<br />
450/225 kV-600 CT/DR system at a voxel<br />
resolution of 100 x 100 x 200 μm.<br />
As test method the fan beam technique<br />
(line scan detector) was applied using a<br />
section line distance of 0.1 mm. Based<br />
on the results from the 2-D X-ray tests<br />
a region of interest (ROI) of 50 mm<br />
was defined. For the scans, the settings<br />
listed in table 3 were used. The specimens<br />
scanned by CT were evaluated by<br />
means of the defect analysis module of<br />
the VGStudio Max2.2 evaluation software.<br />
The defect analysis feature contains<br />
a great number of different algorithms<br />
and analysis modes, which can<br />
be objectively set to obtain detailed information<br />
about any analyzed defect.<br />
As not all the evaluation algorithms of<br />
the software were equally suitable for<br />
the here investigated porosity, first the<br />
evaluation methods were optimized by<br />
means of a metallographic microsection.<br />
The position of some of the porosities<br />
were exactly measured in the<br />
CT data set and identified by targetted<br />
metallographic preparation. Based on<br />
the analysis of the 2-D microsections,<br />
10 Casting Plant & Technology 3/<strong>2015</strong>