CPT International 03/2015
The leading technical journal for the global foundry industry – Das führende Fachmagazin für die weltweite Gießerei-Industrie
The leading technical journal for the
global foundry industry – Das führende Fachmagazin für die
weltweite Gießerei-Industrie

Create successful ePaper yourself
Turn your PDF publications into a flip-book with our unique Google optimized e-Paper software.
MATERIALS<br />
risk that, in case of a high yield ratio,<br />
failure of the component will occur instantaneously<br />
once the yield point has<br />
been exceeded.<br />
Figure 11 shows the yield ratios of<br />
the tested tensile samples of grades EN-<br />
GJS-500-14 and EN-GJS-400-15.<br />
Like in the case of the static performance<br />
values, as described above, porosity<br />
also has an effect on the yield<br />
ratio. The yield ratio increases with increasing<br />
porosity. However, the rise is<br />
only significant in the case of porosity<br />
levels 2 and 3. Consequently, the overload<br />
allowance of ductile cast iron decreases<br />
with increasing porosity.<br />
A highly critical aspect is the fact<br />
that this increase in yield ratio is the<br />
result of decreasing tensile strength<br />
and not of increasing yield strength<br />
with the tensile strength remaining at<br />
the same level.<br />
Cyclic performance values<br />
The S/N curves (50 % probability of<br />
fracture) of the reference specimens<br />
and of the specimens of porosity level<br />
1 are plotted in Figure 12. The fatigue<br />
limit for alloy EN-GJS-500-14 is<br />
above that of EN-GJS-400-15 for both<br />
specimen types (see S/N curves 1 and 2<br />
versus S/N curves 3 and 4). The higher<br />
Si content of alloy EN-GJS-500-14 has<br />
a positive effect on the cyclic performance<br />
values, similar to its effect on<br />
the static performance values.<br />
Figure 12 also shows that the fatigue<br />
limit of the samples of porosity<br />
level 1 is about 20 MPa or 8 –10 %<br />
lower than that of the reference samples.<br />
This holds true for both alloy EN-<br />
GJS-400-15 and alloy EN-GJS-500-14.<br />
Figure 13 compares the results from<br />
the horizontal tests (selected samples<br />
of alloys EN-GJS-500-14 and EN-<br />
GJS-400-15 subjected to a constant<br />
stress of 230 MPa) with the results from<br />
the defect analyses by means of Volume<br />
Graphics in the fracture region<br />
of the same samples (see figure 7). It is<br />
obvious that the fatigue limit decreases<br />
along with a growing porosity volume<br />
(3-D) and a growing projection<br />
area (2-D).<br />
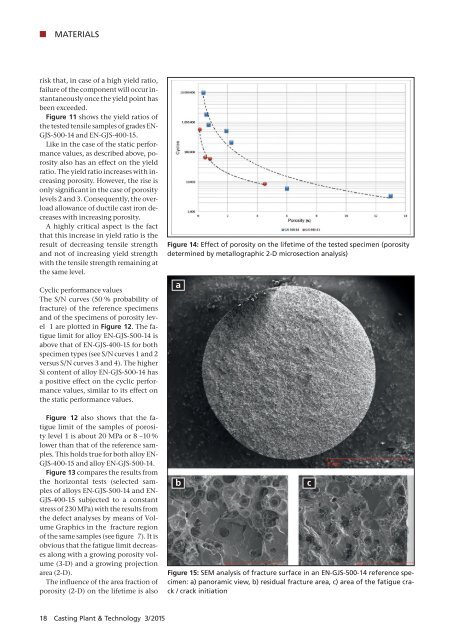
The influence of the area fraction of<br />
porosity (2-D) on the lifetime is also<br />
Figure 14: Effect of porosity on the lifetime of the tested specimen (porosity<br />
determined by metallographic 2-D microsection analysis)<br />
a<br />
b<br />
Figure 15: SEM analysis of fracture surface in an EN-GJS-500-14 reference specimen:<br />
a) panoramic view, b) residual fracture area, c) area of the fatigue crack<br />
/ crack initiation<br />
c<br />
18 Casting Plant & Technology 3/<strong>2015</strong>