CPT International 03/2015
The leading technical journal for the global foundry industry – Das führende Fachmagazin für die weltweite Gießerei-Industrie
The leading technical journal for the
global foundry industry – Das führende Fachmagazin für die
weltweite Gießerei-Industrie

Create successful ePaper yourself
Turn your PDF publications into a flip-book with our unique Google optimized e-Paper software.
MATERIALS<br />
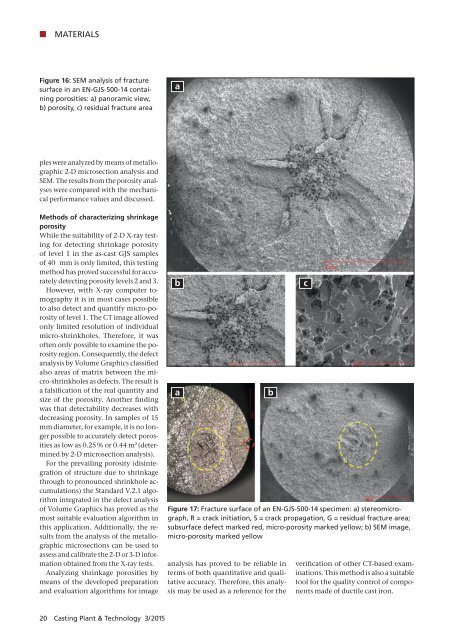
Figure 16: SEM analysis of fracture<br />
surface in an EN-GJS-500-14 containing<br />
porosities: a) panoramic view,<br />
b) porosity, c) residual fracture area<br />
a<br />
ples were analyzed by means of metallographic<br />
2-D microsection analysis and<br />
SEM. The results from the porosity analyses<br />
were compared with the mechanical<br />
performance values and discussed.<br />
Methods of characterizing shrinkage<br />
porosity<br />
While the suitability of 2-D X-ray testing<br />
for detecting shrinkage porosity<br />
of level 1 in the as-cast GJS samples<br />
of 40 mm is only limited, this testing<br />
method has proved successful for accurately<br />
detecting porosity levels 2 and 3.<br />
However, with X-ray computer tomography<br />
it is in most cases possible<br />
to also detect and quantify micro-porosity<br />
of level 1. The CT image allowed<br />
only limited resolution of individual<br />
micro-shrinkholes. Therefore, it was<br />
often only possible to examine the porosity<br />
region. Consequently, the defect<br />
analysis by Volume Graphics classified<br />
also areas of matrix between the micro-shrinkholes<br />
as defects. The result is<br />
a falsification of the real quantity and<br />
size of the porosity. Another finding<br />
was that detectability decreases with<br />
decreasing porosity. In samples of 15<br />
mm diameter, for example, it is no longer<br />
possible to accurately detect porosities<br />
as low as 0.25 % or 0.44 m 2 (determined<br />
by 2-D microsection analysis).<br />
For the prevailing porosity (disintegration<br />
of structure due to shrinkage<br />
through to pronounced shrinkhole accumulations)<br />
the Standard V.2.1 algorithm<br />
integrated in the defect analysis<br />
of Volume Graphics has proved as the<br />
most suitable evaluation algorithm in<br />
this application. Additionally, the results<br />
from the analysis of the metallographic<br />
microsections can be used to<br />
assess and calibrate the 2-D or 3-D information<br />
obtained from the X-ray tests.<br />
Analyzing shrinkage porosities by<br />
means of the developed preparation<br />
and evaluation algorithms for image<br />
b<br />
a<br />
b<br />
Figure 17: Fracture surface of an EN-GJS-500-14 specimen: a) stereomicrograph,<br />
R = crack initiation, S = crack propagation, G = residual fracture area;<br />
subsurface defect marked red, micro-porosity marked yellow; b) SEM image,<br />
micro-porosity marked yellow<br />
analysis has proved to be reliable in<br />
terms of both quantitative and qualitative<br />
accuracy. Therefore, this analysis<br />
may be used as a reference for the<br />
c<br />
verification of other CT-based examinations.<br />
This method is also a suitable<br />
tool for the quality control of components<br />
made of ductile cast iron.<br />
20 Casting Plant & Technology 3/<strong>2015</strong>