Problems Solutions Good Practices - UITP
Problems Solutions Good Practices - UITP
Problems Solutions Good Practices - UITP

You also want an ePaper? Increase the reach of your titles
YUMPU automatically turns print PDFs into web optimized ePapers that Google loves.
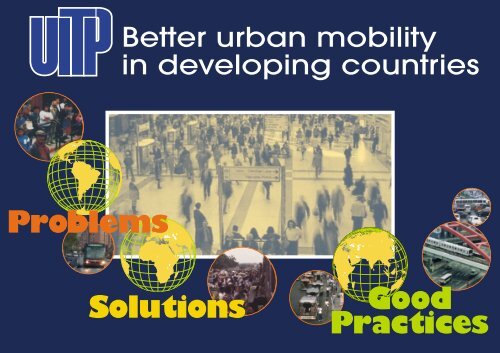
<strong>Problems</strong><br />
Better urban mobility<br />
in developing countries<br />
<strong>Solutions</strong><br />
<strong>Good</strong><br />
<strong>Practices</strong>
Contents<br />
Better Urban Mobility in Developing Countries 1<br />
The Vicious Circle of Urban Transport Degradation 2<br />
Problem 1: More and more people are living in urban areas 3<br />
Problem 2: Many cities are developing anarchically 4<br />
Problem 3: There is a lack of dedicated institutions to address<br />
urban mobility issues 5<br />
Problem 4: People have limited access to motorized transport 6<br />
Problem 5: Cities are under-investing in infrastructure 7<br />
Problem 6: Air in urban areas is increasingly polluted 8<br />
Problem 7: Too many people die or are injured in traffic accidents 9<br />
Problem 8: Growing congestion is a widespread problem<br />
in almost all cities 10<br />
Problem 9: Urban sprawl and usage of cars increases emissions<br />
of greenhouse gases<br />
Problem 10: Increase in travel also means increase in energy<br />
11<br />
consumption 12<br />
Problem 11: Car infrastructure uses urban space inefficiently 13<br />
Sustainable <strong>Solutions</strong> 14<br />
Solution 1: Sustaining economic development through efficient<br />
and effective public transport 15<br />
Solution 2: Supporting poverty reduction goals by offering good<br />
access to the city 16<br />
Solution 3: Creating a local or regional transport authority to<br />
support local policy-making 17<br />
Solution 4: Financing public transport operations and investments 18<br />
Solution 5: Improving air quality by emphasising more<br />
environmentally-friendly modes 19<br />
Solution 6: Making travel safer by allocating dedicated space<br />
and enforcing standards 20<br />
Solution 7: Reducing traffic jams by preserving road capacity<br />
and limiting parking 21<br />
Solution 8: Making more energy efficient cities by increasing<br />
density and public transport use 22<br />
Solution 9: Organising and co-operating with paratransit services 23<br />
Solution 10: Shaping city development using public transport as<br />
a backbone 24<br />
Solution 11: Improving quality of life with a better use of urban<br />
space 25<br />
The three pillars of sustainable mobility<br />
<strong>Good</strong> Practice 1: Reforming transport institutions and empowering<br />
26<br />
local authorities 27<br />
<strong>Good</strong> Practice 2: Restoring a quality of life in the city 28<br />
<strong>Good</strong> Practice 3: Integrating transport and land-use planning<br />
<strong>Good</strong> Practice 4: Introducing emission standards to curb air<br />
29<br />
pollution<br />
<strong>Good</strong> Practice 5: Relieving congestion through high-capacity<br />
30<br />
services<br />
<strong>Good</strong> Practice 6: Raising awareness and helping communities<br />
31<br />
using public transport facilities 32<br />
<strong>Good</strong> Practice 7: Providing training and creating local knowledge 33<br />
<strong>Good</strong> Practice 8: Giving public transport priority 34<br />
<strong>Good</strong> Practice 9: Adapting public transport to customers’ needs<br />
<strong>Good</strong> Practice 10:Giving simple and useful travel information to<br />
35<br />
customers<br />
<strong>Good</strong> Practice 11:Easing access to public transport with<br />
36<br />
information technology<br />
<strong>Good</strong> Practice 12:Focusing on the customer through a quality<br />
37<br />
commitment 38<br />
<strong>Good</strong> Practice 13:Bringing public transport closer to the customer 39<br />
References 40<br />
Presentation of <strong>UITP</strong> 43<br />
To Contact Us 44
Better Urban Mobility in Developing Countries<br />
Today, developing countries are facing great challenges in their journey towards economic development, may it be socioeconomic<br />
changes, education, health, the environment. However, urban transport remains largely unaddressed. With<br />
population growth and an increase in motorization, pressure is building up on transport systems in cities of the developing<br />
world. In situations that are already difficult, socio-economic marginalisation, air and noise pollution, congestion and traffic<br />
fatalities are deeply threatening economic development and the quality of life in cities of the developing world.<br />
For a long time, public transport was neglected, in the same way as walking or cycling, in favour of cars. However, public<br />
transport has now become part of a number of pioneer mobility policies in cities in Latin America, Asia and Africa. This<br />
trend should be generalised if the majority of the population in developing countries is to benefit from reliable and<br />
affordable transport. To achieve this goal, decision-makers must give priorities to developing sustainable transport systems<br />
that give a better place to public transport and non-motorized modes.<br />
Though the underlying reason for travelling is the same in the developed and developing world, the challenges of urban<br />
transport differ greatly. This brochure, specific to the developing world, is not only intended to reveal urban transport<br />
problems but also to provide concrete solutions and good practices from the developing world. <strong>UITP</strong> is, more than ever,<br />
committed to the promotion of public transport for all and, in this respect, effectively addressing transport needs in<br />
developing countries.<br />
Wolfgang Meyer<br />
President <strong>UITP</strong><br />
Phillipe Attey<br />
Vice President <strong>UITP</strong><br />
African Division<br />
Jurandir F.R. Fernandes<br />
Vice President <strong>UITP</strong><br />
Latin America Division<br />
Hup Foi Tan<br />
Vice President <strong>UITP</strong><br />
Asia-Pacific Division<br />
Hans Rat<br />
Secretary General <strong>UITP</strong><br />
1
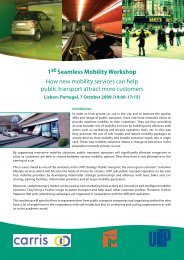
2<br />
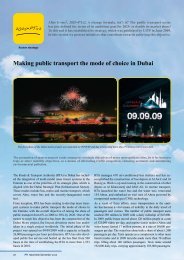
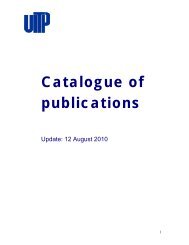
Vicious Circle of Urban Degradation<br />
Emigrants come<br />
to the city<br />
Emigrants settle in the city<br />
outskirts, legally or illegally<br />
Informal Sector<br />
Develops<br />
Walking and<br />
bicycle<br />
Poor Land Use<br />
Management<br />
No Provision of Public<br />
Transport<br />
Congestion<br />
Public Transport<br />
increasingly slow<br />
and unreliable<br />
Users switch to<br />
other modes<br />
Low Income High Income<br />
City Less Accessible for All<br />
Income Increases Favorable Policies to<br />
Private Modes<br />
More and<br />
Longer Trips<br />
More Cars,<br />
More Road Traffic<br />
More Road Capacity<br />
Political Pressure<br />
Urban Sprawl
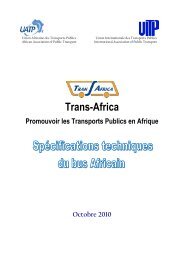
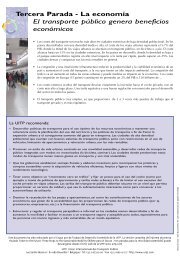
More and more people are living<br />
in urban areas<br />
Urban Population Trends<br />
Millions<br />
5000<br />
4000<br />
3000<br />
2000<br />
1000<br />
Developing Regions<br />
Developed Regions<br />
0<br />
861<br />
734<br />
2135<br />
898<br />
Year<br />
3247<br />
954<br />
In 2000, 35% of the world population was living in urban areas in<br />
developing countries. This is estimated to rise to 45% in 2015.<br />
The world population is forecasted to grow exponentially<br />
in the developing world, with the majority of growth<br />
concentrating in urban areas.<br />
As population grows, travel demands also grow.<br />
Consequently, developing cities will be faced with an<br />
increase in urban mobility demands that can be<br />
supported neither by existing facilities and infrastructures<br />
nor by past and current car-centred policies.<br />
In the developing world 2005 2015<br />
10 million or more 15 17<br />
5 million to 10 million 20 31<br />
1 million to 5 million 280 378<br />
More people and larger cities<br />
Population and economic growth increase<br />
mobility demand in urban areas<br />
Problem 1<br />
3
Problem 2<br />
4<br />
Many cities are developing anarchically<br />
This past century, demographic pressure, increase in the<br />
level of economic activities in urban areas and deficient<br />
urban planning resulted in the development of anarchic<br />
cities, even anarchic megalopolises. The challenge<br />
remains as population and activities are expected to<br />
grow even more.<br />
Most city developments are in low-density areas further<br />
expanding the metropolitan area.<br />
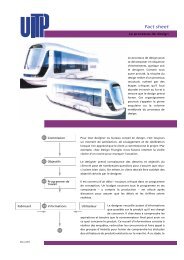
9.4 million inhabitants were living in Cairo in 2000. The UN forecasts a<br />
population of 11.5 million in 2015, most of the growth occurring in<br />
spontaneous areas<br />
Favelas in Rio de Janeiro concentrate poverty into particular areas of this<br />
wealthy Brazilian city<br />
In growing cities, many neighbourhoods are becoming less<br />
and less connected and integrated to the rest of the city.<br />
Urban sprawl accentuates the marginalisation of the poor<br />
by creating ghettos without proper public infrastructures.<br />
Chaotic city development threatens quality of life<br />
and the ability to meet mobility needs
There is a lack of dedicated institutions to<br />
address urban mobility issues<br />
In Lagos, Nigeria, due to a lack of public regulation until just recently, the<br />
informal sector has been the only provider of collective transport<br />
Urban transport has up to now seldom been a priority for<br />
decision-makers.<br />
First and foremost, city transport policy-making and<br />
management has often been centralised at the national<br />
level, far from local issues. In addition, in many cities there<br />
are no dedicated institutions in charge of transport at a<br />
metropolitan level.<br />
Second, even when transport competencies are<br />
decentralised, there is a fragmentation of the policymaking<br />
process. Transport-related competencies are<br />
repartitioned among various administrations (infrastructure,<br />
finance, traffic regulation, etc.) leading to a lack<br />
of comprehensive policies.<br />
Eventually, in a deregulated environment, the informal<br />
sector takes over in providing collective transport but<br />
without achieving its public service goals.<br />
Few comprehensive and integrated policies are<br />
formulated to manage and regulate urban transport<br />
Problem 3<br />
5
Problem 4<br />
6<br />
People have limited access to motorized<br />
transport<br />
Though it varies much between countries and regions,<br />
equal opportunity for access to transport is far from being<br />
achieved.<br />
In developed countries, the vast majority of people have<br />
access either to public transport or private modes and<br />
often have the choice of both. However, low average<br />
income does not allow the majority of people in the<br />
developing world to have access to private motorized<br />
transport, making them dependent on other modes.<br />
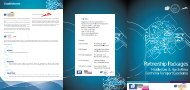
Daily trips par Capita<br />
Western Europe<br />
North America<br />
Affluent Asia<br />
Latin America<br />
Middle East/<br />
North Africa<br />
Other Asian Cities<br />
Africa<br />
0,0 0,5 1,0 1,5 2,0 2,5 3,0 3,5<br />
Walking Public Transport Private modes<br />
People in developing countries are making less trips<br />
General costs to own and use a vehicle in<br />
Asian cities (US$ 1992)<br />
City Purchase of<br />
a new vehicle<br />
Annual operating<br />
and maintenance<br />
Motorcycle Car Motorcycle Car<br />
Phnom-Penh<br />
(Cambodia) 1690 25100 174 600<br />
Kanpur<br />
(India) 1200 6400 349 1000<br />
Surabaya<br />
(Indonesia) 1480 24600 183 820<br />
Manila<br />
(Philippines) 1760 31300 147 1130<br />
Chiang Mai<br />
(Thailand) 1520 19800 239 1280<br />
Penang<br />
(Malaysia) 2000 16000 380 2230<br />
Hence, when public transport is not available, people<br />
can only rely on walking or cycling.As cities are sprawling,<br />
travel times are getting longer and longer and access to<br />
basic services becomes increasingly difficult.<br />
Inhabitants of developing countries often do not<br />
have the choice of mode of transport most adapted<br />
to their needs
Cities are under-investing in infrastructure<br />
Investment per Capita<br />
Middle East<br />
Africa<br />
Latin America<br />
Other Asian Cities<br />
North America<br />
Western Europe<br />
Affluent Asia<br />
0 100 200 300 400 500 600<br />
US $/person<br />
Public Transport<br />
Roads<br />
Developing countries invest little in general, even less in public transport<br />
The low priority given to urban transport combined with<br />
limited funds has resulted in a low level of investment in<br />
infrastructure in the developing world, with regard to both<br />
public transport and roads. Moreover, whenever<br />
governments invest in transport infrastructure, it is often<br />
aimed at car-based infrastructures (i.e. highways and<br />
parking spaces), not necessarily the most accessible for<br />
the majority of the population.<br />
Low investments are generally synonymous with poor<br />
maintenance and degradation, a decrease in the levelof-service<br />
and poor safety records.<br />
Situations that are already problematic<br />
are getting worse<br />
Problem 5<br />
7
Problem 6<br />
8<br />
Air in urban areas is increasingly polluted<br />
Transport is a major contributor to pollutants such as CO,<br />
NOx, SO2, lead and particulate matter. The World Health<br />
Organization (WHO) estimates that about 700,000 deaths<br />
annually could be prevented in developing countries if<br />
three major atmospheric pollutants - CO, particulate<br />
matter and lead - were reduced to safer levels.<br />
In Mexico City - the WHO estimates that Mexico City's<br />
concentration of suspended particulates is on average<br />
179 mg/m3, nearly twice the recommended level of 90<br />
mg/m3. The exhaust fumes of the 3 million cars in the city<br />
are primarily responsible for this low air quality.<br />
In Tehran, a quarter of the car fleet is without any emission<br />
control and is over 20 years old. In December 2001, the<br />
level of pollution was so high that authorities had to shut<br />
down schools and close the city centre to cars, advising<br />
everyone to stay indoors.<br />
Motorbike taxis exposure to carcinogenic<br />
pollutants - Cotonou<br />
µg/m3 Benzene Toluene Ethyl<br />
benzene<br />
Crossroads<br />
Dedokpo 144 329 62<br />
Sacré-Cœur 199 436 84<br />
Marina 280 679 130<br />
Personal Badges<br />
Driver 1 292 631 125<br />
Driver 2 186 403 83<br />
Driver 3 91 217 39<br />
Driver 4 251 473 93<br />
Health Norms 5 260 100<br />
Organization (UE) (WHO) (WHO)<br />
In Cotonou (Benin), the Zemidjans (motorbike taxis) have exposed<br />
inhabitant and drivers to levels of pollution far above the health standard<br />
in terms of carcinogenic pollutants<br />
The direct health cost of urban air pollution in<br />
developing countries was estimated in 1995 to be<br />
nearly US$100 billion a year.
Too many people die or are injured<br />
in traffic accidents<br />
In New Delhi, pedestrians, motorcycles, buses and cars share the same<br />
road space, incurring many fatalities<br />
Inappropriate infrastructure and poor regulation promote<br />
a mixed use of existing infrastructure. This generates<br />
conflicts between pedestrians/bicycles and motorized<br />
modes which leads to a particularly high rate of injuries<br />
and fatalities, most of the victims being pedestrians and<br />
two wheelers drivers<br />
In addition, travelling is made dangerous for car<br />
passengers due to a lack of basic safety standards, like<br />
safety belts, and old vehicle fleets.<br />
Total transport deaths per million people<br />
Brasilia 553.25<br />
Rio de Janeiro 331.83<br />
Kuala Lumpur 282.73<br />
Johannesburg 261.8<br />
Jakarta 227.05<br />
Bogotá 204.5<br />
Bangkok 192.07<br />
Tunis 146.16<br />
Harare 139.64<br />
Guangzhou 137.27<br />
Caracas 118.89<br />
NORTH AMERICA 106.56<br />
WESTERN EUROPE 72.34<br />
AFFLUENT ASIA 59.37<br />
Transport mortality is higher in developing cities<br />
and the most vulnerable populations are cyclists<br />
and pedestrians<br />
Problem 7<br />
9
Problem 8<br />
10<br />
Growing congestion is a widespread<br />
problem in almost all cities<br />
Though motorization remains low in developing countries,<br />
inadequate infrastructure, low capacity and poor traffic<br />
control create heavy congestion in large urban areas,<br />
costing more and more to the society in terms of hours<br />
lost in traffic and longer commuting times. The informal<br />
sector, cars and motorcycles are all contributing to this<br />
congestion.<br />
Estimated losses due to traffic jams in<br />
1996-1997<br />
City Annual Cost<br />
of Time Delay<br />
(million US$)<br />
Bangkok<br />
Jakarta<br />
Kuala Lumpur<br />
Manila<br />
272<br />
68<br />
68<br />
51<br />
Percent of<br />
Regional Gross<br />
National Product<br />
2.1<br />
0.9<br />
1.8<br />
0.7<br />
Commuters are already losing time in traffic jams and this can only get<br />
worse as motorization is forecasted to increase in the developing world<br />
Congestion threatens economic viability and<br />
aggravates pollution
Urban sprawl and usage of cars<br />
increases emissions of greenhouse gases<br />
World Carbon Emissions 1990 and 1997<br />
Million Tons<br />
1345<br />
1480<br />
United<br />
States<br />
1990 Million tons<br />
1997 Million tons<br />
933 918<br />
Western<br />
Europe<br />
1337<br />
878<br />
Eastern<br />
Europe<br />
274 297<br />
The share of carbon emissions from developing countries is expected<br />
to grow as they become more and more motorized<br />
620<br />
822<br />
156 236<br />
876<br />
1200<br />
Japan China India Other<br />
Developing<br />
Countries<br />
Even though the emission of Greenhouse Gases (GHG) is<br />
lower per capita, the developing world increasingly<br />
contributes to climate change. Further motorization due<br />
to population growth and the increasing private travel<br />
demands will accentuate the Greenhouse Effect,<br />
jeopardising efforts to limit climate change.<br />
Motor Vehicles in Use in Delhi (thousands)<br />
Year Scooters Cars/jeeps All motor<br />
and vehicles<br />
motorcycles<br />
1971 93 57 180<br />
1980 334 117 521<br />
1990 1077 327 1547<br />
2000 1568 852 2584<br />
2010 2958 1472 4809<br />
2020 6849 2760 10339<br />
Motorization in New Delhi is forecast to almost double every decade<br />
and GHG emission are estimated to increase by 65% by 2010<br />
Urban transport in developing countries is<br />
increasingly contributing to climate change<br />
Problem 9<br />
11
Problem 10<br />
12<br />
Increase in travel also means increase in<br />
energy consumption<br />
The International Energy Agency (IEA) has projected that<br />
the transport sector will be the primary user of energy by<br />
the year 2020. That same year, the world energy<br />
consumption will have grown by 66%, due in great part to<br />
the developing countries.<br />
The world consumption of energy is largely based on fossil<br />
sources. In the case of transport, petroleum accounts for<br />
more than 95% of its energy needs. As a result of<br />
motorization, the demand for oil cannot be sustained and<br />
the energy cost for developing countries can become a<br />
real burden when oil is bought with foreign currencies.<br />
Total Energy Consumption<br />
2000<br />
1800<br />
1600<br />
1400<br />
1200<br />
1000<br />
800<br />
600<br />
400<br />
200<br />
0<br />
1979 1984 1989 1994<br />
Central America South America Middle East South East Asia<br />
More energy also means more oil and greater costs<br />
Developing countries will become more<br />
and more energy dependent<br />
Million Tons of Oil Equivalent<br />
Central Asia Africa South Asia
Car infrastructure uses urban space<br />
inefficiently<br />
Brasilia was built to accommodate cars, with a lot of space for roads and<br />
parking<br />
Each mode of transport uses space for moving and<br />
parking over a given period of time. However, a private<br />
car is the largest consumer of space as it spends 90% (or<br />
22 hours per day) of its life stationary (i.e. parked).<br />
Subsequently, enormous quantities of valuable urban<br />
space are used uneconomically only for parking at<br />
home, at the office, in commercial areas.<br />
In addition, road infrastructure needed to accommodate<br />
travel demands also consumes much space, sometimes<br />
disrupting communities and marginalising entire<br />
neighbourhoods.<br />
Economic value is lost and some living areas are<br />
marginalised by car-based infrastructure<br />
Problem 11<br />
13
14<br />
Sustainable <strong>Solutions</strong><br />
• Air Quality<br />
• Safety<br />
• Congestion<br />
• Energy<br />
Environmental<br />
protection<br />
ECONOMY<br />
Social & economic<br />
equity<br />
Sustainability<br />
ENVIRONMENT<br />
SOCIAL EQUITY<br />
• Economic Development<br />
• Poverty Reduction<br />
• Institutions<br />
• Finance<br />
Community<br />
livability<br />
Sustainable solutions to urban mobility<br />
must take into account: the economy,<br />
the environment and social equity<br />
• Public Transport<br />
and Paratransit<br />
• City Development<br />
• Quality of Life
Sustaining economic development through<br />
efficient and effective public transport<br />
Education<br />
Public<br />
Transport<br />
Health<br />
Leisure Jobs<br />
Economic activities require a movement of people<br />
between residential areas and jobs, leisure and shopping.<br />
Therefore, an efficient and effective transport network is<br />
required to link activities and people.<br />
Because transport demand is concentrated in time<br />
(during the morning and the evening peak hours) and in<br />
space, public transport can more efficiently link activities<br />
and people.<br />
Typical peak hour pattern<br />
Transport flow<br />
Morning<br />
Peak<br />
Evening<br />
Peak<br />
Public transport offers an efficient<br />
and effective access to activities<br />
Time of the day<br />
Solution 1<br />
15
Solution 2<br />
16<br />
Supporting poverty reduction goals<br />
by offering good access to the city<br />
In the context of low income and low accessibility,<br />
transport costs can represent up to 30% of household<br />
budgets excluding the time spent travelling. Public<br />
transport can provide an efficient way to give people<br />
access to basic services. Indeed, it will help those most<br />
marginalised if they have easy and affordable access to<br />
jobs, health centres, schools, universities and<br />
administrative centres, ensuring greater social cohesion.<br />
Access is also for people with disabilities<br />
Relative expenses in Transport<br />
Social policies can only have limited impacts<br />
if people are not given good and affordable<br />
access to basic needs<br />
Percentage of Income<br />
40,0<br />
35,0<br />
30,0<br />
25,0<br />
20,0<br />
15,0<br />
10,0<br />
5,0<br />
0,0<br />
Private Transport<br />
Public Transport<br />
0-250 250-500 500-1000 1000-1800 1800-3600 >3600<br />
Absolute and relative transport expenses by income level,<br />
Sao Paulo, 1997<br />
Reais$/month
Creating a local or regional transport<br />
authority to support local policy-making<br />
Urban transport is a great challenge in many aspects, due<br />
to numerous conflicting issues. To address this challenge,<br />
there must be an integrated transport authority that<br />
ensures cohesive policies with respect to all the different<br />
stakeholders.<br />
Indeed, planning a transport network and financing<br />
infrastructure ought to be done in a coherent way if<br />
projects are to be realized. Also, regulating traffic and<br />
public transport can be difficult to balance if done<br />
separately, as measures from one administration could<br />
counteract those of another administration.<br />
A transport authority once established must build<br />
legitimacy by developing strong ties with the local<br />
stakeholders in order to address urban transport<br />
challenges. They include:<br />
• Local communities<br />
• Transport user associations<br />
• Businesses and major employers<br />
• Public/private transport operators<br />
• Land-use agencies<br />
• Intercity operators<br />
• Decision-makers/elected officials<br />
Transport authorities will need to focus on strategic<br />
planning and establishing the best conditions for public<br />
transport to flourish, setting transport policies which<br />
complement the efforts of those who are actually<br />
developing and operating the public transport system.<br />
Only co-operation between transport actors<br />
can help to resolve urban transport issues<br />
Solution 3<br />
17
Solution 4<br />
18<br />
Financing public transport operations<br />
and investments<br />
In general, the financing of the operation and investment<br />
of public transport cannot be fully covered by the<br />
revenue from fares. Outside financial support is often<br />
required to fill the gap between income from passenger<br />
fares and costs of operation and investments. It only<br />
reflects that fares and service levels are set with specific<br />
policy objectives in mind. Governments, local authorities<br />
and other bodies, including the private sector, thus make<br />
funds available to public transport for economic, social,<br />
transport and environmental reasons.<br />
The alternatives to direct funding by the user can be<br />
considered under three main headings:<br />
• Polluter Pays: those who cause a problem compensate<br />
for the cost imposed on the community. Environmental<br />
taxes on the use and ownership of cars and parking<br />
charges can be levied.<br />
• Beneficiary Pays: those who gain benefit from a<br />
service meet its costs. In France, the Transport Tax<br />
(“Versement Transport”) requires employers with more<br />
than nine staff to contribute towards the cost of public<br />
transport investment and operation. In Hong-Kong, the<br />
construction of new metro infrastructure is partly<br />
funded from the rents and sale values of property<br />
adjacent to metro stations.<br />
The Financing of Public<br />
Transport Operations<br />
• General Public Pays: through national and local<br />
taxation, whether or not they are public transport users.<br />
In practice, funding of public transport may involve a<br />
combination of mechanisms. The need for public funding<br />
should be clearly recognised because in most cases<br />
public transport requires external finance in order to<br />
provide a level and quality of service defined by a policy<br />
at a price which could not otherwise be achieved. It is<br />
justified by:<br />
• The full potential of public transport to contribute to<br />
mobility, to the functioning of urban economies, to the<br />
urban environment, and to combating social exclusion<br />
• The fact that funding required is not a subsidy, but a<br />
payment for a service rendered to the community<br />
• The funding of a public good, for the same reason as<br />
roads are provided for free to cars.<br />
Measures should be taken to ensure that maximum value<br />
for money is obtained by the external funding provided.<br />
These include:<br />
• the contractualisation/formalisation of relations<br />
between operators and authorities,<br />
• provisions for giving incentives to operators and for<br />
adjustments to contracts to meet changes in costs<br />
outside the control of the operator.<br />
Funding public transport is not a subsidy but a<br />
payment to provide a level and a quality of service,<br />
at a price which could not otherwise be achieved
Improving air quality by emphasizing more<br />
environmentally-friendly modes<br />
Emission Rates in London<br />
(grams/passenger-km) by mode, 1997<br />
Cars Buses Metro*<br />
Carbon Monoxide 12.9 0.3 0.03<br />
Hydrocarbons 1.9 0.1 0.0<br />
Oxides of Nitrogen 0.8 1.2 0.3<br />
Oxides of Sulphur 0.05 0.02 0.15<br />
Lead 0.02 / /<br />
Particulate Matter 0.04 0.02 0.01<br />
Carbon Dioxide 197 89 91<br />
*Correspond to the emission of the electric power<br />
supplier<br />
Comparative studies in London show that public transport is less<br />
polluting than cars because emissions are spread over the group of<br />
users<br />
Cars and motorcycles, which are responsible for most<br />
emissions, can be substituted in part by more sustainable<br />
modes. Environmentally-friendly modes include cycling,<br />
walking and also public transport run by:<br />
• Biodiesel or clean diesel powered engines (buses) with<br />
catalytic filters<br />
• CNG-powered engines (buses)<br />
• Electric-powered engines (heavy and light rail, buses).<br />
Cities must evaluate what trade-offs they are willing to<br />
make between the economy and the environment, and<br />
choose the best alternative accordingly.<br />
The myth of empty buses<br />
Despite popular belief, research in Sao Paulo shows<br />
that a standard 45-seat diesel bus with only two<br />
passengers emits less carbon monoxide, carbon<br />
dioxide and less hydrocarbons per person than a<br />
private car with an occupancy of 1.5 passengers.<br />
But not everyone will or can travel by public<br />
transport all the time so a balance needs to be<br />
created through integrated planning, incentives,<br />
regulation and a reduction in car-use.<br />
The use of public transport helps to improve air<br />
quality and must be a leading example in setting<br />
emission standards<br />
Solution 5<br />
19
Solution 6<br />
20<br />
Making travel safer by allocating dedicated<br />
space and enforcing standards<br />
Each transport mode provides an answer to a specific<br />
travel demand and a single mode will never answer all<br />
needs in a sustainable way. In urban areas, people should<br />
be allowed to choose their modes and use it in the safest<br />
way. The most vulnerable users should be protected by<br />
avoiding conflicts between the different traffic flows and<br />
by creating dedicated infrastructure such as cycle paths<br />
or sidewalks.<br />
In Dar Es Salaam, Tanzania, the municipality has put cycle paths at the<br />
top of their agenda, to improve low-cost mobility<br />
On the other hand, safety is also a matter of enforcing<br />
basic safety standards and making sure people are not<br />
neglecting them. Simply enforcing the use of safety belts<br />
for car users or helmets for motorcycle users can<br />
drastically reduce passenger fatalities.<br />
City authorities need to protect vulnerable road<br />
users and obtain more respect from drivers
Reducing traffic jams by preserving road<br />
capacity and limiting parking<br />
In Bogotá, the provision and<br />
enforcement of parking has<br />
considerably improved traffic<br />
conditions on the road<br />
Various activities tend to overflow on roads, limiting the<br />
infrastructure capacity, in particular illegal parking and<br />
commercial activities. Illegal parking, for example, in a<br />
city’s busiest areas can take up to two lanes of capacity.<br />
Public transport is often running on the right lane and is<br />
consequently stuck in traffic.<br />
The provision of parking places and the strict<br />
enforcement of its use can help tackle part of the<br />
congestion.<br />
In addition, control of parking capacity is the most<br />
effective way to convince drivers to leave their cars at<br />
home.<br />
Enforcing parking policies and preventing other<br />
activities from spilling onto the roads will allow<br />
public and private transport to run more smoothly<br />
Solution 7<br />
21
Solution 8<br />
22<br />
Making more energy efficient cities by<br />
increasing density and public transport use<br />
<strong>UITP</strong> studies show that the densest cities are also the most<br />
energy-efficient for traffic purposes.<br />
In low-density areas, the car dominates the choice of<br />
transport.<br />
Denser urban areas are more energy-efficient because<br />
they favour:<br />
• Non-motorized trips, as distances are short enough for<br />
people to access jobs, leisure, retails by walking or<br />
cycling;<br />
• Public transport (as shown in the <strong>UITP</strong> Millennium Cities<br />
Database) is more energy-efficient than cars.<br />
Energy Use by Urban Mode<br />
(MJ/Passenger-km)<br />
Mode Vehicles Production Fuel Total<br />
Light Rail 0.7 1.4 2.1<br />
Bus 0.7 2.1 2.8<br />
Heavy Rail 0.9 1.9 2.8<br />
Car, Petrol 1.4 3.0 4.4<br />
Car, Diesel 1.4 3.3 4.7<br />
From production to use, public transport is more energy-efficient<br />
Density vs Energy Consumption<br />
per inhabitants per year for traffic<br />
purposes<br />
0<br />
0 50 100 150 200 250 300 350 400<br />
Putting an end to urban sprawl will lead<br />
to more energy-efficient cities<br />
Energy consumption (megaJ)<br />
120000<br />
100000<br />
80000<br />
60000<br />
40000<br />
20000<br />
Density (inhab/ha)
Organising and cooperating with paratransit<br />
services<br />
In Dakar, the transport authority (CETUD) moved towards a regulation of<br />
the paratransit sector. The president of the paratransit operators<br />
association recently signed the urban mobility charter established by<br />
CETUD<br />
In many cities, paratransit is a prominent actor in providing<br />
collective transport. It often represents the last alternative<br />
for affordable transport for many, despite the<br />
dysfunctionalities it may impose.<br />
In such a context of urban mobility, the situation can be<br />
greatly improved if policy-makers ensure that paratransit<br />
is included in providing better mobility for citizens.<br />
To achieve this goal, public authorities must first push for a<br />
legalization of the activity, for example by giving licenses<br />
to operators. These licenses must be linked to agreements<br />
established between the paratransit operators and the<br />
authorities on topics such as:<br />
• Fares<br />
• Timetables<br />
• Safety<br />
• Areas of operations.<br />
Urban transport policies must take into account<br />
paratransit in order to limit their externalities<br />
Solution 9<br />
23
Solution 10<br />
24<br />
Shaping city development using public<br />
transport as a backbone<br />
Growth and development is very likely to happen in areas<br />
near high-quality public transport networks because the<br />
areas become more accessible and attractive.<br />
Developing a public transport network can also help to<br />
develop a city in a planned way and restore alreadydeveloped<br />
areas.<br />
For example, by establishing combined transport and<br />
land use plans, decision-makers can give incentives to<br />
private developers to concentrate their activities along<br />
public transport corridors. Consequently, those<br />
developments (residential or commercial) will later<br />
benefit good access to the city, making them particularly<br />
attractive.<br />
Plans of Kunming show the concept of further expansion of the city<br />
around the future public transport network<br />
A high quality public transport system<br />
adds value to land and real estate
Improving quality of life through a better use<br />
of urban space<br />
or, only 1 bus.<br />
75 people are<br />
carried either by<br />
60 cars<br />
To accommodate all the travel demand by cars would<br />
require very extensive road capacity. Alternatively, public<br />
transport makes better use of urban space because it has<br />
better capacity. Indeed, during one hour period, 2000<br />
people can cross a 3-5m wide space by cars, 9000 by<br />
regular buses and more than 22000 with high-capacity<br />
public transport (Bus Rapid Transit, Light Rail or subway).<br />
The space saved can then be used for other purposes:<br />
• Green spaces<br />
• Open spaces<br />
• Pedestrian areas<br />
• Recreation areas<br />
• Commercial and shopping areas<br />
Cities should not be designed for cars,<br />
but for their inhabitants<br />
Solution 11<br />
25
26<br />
Three pillars of a sustainable mobility<br />
BALANCED TRAFFIC SYSTEM<br />
LAND-USE PLANNING<br />
RESTRICTION OF<br />
PRIVATE CAR USE<br />
PROMOTION OF PUBLIC<br />
TRANSPORT AND<br />
SUSTAINABLE MODES<br />
Only a combination of solutions is successful
Reforming transport institutions and<br />
empowering local authorities<br />
The Gauteng Province is the economic engine of South<br />
Africa and Southern Africa. It includes 3 metropolitan<br />
municipalities<br />
• City of Johannesburg Metropolitan Municipality<br />
• Ekurhuleni Metropolitan Municipality<br />
• City of Tshwane Metropolitan Municipality (previously<br />
Pretoria).<br />
Johannesburg<br />
Tshwame<br />
Ekurhuleni<br />
A number of other cities in Africa have also taken the initiative to reform<br />
their institutions. In 1997, Dakar created its local authority CETUD, followed<br />
by Abidjan in 2000 with AGETU and more recently Lagos in 2002 with LAPTA.<br />
It also includes three districts municipalites.<br />
The Gauteng TCC (Transport Co-ordination Committee)<br />
was created in 1996 in view of the fact that the Gauteng<br />
Province is largely urban and operates as a functional<br />
transport area and because of the large percentage of<br />
transport movements across the boundaries of the<br />
municipalities.<br />
The TCC co-ordinates transport policy between the 3<br />
metropolitan municipalities, the three district<br />
municipalities, the province, the local rail operators and<br />
the national railways government agency.<br />
Nevertheless, all three metropolitan municipalities are<br />
advanced in the investigation to establish Transport<br />
Authorities.This will enable many functions to be devolved<br />
to the municipalities, and will ensure that the previous<br />
fragmented approach to the planning, management<br />
and control of public transport can be eliminated.<br />
Municipalities are now, for the first time, preparing<br />
integrated transport plans which include public transport<br />
as well as transport infrastructure. The planned taxi<br />
recapitalisation process, which is aimed at replacing the<br />
16-seater vehicles with 18 and 35-seaters, will have a<br />
major impact on the public transport system. Gauteng<br />
is also advanced with the implementation of a Rapid<br />
Rail transport system to link all three metropolitan<br />
municipalities.<br />
Urban transport policy is more efficient when it<br />
takes local and regional perspectives into account<br />
<strong>Good</strong> practice 1<br />
27
<strong>Good</strong> practice 2<br />
28<br />
Restoring a quality of life in the city<br />
Recently, city officials from Bogotá, Colombia have invested<br />
in urban renewal with a strong focus on quality of life.Facing<br />
a degradation in the life of its citizens, the city developed a<br />
program around transport and the urban fabric:<br />
• Transmilenio, a bus-based high capacity transit system<br />
with 31 km of exclusive bus lane and three lines, carries<br />
700 000 passengers per day, with 42 000 per hour in<br />
peak times<br />
• Limiting car access during peak-hours,the citizens voted<br />
to make the entire urban area car-free, except for taxis,<br />
during the morning and evening peak hours from 2015<br />
• Bicycle paths (200 km programmed to link the entire<br />
city) and sidewalks connect the city’s activity centres<br />
to promote non-motorized modes<br />
• Green spaces and public spaces to revitalise urban<br />
land use.<br />
After the implementation of Transmilenio<br />
Phase 1 in 2000<br />
32% reduction in travel time for users<br />
75% reduction in injuries,<br />
92% reduction in fatalities<br />
43% reduction in SO2<br />
12% reduction in Particulate Matters PM-10 Transmilenio, Bogotá<br />
Public transport is one of many elements<br />
to restore quality of life in our cities
Integrating transport and land-use planning<br />
Curitiba, Brazil Curitiba Growth<br />
In 1943, the Agache plan, the first plan establishing<br />
Curitiba's transport priorities, suggested to accommodate<br />
the future explosion of the automobile market by<br />
creating arterial highways. In 1965, the Plano Diretor de<br />
Curitiba (Master plan) was created to tackle traffic<br />
problems. However, it adopted a completely different<br />
solution: building the city around the transport network<br />
through the strict control of urban development along<br />
designated corridors. The city would grow linearly, not as<br />
the common radial model. The aims of the plan were<br />
clear:<br />
• Control urban growth<br />
• Integrate urban functions<br />
• Give full priority to public transport<br />
• Limit traffic and pollution.<br />
Nowadays, Curitiba enjoys one of the most efficient busbased<br />
public transport networks in the world.<br />
Land-use and transport integrated policies not only<br />
allow for a coherent city development, but also help<br />
to sustain a good ridership level for public transport<br />
<strong>Good</strong> practice 3<br />
29
<strong>Good</strong> practice 4<br />
30<br />
Introducing emission standards to curb<br />
air pollution<br />
In New Delhi, surveys have established that the incidence<br />
of respiratory diseases due to air pollution is 12 times the<br />
national rate. Whilst the Indian GDP has increased by<br />
150% in the last 20 years, pollution from automobiles has<br />
increased 8 fold.<br />
In response, the government passed a law in 1998 to curb<br />
urban pollution. It requires public transport and private<br />
modes to shift to cleaner technologies and to limit<br />
emission sources such as motorbikes and taxis.<br />
Supreme Court<br />
Directives<br />
(06/1998)<br />
All pre-1990 taxis and<br />
autorickshaws (including<br />
those owned by individuals)<br />
must be replaced with new<br />
vehicles running on clean<br />
fuels by March 31, 2000.<br />
Local governments must<br />
provide financial incentives<br />
to replace all post-1990 autos<br />
and taxis with new vehicles<br />
that operate on clean fuels<br />
by March 31, 2001.<br />
All public sector buses older<br />
than 8 years must be<br />
scrapped by April 1, 2000<br />
unless they operate on CNG<br />
or other clean fuels. The<br />
entire city bus fleet (public<br />
and private) must be steadily<br />
converted to CNG.<br />
Status of<br />
Implementation<br />
(02/2001)<br />
Air pollution can be drastically reduced<br />
by regulating vehicle fleets<br />
All pre-1990 taxis and<br />
autorickshaws were<br />
successfully removed<br />
from the road by the<br />
deadline.<br />
Substantial financial<br />
incentives are being<br />
offered for new<br />
vehicles operating on<br />
clean fuels.<br />
About 137 CNG buses<br />
are in operation (all<br />
publicly operated)<br />
and 1,200 are on<br />
order. Thirteen diesel<br />
buses have been<br />
retrofitted with CNG.
Relieving congestion through high-capacity<br />
services<br />
Shanghai, China<br />
In Shanghai, congestion is a major problem due to the<br />
large number of bicycles and pedestrians mixed with<br />
cars, buses and highly polluting motorised two-wheelers,<br />
all fighting for the same road space.<br />
The growth in population and motorization could not be<br />
accommodated only by expanding the road network,<br />
thus local officials concerned about building an<br />
international city, decided upon large investments in<br />
public transport.<br />
Public transport trips average 10.5 million trips daily with<br />
over 7 million being made by bus.With the ambitious goal<br />
of keeping the time needed to cross the city to an<br />
average of 60 minutes, developing rail has been a priority<br />
as it is the most economic way to move large quantities<br />
of people. 65km of metro line already averages a million<br />
passengers a day and an extra 200km of rail will be<br />
completed by 2005, linking areas of the city in a ‘hub and<br />
spoke’ (Cross and Ring) network.<br />
A bus-based or rail-based public transport network<br />
can rapidly move a large number of people<br />
<strong>Good</strong> practice 5<br />
31
<strong>Good</strong> practice 6<br />
32<br />
Raising awareness and helping communities<br />
using public transport facilities<br />
The Commuter AIDS Information Project is a two year<br />
activity developed by the HIV/AIDS and STD Directorate<br />
of the Department of Health, running from October 2001<br />
to September 2003. The project targets the commuter<br />
population by providing basic HIV/AIDS information,<br />
referral information, condoms and leaflets via kiosks<br />
located at 20 urban commuter sites countrywide,<br />
reaching some 3.5 million commuters. The kiosks are<br />
situated prominently at each site and are regularly used<br />
for consumer product promotion. Two trained NAPWA<br />
(National Association of People Living with HIV/AIDS)<br />
members are located at each kiosk and offer individual<br />
discussions, referrals and also disseminate condoms and<br />
support materials. The project is promoted by utilising<br />
exterior taxi signage, kiosk signage and advertising inserts<br />
on Star Music. The Star Music concept involves the free<br />
distribution of popular local and international music<br />
interspersed with short commercials to taxi drivers on a<br />
bimonthly basis.<br />
Commuter AIDS Information Project, South Africa<br />
Public transport is a useful contributor to<br />
the well-being of a community in many ways
Providing training and creating local<br />
knowledge<br />
Institut des Métiers de la Ville, Hanoi<br />
In the context of creating a pilot tramway line on the East-<br />
West corridor of Hanoi for 2005, a co-operation framework<br />
was established between the Popular Committee of<br />
Hanoi and the Ile-de-France region. The “Institut des<br />
Métiers de la Ville” (Institute of City Skills or IMV) was<br />
created to support the city of Hanoi in terms of planning<br />
and urban management with three specific goals:<br />
• Implement “Training – Action” sessions for municipal<br />
managers working on urban issues<br />
• Bring a supporting role to the Vietnamese authorities<br />
and transfer knowledge with respect to urban issues<br />
• Develop a resource centre in French and Vietnamese<br />
for Vietnamese managers.<br />
Since September 2002, the IMV is hosting a 1 million euro<br />
project to improve public transport in Hanoi with 3 pilot<br />
bus lines for a 2-year period.<br />
Already, 220 managers have been trained within the IMV<br />
in the fields of transport, planning, public infrastructure<br />
and urban development.<br />
Training public transport professionals and<br />
developing urban management knowledge are<br />
crucial to the establishment of coherent local policies<br />
<strong>Good</strong> practice 7<br />
33
<strong>Good</strong> practice 8<br />
34<br />
Giving public transport priority<br />
Kunming, capital of Yunnan province in south-western<br />
China, has a population of 1.3 million. The city initially<br />
planned its development through the promotion of cars<br />
instead of pedestrians and bicycles. In 1993, the<br />
negative consequences of this policy (congestion,<br />
pollution and chaotic traffic) pushed the city to consider<br />
public transport.<br />
A master plan was delivered in 1996 with the support of<br />
its sister city of Zurich. In 1997, in order to rapidly obtain a<br />
good public transport system, the municipality planned a<br />
Bus Rapid Transit network that would incrementally be<br />
transformed into a modern tramway network. Several<br />
successful pilot projects have already helped to<br />
convince decision-makers.<br />
Since April 1999 (4 months after the beginning of<br />
construction), Kunming enjoys exclusive right-of-way for<br />
its buses. The city is now planning new services, including<br />
a regional network and the implementation of a<br />
modern LRT.<br />
A congestion free<br />
bus network<br />
Kunming, China<br />
Improving bus and light rail with dedicated lanes<br />
is cost-effective and produces rapid benefits
Adapting public transport to the customers’<br />
needs<br />
Abidjan, Ivory Coast<br />
The new waterborne service takes 8 minutes to reach<br />
Cocody from Yopougon, compared to 55 minutes for the<br />
bus service; a result of more than 45 minutes of travel time<br />
saved by users.<br />
SOTRA, the public transport operator in Abidjan (Cote<br />
d’Ivoire) has around 1.000.000 passengers a day by bus<br />
and 20.000 by boat. SOTRA aimed to further exploit the<br />
waterborne transport, since most parts of the city have a<br />
direct access to the lagoon.<br />
Since it was not possible to get affordable boats, SOTRA<br />
started it own a shipbuilding yard. 4 new small ports are<br />
planned in addition to a tram, a light rail and a suburban<br />
train.<br />
Yopougon<br />
Adjame<br />
Treichville<br />
• Bus<br />
• Boat<br />
Cocody<br />
Innovative services help public transport<br />
to better answer its customers’ needs<br />
<strong>Good</strong> practice 9<br />
35
<strong>Good</strong> practice 10<br />
36<br />
Giving simple and useful travel information<br />
to customers<br />
Without high investments in travel information, the city of<br />
Yogjakarta (Indonesia) succeeded to provide an easy-touse<br />
and understandable public transport service based<br />
on high-frequency services. The public transport network<br />
in Yogjakarta (Indonesia) was simplified covering 10 radial<br />
and 2 orbital lines, making it possible to provide highfrequency<br />
transport services. Every bus is equipped with<br />
several panels (sometimes just cardboard) indicating the<br />
line number from 1 to 12 and, on the front of the vehicle,<br />
a wooden board indicated the major stops on that line.<br />
Thanks to this information system (and within budget<br />
restrictions), the local operator KOPATA managed to offer<br />
a very simple public transport network making it possible<br />
for travellers to orient themselves with ease.<br />
Yogjakarta, Indonesia<br />
<strong>Good</strong> passenger information is a deciding factor<br />
in the competitiveness of public transport
Easing access to public transport with<br />
information technology<br />
Amman, Jordan<br />
The Automated Fare collection system was launched in<br />
2001 in Amman (Jordan) using contactless smart cards. It<br />
offers a lot of advantages for bus riders and the company.<br />
It reduces long queues at bus stops and eliminates the<br />
need to search for change. It also makes the customers’<br />
commute more convenient and efficient. The advantage<br />
for the company was the elimination of the fraud factor,<br />
coin-counting and sorting which consumed much time.<br />
Smart cards can be recharged in many locations (e.g.<br />
bus terminals or big supermarkets). Riders simply wave<br />
their cards in a front of a reader to board the bus, without<br />
inserting it into a slot or the need of removing it from a<br />
person’s wallet.<br />
This advanced system also provides transport indicators<br />
such as numbers of passengers during the day or during<br />
the peak hours.<br />
New electronic ticketing makes journeys easier<br />
for public transport users<br />
<strong>Good</strong> practice 11<br />
37
<strong>Good</strong> practice 12<br />
38<br />
Focusing on the customers through a quality<br />
commitment<br />
In September 2001, the Tunisian Ministry of Transport<br />
launched a pilot project bringing together the three<br />
operators of Tunis around the theme of Quality. The<br />
project consisted of developing and implementing a<br />
quality action plan aimed at strengthening capacity to<br />
improve satisfaction among public transport users, this by<br />
bringing together the experiences of public passenger<br />
transport professionals involved in different areas of<br />
service provision (operations, marketing, studies, quality).<br />
The quality action plan was based on the guiding<br />
principles of openness, commitment and innovation<br />
between the three operators.<br />
The action plan was divided into four focus areas:<br />
• Customer complaints and suggestions<br />
• Common indicators (extended with specific indicators<br />
for each of the three companies)<br />
• Customer satisfaction<br />
• Key satisfaction indicators.<br />
The quality action plan achieved a better collaboration<br />
within the three companies operating in Tunis in terms of<br />
information management and also a better knowledge<br />
of their customers’ needs. Customers were also given the<br />
opportunity to express their needs.<br />
Tunis, Tunisia<br />
Public Transport is a service and must be<br />
customer-based
Bringing public transport closer to<br />
the customer<br />
Saõ Paulo, Brazil<br />
The Companhia do Metropolitano de São Paulo – Metrô,<br />
with a subway network of four lines (totalling 58.6 km and<br />
52 stations), developed a strategy of marketing focused<br />
on the customer.<br />
In order to get closer to the users, Metrô communicates<br />
through various media: call centre, suggestion boxes in<br />
stations, user phones in the principal stations and the<br />
Internet. In addition, a yearly user opinion poll referring to<br />
the service evaluation and a biannual socio-economic<br />
assessment are both being carried out.<br />
Users also receive permanent information on public utility<br />
campaigns that are advertised in association with other<br />
institutions, such as vaccination and blood donation<br />
campaigns, and cultural events.<br />
An important activity within the stations is the artistic and<br />
cultural agenda, as well as the significant works of art<br />
installed there. Currently, this collection consists of<br />
approximately 100 works of the most expressive<br />
contemporary Brazilian artists. Metrô also promotes<br />
several cultural activities, such as exhibitions, musical and<br />
theatre presentations.<br />
As a result, Metrô has become a symbol of the city of São<br />
Paulo, a point of pride for the population.<br />
Including added-value services and culture into<br />
public transport systems improves its image<br />
<strong>Good</strong> practice 13<br />
39
References<br />
<strong>Problems</strong><br />
40<br />
P 1 Graph: UN Population Division<br />
P 2 Rio Picture: Jingli Wang;<br />
Cairo Picture: Bernhard Stump<br />
P 3 Picture: <strong>UITP</strong><br />
P 4 Graph: <strong>UITP</strong>/ISTP Millennium Cities Database;<br />
Table: Urban Transport Environment and Equity, Eduardo A. Vasconcellos<br />
P 5 Graph: <strong>UITP</strong>/ISTP Millennium Cities Database<br />
P 6 Text: World Health Organisation<br />
Table: Point des normes d’émission, Niveau de surveillance de la qualité de l’air et études<br />
d’impact sur la santé humaine au Bénin, Pr Fayomi<br />
P 7 Table: Pew Center on Global Climate Change<br />
Graph: <strong>UITP</strong>/ISTP Millennium Cities Database<br />
P 8 World Resource Institute, http://www.wri.org/wri/<br />
P 9 Table: Transportation in Developing Countries: Greenhouse Gas Scenarios for Delhi, India, Pew<br />
Center on Global Climate Change<br />
Graph: U.S. Department Of Energy, Energy Information Administration, 2000<br />
P 10 Graph: UN Environment Program, GEO Data Portal<br />
P 11 Brasilia Picture: Mona Weck<br />
The Vicious Circle of Urban Transport Degradation: Pulichino M. and Vasconcellos E.A.
S 2 Curitiba Picture: Prefeitura de Curitiba<br />
Table: Urban Transport Environment and Equity, Eduardo A. Vasconcellos<br />
S 4 Text: <strong>UITP</strong> Focus Paper: The financing of public transport operations<br />
S 5 Table: London Transport Buses, Mobility 2001, p 1-11<br />
Box: Transport, Environment and Equity, Eduardo A. Vasconcellos<br />
S 6 Picture: Institute for Transportation and Development Policy<br />
S 7 Bogota Pictures: Institute for Transportation and Development Policy<br />
S 8 Graph: <strong>UITP</strong>/ISTP Millennium Cities Database<br />
Table: Energy Conservation and Emission Reduction Strategies, TDM Encyclopedia,<br />
www.vtpi.org/tdm/tdm59.htm<br />
S 10 Picture and Text: Public Transport International 05/2000<br />
Sustainable <strong>Solutions</strong>: Ralph Hall, Introducing the Concept of Sustainable Transport to the U.S. DOT through<br />
the Reauthorization of TEA-21<br />
<strong>Solutions</strong><br />
References<br />
41
References<br />
42<br />
<strong>Good</strong> <strong>Practices</strong><br />
GP 1 Picture and Map: Gauteng TCC<br />
GP 2 Picture: Transmilenio S.A.<br />
Box: DAMA, Air Quality Monitoring in Public Transport International 05/2003<br />
GP 3 Picture: Instituto de Pesquisa e Planejamento Urbano de Curitiba C<br />
GP 4 Text: The Energy and Resource Institute TERI<br />
Table: Transportation in Developing Countries: Greenhouse Gas Scenarios for Delhi, India,<br />
Pew Center on Global Climate Change<br />
GP 5 Picture: <strong>UITP</strong><br />
Text: Metropolitan Railways Conference, Shanghai 2002<br />
GP 6 Picture and text: Centre for AIDS Development, Research and Evaluation (CADRE)<br />
GP 7 Picture and text: Institut des Métiers de la Ville<br />
GP 8 Picture: <strong>UITP</strong><br />
GP 9 Picture: Société des Transports Abidjanais<br />
GP 10 Picture: <strong>UITP</strong><br />
GP 11 Picture and text: Asia Transport Co. Ltd<br />
GP 12 Picture: <strong>UITP</strong><br />
GP 13 Text: Metropolitan Railways Conference, Shanghai 2002<br />
Picture: <strong>UITP</strong>
Presentation of <strong>UITP</strong><br />
<strong>UITP</strong> is the world-wide association of urban and regional passenger transport operators, authorities and suppliers.With over<br />
2000 members from nearly 80 countries, <strong>UITP</strong> promotes a better understanding of public transport and acts as the<br />
international NETWORK for all transport professionals.<br />
It is a point of REFERENCE for the industry and studies all aspects of mobility to encourage the development of more<br />
efficient and attractive collective passenger transport, and informs its members of best practices world-wide. It provides<br />
research and analysis on all aspects of urban and regional passenger transport including infrastructure, rolling stock,<br />
organisation and management.<br />
<strong>UITP</strong> acts as an international FORUM for the transport sector to exchange knowledge and experience to further the<br />
position of public transport and maintains close contact between the industry, operators and authorities.<br />
It promotes public transport through close contact with decision-makers and the media to develop a favourable climate<br />
of opinion and acts as an ADVOCATE for public transport. It represents the interests of its members through its dealings with<br />
international organisations such as the European Institutions, the UN, the OECD and the World Bank as well as giving its<br />
members opportunities to network with other national and international transport associations.<br />
<strong>UITP</strong>’s Mission Statement<br />
<strong>UITP</strong>, the International Association of Public Transport is the:<br />
World-wide NETWORK<br />
of public transport<br />
professionals<br />
Point of REFERENCE<br />
for the industry<br />
International FORUM<br />
for transport policy<br />
ADVOCATE of public<br />
transport<br />
43
Contact<br />
44<br />
To Contact Us<br />
<strong>UITP</strong><br />
Rue Sainte Marie, 6<br />
B-1080 Brussels<br />
Belgium<br />
Tel: (32) 2 673 61 00<br />
Fax: (32) 2 660 10 72<br />
Web: www.uitp.com<br />
<strong>UITP</strong> African Division<br />
African Association for Public Transport UATP,<br />
18 BP 1910 Abidjan 18<br />
Côte d’Ivoire<br />
Tel: (225) 21 75 71 09<br />
Fax: (225) 21 25 97 21<br />
Email: uatp@uitp.com<br />
www.uitp.com/uatp
<strong>UITP</strong> Latin American Division<br />
Alameda Santos, 1000 - 7o Andar<br />
São Paulo - SP, 01418-100 - BRAZIL<br />
Tel. : +55 (11) 3283 2299<br />
Fax : +55 (11) 3253 8095<br />
Email: latinamerica@uitp.com<br />
<strong>UITP</strong> Asia-Pacific Division<br />
c/o MTR Corporation Ltd.<br />
MTR Tower, Telford Plaza<br />
Kowloon Bay<br />
Hong Kong<br />
Tel: (852) 2993 8721<br />
Fax: (852) 2993 7722<br />
E-mail: sandy@uitp.com<br />
This brochure has been prepared and edited by Michael Pulichino and Petra Mollet, at <strong>UITP</strong>’s General Secretariat.<br />
Special thanks should be given to Eduardo A. Vasconcellos and Yves Amsler for their contributions.<br />
December 2003
Union Internationale des Transports Publics<br />
International Association of Public Transport<br />
Internationaler Verband für öffentliches Verkehrswesen<br />
Unión Internacional de Transporte Público<br />
rue Sainte Marie 6 • B-1080 Brussels<br />
Tel: +32 2 673 61 00 • Fax: +32 2 660 10 72<br />
E-mail: administration@uitp.com •<br />
communication@uitp.com • events@uitp.com<br />
• library@uitp.com • studies@uitp.com<br />
Web: http://www.uitp.com<br />
Dépôt légal: D/2003/0105/26