Tracking Ocean Wanders (PDF, 5 MB) - BirdLife International
Tracking Ocean Wanders (PDF, 5 MB) - BirdLife International
Tracking Ocean Wanders (PDF, 5 MB) - BirdLife International

Create successful ePaper yourself
Turn your PDF publications into a flip-book with our unique Google optimized e-Paper software.
8<br />
<strong>Tracking</strong> ocean wanderers: the global distribution of albatrosses and petrels – Methods<br />
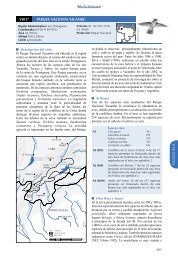
Figure 2.8. Utilisation distributions (UDs) and range for breeding Buller’s Albatrosses from Snares Islands. Each map was produced from the<br />
PTT tracks of four individuals selected at random from the complete dataset.<br />
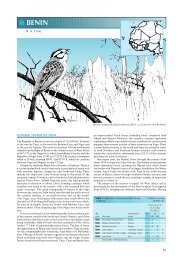
Figure 2.9. Utilisation distributions (UDs) and range for breeding Buller’s Albatrosses from Snares Islands. Each map was produced from the<br />
PTT tracks of 12 individuals selected at random from the complete dataset.<br />
The area of the 50% UD requires fewer tracks to reach a<br />
stable maximum value, which is encouraging for the<br />
purpose of identifying marine Important Bird Areas as<br />
these will be located in areas of high-intensity use. However<br />
care is needed as the locations of these hotspots are not<br />
necessarily the same for each random sample: in Figure 2.8<br />
four samples of the Buller’s dataset are shown, using four<br />
tracks drawn at random from the complete dataset. Even<br />
though the total area of the 50% UD is similar to that of<br />
the complete dataset, different regions are highlighted and<br />
some apparent hotspots are missed completely. At sample<br />
sizes this small, the foraging behaviour of a single<br />
individual on a single trip can produce hotspots in regions<br />
not frequented by any other individuals in the dataset. If<br />
the random sample is increased to 12 the influence of a<br />
single individual is reduced and hotspots are found in<br />
similar areas to the complete dataset (Figure 2.9), although<br />
some are still missed. The possibility of missing hotspots<br />
should be borne in mind when interpreting maps<br />
irrespective of the sample size.<br />
Frances Taylor, Aleks Terauds and David Nicholls