Tracking Ocean Wanders (PDF, 5 MB) - BirdLife International
Tracking Ocean Wanders (PDF, 5 MB) - BirdLife International
Tracking Ocean Wanders (PDF, 5 MB) - BirdLife International

You also want an ePaper? Increase the reach of your titles
YUMPU automatically turns print PDFs into web optimized ePapers that Google loves.
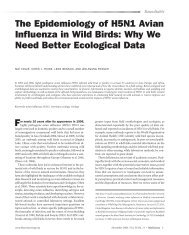
<strong>Tracking</strong> ocean wanderers: the global distribution of albatrosses and petrels<br />
ANNEX 3 ALBATROSS TRACKING AND UTILISATION DISTRIBUTIONS FROM KERNELS<br />
Introduction<br />
The exploration of kernelling Royal Albatross data arose<br />
because there were strong differences on methods of analysis<br />
and the presentation of the results of satellite tracking. The<br />
Workshop faces similar challenges. Our satellite telemetry<br />
methodology differed between the various individuals<br />
within the single species. The differences were intentional at<br />
the time, but it requires careful analysis if we are to achieve<br />
valid comparisons and summaries. These complications are<br />
directly relevant to procedures combining datasets.<br />
Definitions<br />
The kernel is the shape placed over each observation. The<br />
process of summing the kernels creates a measure of<br />
abundance, either as a density, or the probability of<br />
occurrence across the range.<br />
Utilisation distribution is the grid or contour map of the<br />
occurrence.<br />
Home range is the area used by an animal in its normal<br />
daily activities. Home range for an albatross that has<br />
migrated to the other side of the world is arguably a<br />
contradiction, so we used range.<br />
Methods<br />
The homogenous data set is of a single northern royal<br />
albatross (abandoned breeding, migrated via the Pacific<br />
<strong>Ocean</strong> to the Patagonian Shelf; bird was present from<br />
March to 30 June, totalling 558 selected Argos locations;<br />
transmission regime: on-period 25 hours, off-period 23<br />
hours, i.e. exactly two days. The kernels, utilisations<br />
distributions and maps were prepared in Animal<br />
Movements Extension 2.0 in ESRI ArcView 3.2.).<br />
Results<br />
Smoothing produces different forms of the Utilisation<br />
Distributions. The user must decide the form depending on<br />
their hypothesis. There is no single choice, and no one other<br />
than the user can decide. Different kinds of subsets of the<br />
data do affect the range and Utilisation Distributions. These<br />
differences may be deeply hidden in the data. We tested the<br />
sample size and its effects on the area of the range. Small<br />
samples underestimated the range, but indicated a measure<br />
of by how much the range might be underestimated. It<br />
cannot of course show the places where an underestimate<br />
might be occurring.<br />
Subsets<br />
With subsets, such as day versus night, or, night, dawn, day,<br />
dusk, accuracy of locations and speed, the area of the<br />
ranges was close to the range area expected for the sample<br />
size. However for transmission regime, or, for seasonal time<br />
periods of the time spent on the Patagonian Shelf namely,<br />
early, middle and late, the range areas emphatically did not<br />
match the range for the complete data set.<br />
Conclusions<br />
Choosing the smoothing is subjective. The activity at hot<br />
spots is speculative. Concentrations may only in a limited<br />
sense indicate risk. Combining results and comparing maps<br />
from different datasets, other than at the most superficial<br />
levels, needs care but the exploration described here<br />
provides methods to ensure valid use.<br />
David Nicholls, Christopher Robertson<br />
and Beat Naef-Daenzer<br />
79