University of Pardubice Jan Perner Transport Faculty Transport and ...
University of Pardubice Jan Perner Transport Faculty Transport and ...
University of Pardubice Jan Perner Transport Faculty Transport and ...
Create successful ePaper yourself
Turn your PDF publications into a flip-book with our unique Google optimized e-Paper software.
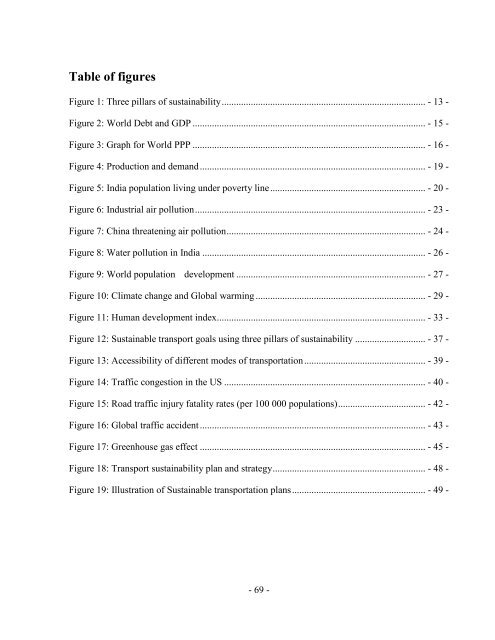
Table <strong>of</strong> figures<br />
Figure 1: Three pillars <strong>of</strong> sustainability .................................................................................... - 13 -<br />
Figure 2: World Debt <strong>and</strong> GDP ................................................................................................ - 15 -<br />
Figure 3: Graph for World PPP ................................................................................................ - 16 -<br />
Figure 4: Production <strong>and</strong> dem<strong>and</strong> ............................................................................................. - 19 -<br />
Figure 5: India population living under poverty line ................................................................ - 20 -<br />
Figure 6: Industrial air pollution ............................................................................................... - 23 -<br />
Figure 7: China threatening air pollution .................................................................................. - 24 -<br />
Figure 8: Water pollution in India ............................................................................................ - 26 -<br />
Figure 9: World population development .............................................................................. - 27 -<br />
Figure 10: Climate change <strong>and</strong> Global warming ...................................................................... - 29 -<br />
Figure 11: Human development index ...................................................................................... - 33 -<br />
Figure 12: Sustainable transport goals using three pillars <strong>of</strong> sustainability ............................. - 37 -<br />
Figure 13: Accessibility <strong>of</strong> different modes <strong>of</strong> transportation .................................................. - 39 -<br />
Figure 14: Traffic congestion in the US ................................................................................... - 40 -<br />
Figure 15: Road traffic injury fatality rates (per 100 000 populations) .................................... - 42 -<br />
Figure 16: Global traffic accident ............................................................................................. - 43 -<br />
Figure 17: Greenhouse gas effect ............................................................................................. - 45 -<br />
Figure 18: <strong>Transport</strong> sustainability plan <strong>and</strong> strategy ............................................................... - 48 -<br />
Figure 19: Illustration <strong>of</strong> Sustainable transportation plans ....................................................... - 49 -<br />
- 69 -


