- Page 1 and 2:
Measure for Measure How Well Do We
- Page 3 and 4:
[ Disclaimer] Publications Director
- Page 6 and 7:
Table of Contents Acknowledgements
- Page 8 and 9:
Introduction François Bourguignon,
- Page 10 and 11:
The 2010 UNDP report on human devel
- Page 12:
1. Measuring Development: Different
- Page 15 and 16:
More data, better data and a broade
- Page 17 and 18:
•The PPPs are currently revised o
- Page 19 and 20:
1.1. More data, better data: benefi
- Page 21 and 22:
Organization undertakes the World P
- Page 23 and 24:
able through the DHS system, as wel
- Page 25 and 26:
1.2. The 2005 revision of the ICP a
- Page 27 and 28:
international dollars. The line is
- Page 29 and 30:
only thing that changes the counts
- Page 31 and 32:
Table Countries 1 15 reference coun
- Page 33 and 34:
y India and China, where about half
- Page 35 and 36:
This is because the PWT uses a Gear
- Page 37 and 38:
price level is the ratio of the pur
- Page 39 and 40:
meeting the demands of disease and
- Page 41 and 42:
In contrast to the calorie decline,
- Page 43 and 44:
1.3.4. Asking about not having mone
- Page 45 and 46:
Table 3 All countries Estimated num
- Page 47 and 48:
1.4. From many to one: single index
- Page 49 and 50:
expectancy and per capita income
- Page 51 and 52:
DEATON, A. (2008), “Income, healt
- Page 53 and 54:
STEVENSON, B. and J. WOLFERS (2008)
- Page 56 and 57:
2. Multidimensional Poverty and its
- Page 58 and 59:
dimensional Poverty Index. While th
- Page 60 and 61:
erty in most countries, but is sign
- Page 62 and 63: The first methodology in Figure 7 e
- Page 64 and 65: more completely their characteristi
- Page 66 and 67: 2.1.3. Unfolding M0 A relevant feat
- Page 68 and 69: 2.2. One particular application of
- Page 70 and 71: Whenever the poverty cutoff k requi
- Page 72 and 73: deprivation in child mortality and
- Page 74 and 75: 2.3. Research questions and debates
- Page 76 and 77: Table Identification Method Union a
- Page 78 and 79: There are three kinds of combinatio
- Page 80 and 81: from different data sources; data f
- Page 82 and 83: Because of its construction, analys
- Page 84 and 85: 2.4. Concluding remarks This paper
- Page 86 and 87: ATKINSON, A.B. and F. BOURGUIGNON (
- Page 88 and 89: ERIKSON, R. (1993), "Descriptions o
- Page 90 and 91: RAWLS, J. (1971), A theory of justi
- Page 92 and 93: Comment: Multidimensional Poverty a
- Page 94 and 95: Data Already existing surveys provi
- Page 96: Taking a longer historical view und
- Page 100 and 101: 3. Will GDP Growth Increase Subject
- Page 102 and 103: political scientists. However, most
- Page 104 and 105: instruments/instrument.php for a su
- Page 106 and 107: • Life expectancy/income: “A pe
- Page 108 and 109: clude that: “Overall, the average
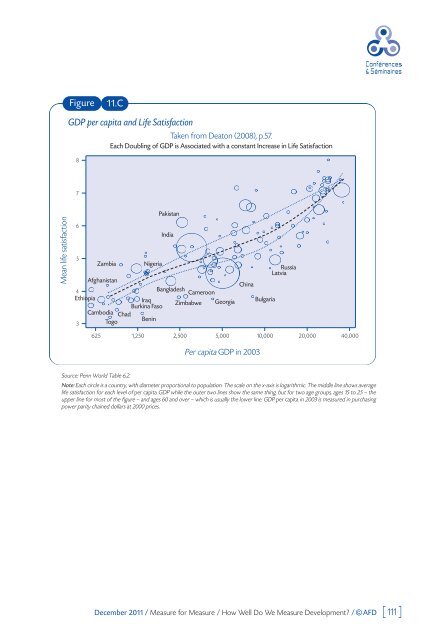
- Page 110 and 111: period. A similar graph appears in
- Page 114 and 115: Figure 12 GDP, and the average and
- Page 116 and 117: 3.1.2. The diminishing returns to i
- Page 118 and 119: 3.1.3. “Rather than diminishing m
- Page 120 and 121: 3.1.4. Is the time-series correlati
- Page 122 and 123: Figure The happiness trend in Mexic
- Page 124 and 125: A note on statistical power The dis
- Page 126 and 127: Satisfaction Figure 15.B. Happiness
- Page 128 and 129: Life Satisfaction Life Satisfaction
- Page 130 and 131: Life Satisfaction 7.62 7.3 7.08 6.8
- Page 132 and 133: insignificant in a well-being equat
- Page 134 and 135: p.21). Whether the co-movements bet
- Page 136 and 137: Mean happiness in survey (0-10 scal
- Page 138 and 139: One important note that can be made
- Page 140 and 141: well-being regressions in which bot
- Page 142 and 143: and relative to the income they ear
- Page 144 and 145: (2010), dummy variables for one’s
- Page 146 and 147: 3.3.2 Adaptation Adaptation and the
- Page 148 and 149: Knight and Gunatilaka (2009) is an
- Page 150 and 151: Life expectancy at birth Infant mor
- Page 152 and 153: Average number of children per woma
- Page 154 and 155: Infant mortality per 1 ,000 live bi
- Page 156 and 157: Trust 8 6 4 2 Evolution of trust We
- Page 158 and 159: gradient across countries, if incom
- Page 160 and 161: Table Last year Min. Max. Source Fi
- Page 162 and 163:
The income-happiness nexus: sources
- Page 164 and 165:
References AKAY, A. and P. MARTINSS
- Page 166 and 167:
COJOCARU, A. (2010), “On relative
- Page 168 and 169:
FREY, B.S. and A. STUTZER (2000),
- Page 170 and 171:
MCBRIDE, M. (2001), “Relative-inc
- Page 172 and 173:
Comment: Will GDP Growth Raise Well
- Page 174 and 175:
is relatively uncontroversial as an
- Page 176 and 177:
Again, perhaps one ought to advise
- Page 178:
4. “Sustainable Growth”: Do We
- Page 181 and 182:
ethical matter and needs to espouse
- Page 183 and 184:
Adjacently but independently of the
- Page 185 and 186:
4.1. National income and social wel
- Page 187 and 188:
In 1970, William Nordhaus and James
- Page 189 and 190:
4.2. The challenge of sustainabilit
- Page 191 and 192:
nerable to uncontrollable diverging
- Page 193 and 194:
The final goods and services genera
- Page 195 and 196:
Since the variation of total real n
- Page 197 and 198:
It is to be noted that the discount
- Page 199 and 200:
This difference is such that the di
- Page 201 and 202:
4.4. Sustainable growth: measuring
- Page 203 and 204:
Human capital is embodied in people
- Page 205 and 206:
Box 3 The notations have already be
- Page 207 and 208:
4.5. Sustainable growth: measuring
- Page 209 and 210:
the marginal utility of income and
- Page 211 and 212:
non-felling of trees. This non-use
- Page 213 and 214:
Box 4 Cost-benefit approach The fun
- Page 215 and 216:
With respect to the exogenous techn
- Page 217 and 218:
duced on the pollution permit marke
- Page 219 and 220:
paths. The social discount rate is
- Page 221 and 222:
should then be converted into econo
- Page 223 and 224:
References AGHION, P., D. HEMOUS an
- Page 225 and 226:
KRAVIS, I., A. HESTON and R. SUMMER
- Page 227 and 228:
Comment: “Sustainable Growth: Do
- Page 229 and 230:
sustainable policies. It seems very
- Page 231 and 232:
References SHALIZI, Z. and F. LECOC
- Page 234 and 235:
AFD Agence Française de Développe
- Page 236:
Authors’ Biographies
- Page 239 and 240:
een that of relative utility or com
- Page 241 and 242:
What is AFD ? Agence Française de