Paris School of Economics - L'Agence Française de Développement
Paris School of Economics - L'Agence Française de Développement
Paris School of Economics - L'Agence Française de Développement

You also want an ePaper? Increase the reach of your titles
YUMPU automatically turns print PDFs into web optimized ePapers that Google loves.
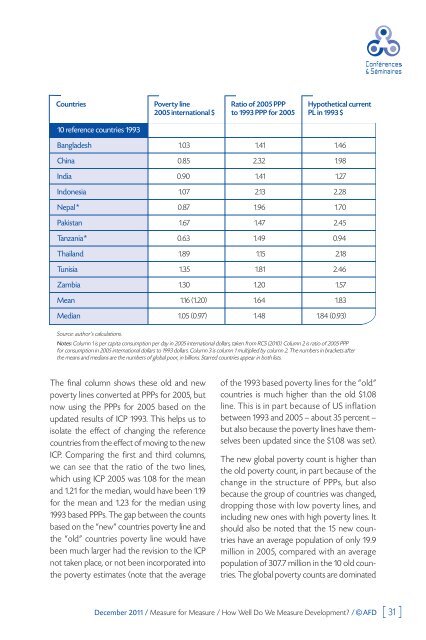
Countries<br />
10 reference countries 1993<br />
Bangla<strong>de</strong>sh 1.03 1.41 1.46<br />
China 0.85 2.32 1.98<br />
India 0.90 1.41 1.27<br />
Indonesia 1.07 2.13 2.28<br />
Nepal * 0.87 1.96 1.70<br />
Pakistan 1.67 1.47 2.45<br />
Tanzania* 0.63 1.49 0.94<br />
Thailand 1.89 1.15 2.18<br />
Tunisia 1.35 1.81 2.46<br />
Zambia 1.30 1.20 1.57<br />
Mean 1.16 (1.20) 1.64 1.83<br />
Median 1.05 (0.97) 1.48 1.84 (0.93)<br />
Source: author’s calculations.<br />
Poverty line<br />
2005 international $<br />
The final column shows these old and new<br />
poverty lines converted at PPPs for 2005, but<br />
now using the PPPs for 2005 based on the<br />
updated results <strong>of</strong> ICP 1993. This helps us to<br />
isolate the effect <strong>of</strong> changing the reference<br />
countries from the effect <strong>of</strong> moving to the new<br />
ICP. Comparing the first and third columns,<br />
we can see that the ratio <strong>of</strong> the two lines,<br />
which using ICP 2005 was 1.08 for the mean<br />
and 1.21 for the median, would have been 1.19<br />
for the mean and 1.23 for the median using<br />
1993 based PPPs. The gap between the counts<br />
based on the “new” countries poverty line and<br />
the “old” countries poverty line would have<br />
been much larger had the revision to the ICP<br />
not taken place, or not been incorporated into<br />
the poverty estimates (note that the average<br />
Ratio <strong>of</strong> 2005 PPP<br />
to 1993 PPP for 2005<br />
Hypothetical current<br />
PL in 1993 $<br />
Notes: Column 1 is per capita consumption per day in 2005 international dollars, taken from RCS (2010). Column 2 is ratio <strong>of</strong> 2005 PPP<br />
for consumption in 2005 international dollars to 1993 dollars. Column 3 is column 1 multiplied by column 2. The numbers in brackets after<br />
the means and medians are the numbers <strong>of</strong> global poor, in billions. Starred countries appear in both lists.<br />
<strong>of</strong> the 1993 based poverty lines for the “old”<br />
countries is much higher than the old $1.08<br />
line. This is in part because <strong>of</strong> US inflation<br />
between 1993 and 2005 — about 35 percent —<br />
but also because the poverty lines have themselves<br />
been updated since the $1.08 was set).<br />
The new global poverty count is higher than<br />
the old poverty count, in part because <strong>of</strong> the<br />
change in the structure <strong>of</strong> PPPs, but also<br />
because the group <strong>of</strong> countries was changed,<br />
dropping those with low poverty lines, and<br />
including new ones with high poverty lines. It<br />
should also be noted that the 15 new countries<br />
have an average population <strong>of</strong> only 19.9<br />
million in 2005, compared with an average<br />
population <strong>of</strong> 307.7 million in the 10 old countries.<br />
The global poverty counts are dominated<br />
December 2011 / Measure for Measure / How Well Do We Measure Development? / © AFD [ 31 ]