Chapter 1
Chapter 1
Chapter 1

Create successful ePaper yourself
Turn your PDF publications into a flip-book with our unique Google optimized e-Paper software.
(10 percent), and Malaysia (12 percent). When employment lic enterprises operating in competitive areas of the econof<br />
the PEs are included, Tunisia's share of public sector omy. Its immediate objectives were to remove the financial<br />
employees reaches about 35 percent of total employed wage and managerial burden of the loss-making companies and<br />
earners. These figures show why the size of the public sector to relinquish government from financing the investment<br />
plays an important role in wage and labor policies for the needs of the solvent but undercapitalized companies. The<br />
economy as a whole (see chapter 3, section on labor markets). government recognized that it could neither finance these<br />
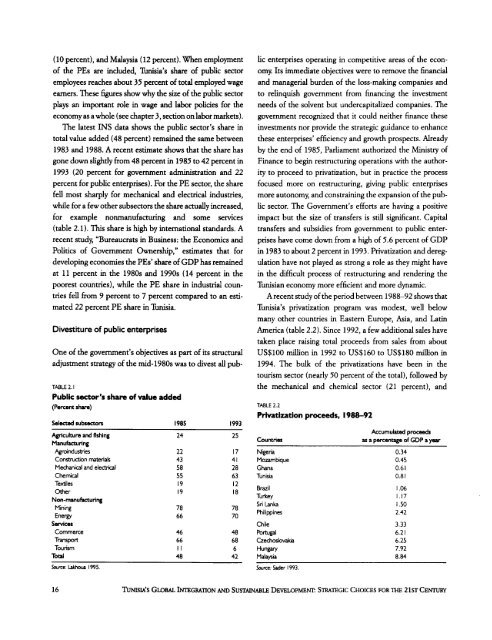
The latest INS data shows the public sector's share in investments nor provide the strategic guidance to enhance<br />
total value added (48 percent) remained the same between these enterprises' efficiency and growth prospects. Already<br />
1983 and 1988. A recent estimate shows that the share has by the end of 1985, Parliament authorized the Ministry of<br />
gone down slightly from 48 percent in 1985 to 42 percent in Finance to begin restructuring operations with the author-<br />
1993 (20 percent for government administration and 22 ity to proceed to privatization, but in practice the process<br />
percent for public enterprises). For the PE sector, the share focused more on restructuring, giving public enterprises<br />
fell most sharply for mechanical and electrical industries, more autonomy, and constraining the expansion of the pubwhile<br />
for a few other subsectors the share actually increased, lic sector. The Government's efforts are having a positive<br />
for example nonmanufacturing and some services impact but the size of transfers is still significant. Capital<br />
(table 2.1). This share is high by international standards. A transfers and subsidies from government to public enterrecent<br />
study, "Bureaucrats in Business: the Economics and prises have come down from a high of 5.6 percent of GDP<br />
Politics of Government Ownership," estimates that for in 1983 to about 2 percent in 1993. Privatization and deregdeveloping<br />
economies the PEs' share of GDP has remained ulation have not played as strong a role as they might have<br />
at 11 percent in the 1980s and 1990s (14 percent in the in the difficult process of restructuring and rendering the<br />
poorest countries), while the PE share in industrial coun- Tunisian economy more efficient and more dynamic.<br />
tries fell from 9 percent to 7 percent compared to an esti- A recent study of the period between 1988-92 shows that<br />
mated 22 percent PE share in Tunisia. Tunisia's privatization program was modest, well below<br />
many other countries in Eastern Europe, Asia, and Latin<br />
Divestiture of public enterprises America (table 2.2). Since 1992, a few additional sales have<br />
taken place raising total proceeds from sales from about<br />
One of the government's objectives as part of its structural US$100 million in 1992 to US$160 to US$180 million in<br />
adjustment strategy of the mid-1980s was to divest all pub- 1994. The bulk of the privatizations have been in the<br />
tourism sector (nearly 50 percent of the total), followed by<br />
TABLE2.1<br />
Public sctor's share of value added<br />
the mechanical and chemical sector (21 percent), and<br />
(Percent share) TABLE 2.2<br />
Selected subsectors 1985 1993<br />
Privatization proceeds, 1988-92<br />
Agriculture and flshing<br />
Manufacturing<br />
24 25<br />
Countries<br />
Accumulated proceeds<br />
as a percentage of GDP a year<br />
Agroindustries 22 17 Nigena 0.34<br />
Construction materials 43 41 Mozambique 0.45<br />
Mechanical and electrical 58 28 Ghana 0.61<br />
Chemical 55 63 Tunisia 0.81<br />
Textiles 19 12<br />
Other 19 18 Turaiey 1.06<br />
Non-manufacturing Trke 1.17<br />
Mining 78 78 Sri Lanks 2.50<br />
Energy 66 70 Philippines 2.42<br />
Services Chile 3.33<br />
Commerce 46 48 Portugal 6.21<br />
Transport 66 68 Czechoslovakia 6.25<br />
Tourism I1 6 Hungary 7.92<br />
Total 48 42 Malaysia 8.84<br />
Source: Lakhoua 1995. Source: Sader 1993.<br />
16 TUNISIA'S GLOBAL INTEGRATION AND SusTAiNABLE DEVELOPMENT STRATEGIC CHOICES FOR THE 21ST CENTURY