Maintworld 3/2018
Are You Overlooking a Significant Source of Savings? // Advantages of broadband ultrasonic analysis // Are you in the “circle of despair”? // Future of work
Are You Overlooking a Significant Source
of Savings? // Advantages of broadband ultrasonic analysis // Are you in the “circle of despair”? // Future of work

Create successful ePaper yourself
Turn your PDF publications into a flip-book with our unique Google optimized e-Paper software.
ReliABility<br />
Takt time target, through a cross-functional team we analyzed<br />
the specific manner of failure for each machine assembly associated<br />
with our “Bad Actor” systems. One outcome of the<br />
analysis was a set of common Failure Codes – a unique set of<br />
codes that can be used to evaluate the frequency of problems<br />
by asset class, failure class, or by specific causes – that were<br />
then implemented in Maximo to evaluate the effectiveness of<br />
engineered Equipment Maintenance Plans. A second outcome<br />
was a ranked, prioritized list of consequence risks. Using a<br />
traditional set of criteria to define the Risk Priority Number,<br />
or RPN for each functional failure and failure mode, the team<br />
was able to determine which functional failures represented<br />
the greatest risk to Takt Time, the leading business objective<br />
linked to our project, and the ranked order of failure codes<br />
that specifically contribute to this elevated level of risk. In<br />
short, if we began with 250 failure modes for a system, we prioritized<br />
our way down to 12 likely, consequential failure modes<br />
that have a direct, significant impact on Takt time. Twelve<br />
failure modes that would be used to construct a new Equipment<br />
Maintenance Plan, and 238 failure modes that would be<br />
used to evaluate maintenance effectiveness, by way of Failure<br />
Codes, and the effectiveness of standard operating procedures,<br />
MRO strategies, and other asset management plans.<br />
Full circle. Feeling good about the FMEA outcomes, and<br />
relieved by the fact that we prioritized failure modes for reengineering<br />
maintenance plans, I returned the team’s focus<br />
back to Asset Criticality Analysis. We still needed to evaluate<br />
and rank each manufacturing system in terms of the business,<br />
and wanted to define the actions required by Engineering,<br />
Maintenance, Operations and Procurement to mitigate business<br />
risks. Admittedly, I was trying to check my box. A box on<br />
my mental “RCM Checklist” that I had made and have used<br />
for the past 17 years. A list that delivered confident results over<br />
and over again. Excitedly, however, I learned a new lesson. The<br />
items on the list, like the FMEA and Asset Criticality Analysis,<br />
each answered a specific question, and each taught us something<br />
new about our assets that we did not know without it.<br />
But, it was just a list! It was not a sequence or process! It does<br />
not matter where the list begins or ends! RCM is not intended<br />
to be a repeatable process!<br />
Asset criticality is based on the<br />
understanding of how each asset,<br />
maintainABle or not, functions within<br />
the business to meet organizational<br />
oBJectives.<br />
Using the prioritized, ranked list of high-risk failure modes as<br />
thke basis of evaluating the impact to the business, the team<br />
and I launched off into asset criticality. System by system we<br />
used the “predominant functional failure” and their unique set<br />
of failure modes to qualify risk in terms of:<br />
• Downtime impact to Production,<br />
• Potential Impact to Personnel Safety,<br />
• Potential Impact to the Environment, and<br />
• Cost of Corrective Maintenance after one of our<br />
unique failure modes occurs.<br />
My next statement will likely cause some traditionalists to<br />
erupt with emotion, shouting for all to hear that the team’s<br />
analysis is corrupt based on the modal distribution of rankings.<br />
But I am going to say it anyway. The Asset Criticality Analysis<br />
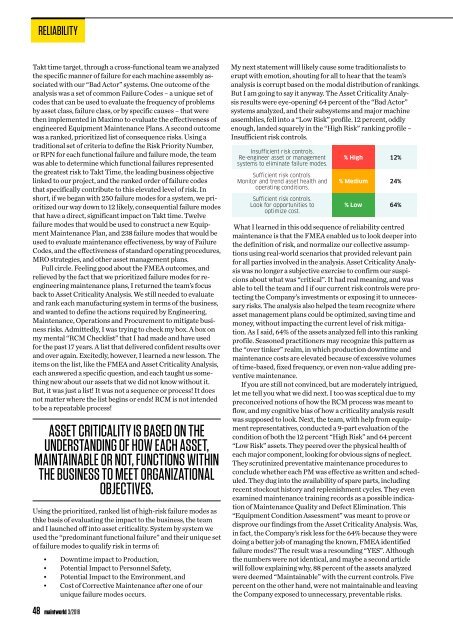
results were eye-opening! 64 percent of the “Bad Actor”<br />
systems analyzed, and their subsystems and major machine<br />
assemblies, fell into a “Low Risk” profile. 12 percent, oddly<br />
enough, landed squarely in the “High Risk” ranking profile –<br />
Insufficient risk controls.<br />
Insufficient risk controls.<br />
Re-engineer asset or management<br />
systems to eliminate failure modes.<br />
Sufficient risk controls.<br />
Monitor and trend asset health and<br />
operating conditions.<br />
Sufficient risk controls.<br />
Look for opportunities to<br />
optimize cost.<br />
% High 12%<br />
% Medium 24%<br />
% Low 64%<br />
What I learned in this odd sequence of reliability centred<br />
maintenance is that the FMEA enabled us to look deeper into<br />
the definition of risk, and normalize our collective assumptions<br />
using real-world scenarios that provided relevant pain<br />
for all parties involved in the analysis. Asset Criticality Analysis<br />
was no longer a subjective exercise to confirm our suspicions<br />
about what was “critical”. It had real meaning, and was<br />
able to tell the team and I if our current risk controls were protecting<br />
the Company’s investments or exposing it to unnecessary<br />
risks. The analysis also helped the team recognize where<br />
asset management plans could be optimized, saving time and<br />
money, without impacting the current level of risk mitigation.<br />
As I said, 64% of the assets analyzed fell into this ranking<br />
profile. Seasoned practitioners may recognize this pattern as<br />
the “over tinker” realm, in which production downtime and<br />
maintenance costs are elevated because of excessive volumes<br />
of time-based, fixed frequency, or even non-value adding preventive<br />
maintenance.<br />
If you are still not convinced, but are moderately intrigued,<br />
let me tell you what we did next. I too was sceptical due to my<br />
preconceived notions of how the RCM process was meant to<br />
flow, and my cognitive bias of how a criticality analysis result<br />
was supposed to look. Next, the team, with help from equipment<br />
representatives, conducted a 9-part evaluation of the<br />
condition of both the 12 percent “High Risk” and 64 percent<br />
“Low Risk” assets. They peered over the physical health of<br />
each major component, looking for obvious signs of neglect.<br />
They scrutinized preventative maintenance procedures to<br />
conclude whether each PM was effective as written and scheduled.<br />
They dug into the availability of spare parts, including<br />
recent stockout history and replenishment cycles. They even<br />
examined maintenance training records as a possible indication<br />
of Maintenance Quality and Defect Elimination. This<br />
“Equipment Condition Assessment” was meant to prove or<br />
disprove our findings from the Asset Criticality Analysis. Was,<br />
in fact, the Company’s risk less for the 64% because they were<br />
doing a better job of managing the known, FMEA identified<br />
failure modes? The result was a resounding “YES”. Although<br />
the numbers were not identical, and maybe a second article<br />
will follow explaining why, 88 percent of the assets analyzed<br />
were deemed “Maintainable” with the current controls. Five<br />
percent on the other hand, were not maintainable and leaving<br />
the Company exposed to unnecessary, preventable risks.<br />
48 maintworld 3/<strong>2018</strong>