

Compendium Test
This is a test for the Compendium
This is a test for the Compendium
- No tags were found...

You also want an ePaper? Increase the reach of your titles
YUMPU automatically turns print PDFs into web optimized ePapers that Google loves.
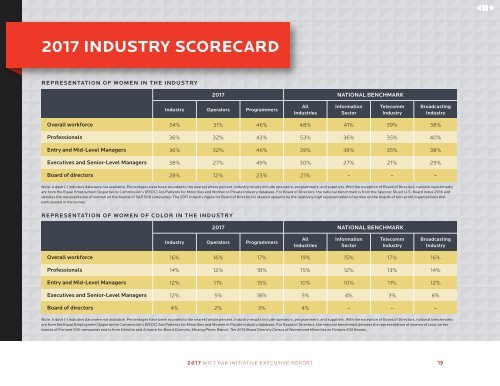
2017 INDUSTRY SCORECARD<br />
REPRESENTATION OF WOMEN IN THE INDUSTRY<br />
2017 NATIONAL BENCHMARK<br />
Industry Operators Programmers<br />
All<br />
Industries<br />
Information<br />
Sector<br />
Telecomm<br />
Industry<br />
Broadcasting<br />
Industry<br />
Overall workforce 34% 31% 46% 48% 41% 39% 38%<br />
Professionals 36% 32% 43% 53% 36% 35% 40%<br />
Entry and Mid-Level Managers 36% 32% 46% 39% 38% 35% 38%<br />
Executives and Senior-Level Managers 38% 27% 49% 30% 27% 21% 29%<br />
Board of directors 28% 12% 23% 21% – – –<br />
Note: A dash (-) indicates data were not available. Percentages have been rounded to the nearest whole percent. Industry results include operators, programmers, and suppliers. With the exception of Board of Directors, national benchmarks<br />
are from the Equal Employment Opportunity Commission’s (EEOC) Job Patterns for Minorities and Women in Private Industry database. For Board of Directors, the national benchmark is from the Spencer Stuart U.S. Board Index 2016 and<br />
denotes the representation of women on the boards of S&P 500 companies. The 2017 Industry figure for Board of Directors is skewed upwards by the relatively high representation of women on the boards of non-profit organizations that<br />
participated in the survey.<br />
REPRESENTATION OF WOMEN OF COLOR IN THE INDUSTRY<br />
2017 NATIONAL BENCHMARK<br />
Industry Operators Programmers<br />
All<br />
Industries<br />
Information<br />
Sector<br />
Telecomm<br />
Industry<br />
Broadcasting<br />
Industry<br />
Overall workforce 16% 16% 17% 19% 15% 17% 16%<br />
Professionals 14% 12% 18% 15% 12% 13% 14%<br />
Entry and Mid-Level Managers 12% 11% 15% 10% 10% 11% 12%<br />
Executives and Senior-Level Managers 12% 5% 18% 5% 4% 3% 6%<br />
Board of directors 4% 2% 3% 4% – – –<br />
Note: A dash (-) indicates data were not available. Percentages have been rounded to the nearest whole percent. Industry results include operators, programmers, and suppliers. With the exception of Board of Directors, national benchmarks<br />
are from the Equal Employment Opportunity Commission’s (EEOC) Job Patterns for Minorities and Women in Private Industry database. For Board of Directors, the national benchmark denotes the representation of women of color on the<br />
boards of Fortune 500 companies and is from Deloitte and Alliance for Board Diversity, Missing Pieces Report: The 2016 Board Diversity Census of Women and Minorities on Fortune 500 Boards.<br />
2017 WICT PAR INITIATIVE EXECUTIVE REPORT<br />
19