

Compendium Test
This is a test for the Compendium
This is a test for the Compendium
- No tags were found...

Create successful ePaper yourself
Turn your PDF publications into a flip-book with our unique Google optimized e-Paper software.
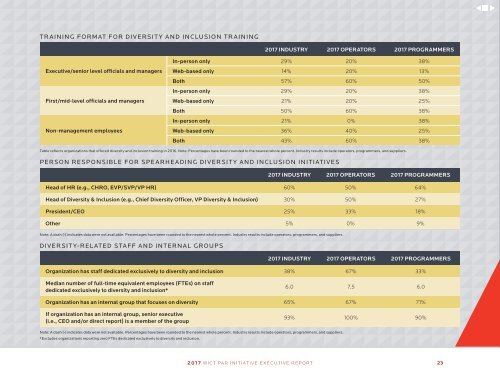
TRAINING FORMAT FOR DIVERSITY AND INCLUSION TRAINING<br />
2017 INDUSTRY 2017 OPERATORS 2017 PROGRAMMERS<br />
Executive/senior level officials and managers<br />
First/mid-level officials and managers<br />
Non-management employees<br />
In-person only 29% 20% 38%<br />
Web-based only 14% 20% 13%<br />
Both 57% 60% 50%<br />
In-person only 29% 20% 38%<br />
Web-based only 21% 20% 25%<br />
Both 50% 60% 38%<br />
In-person only 21% 0% 38%<br />
Web-based only 36% 40% 25%<br />
Both 43% 60% 38%<br />
Table reflects organizations that offered diversity and inclusion training in 2016. Note: Percentages have been rounded to the nearest whole percent. Industry results include operators, programmers, and suppliers.<br />
PERSON RESPONSIBLE FOR SPEARHEADING DIVERSITY AND INCLUSION INITIATIVES<br />
2017 INDUSTRY 2017 OPERATORS 2017 PROGRAMMERS<br />
Head of HR (e.g., CHRO, EVP/SVP/VP HR) 60% 50% 64%<br />
Head of Diversity & Inclusion (e.g., Chief Diversity Officer, VP Diversity & Inclusion) 30% 50% 27%<br />
President/CEO 25% 33% 18%<br />
Other 5% 0% 9%<br />
Note: A dash (-) indicates data were not available. Percentages have been rounded to the nearest whole percent. Industry results include operators, programmers, and suppliers.<br />
DIVERSITY-RELATED STAFF AND INTERNAL GROUPS<br />
2017 INDUSTRY 2017 OPERATORS 2017 PROGRAMMERS<br />
Organization has staff dedicated exclusively to diversity and inclusion 38% 67% 33%<br />
Median number of full-time equivalent employees (FTEs) on staff<br />
dedicated exclusively to diversity and inclusion*<br />
6.0 7.5 6.0<br />
Organization has an internal group that focuses on diversity 65% 67% 71%<br />
If organization has an internal group, senior executive<br />
(i.e., CEO and/or direct report) is a member of the group<br />
93% 100% 90%<br />
Note: A dash (-) indicates data were not available. Percentages have been rounded to the nearest whole percent. Industry results include operators, programmers, and suppliers.<br />
*Excludes organizations reporting zero FTEs dedicated exclusively to diversity and inclusion.<br />
2017 WICT PAR INITIATIVE EXECUTIVE REPORT<br />
23