DCN December Edition 2019

You also want an ePaper? Increase the reach of your titles
YUMPU automatically turns print PDFs into web optimized ePapers that Google loves.
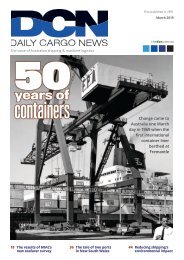
Patrick Terminal,<br />
Port Botany,<br />
Sydney<br />
Melbourne and, to a lesser extent, increased<br />
unit costs.<br />
While some industry-wide profitability<br />
measures have clearly declined, it is<br />
important to note that performance varies<br />
greatly by stevedore. In 2018–19, most<br />
stevedores reported much improved profits<br />
or reduced operating losses, while some<br />
stevedores’ profitability fell.<br />
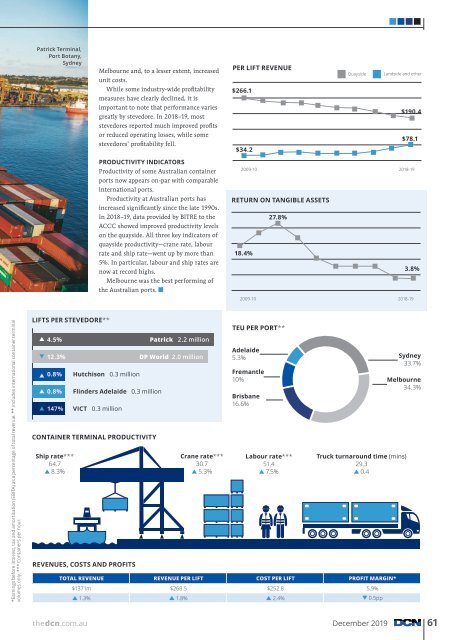
PER LIFT REVENUE<br />
$266.1<br />
$34.2<br />
Quayside<br />
Landside and other<br />
$190.4<br />
$78.1<br />
PRODUCTIVITY INDICATORS<br />
Productivity of some Australian container<br />
ports now appears on-par with comparable<br />
international ports.<br />
Productivity at Australian ports has<br />
increased significantly since the late 1990s.<br />
In 2018–19, data provided by BITRE to the<br />
ACCC showed improved productivity levels<br />
on the quayside. All three key indicators of<br />
quayside productivity—crane rate, labour<br />
rate and ship rate—went up by more than<br />
5%. In particular, labour and ship rates are<br />
now at record highs.<br />
Melbourne was the best performing of<br />
the Australian ports.<br />
2009-10 2018-19<br />
RETURN ON TANGIBLE ASSETS<br />
27.8%<br />
18.4%<br />
3.8%<br />
2009-10 2018-19<br />
*Earnings before interest, tax and amortisation (EBITA) as a percentage of total revenue. ** Includes international container terminal<br />
volumes only. *** Containers per hour.<br />
LIFTS PER STEVEDORE**<br />
4.5% Patrick 2.2 million<br />
12.3% DP World 2.0 million<br />
0.8% Hutchison 0.3 million<br />
0.8% Flinders Adelaide 0.3 million<br />
147% VICT 0.3 million<br />
CONTAINER TERMINAL PRODUCTIVITY<br />
Ship rate***<br />
64.7<br />
8.3%<br />
REVENUES, COSTS AND PROFITS<br />
Crane rate***<br />
30.7<br />
5.3%<br />
TEU PER PORT**<br />
Adelaide<br />
5.3%<br />
Fremantle<br />
10%<br />
Brisbane<br />
16.6%<br />
Labour rate***<br />
51.4<br />
7.5%<br />
TOTAL REVENUE REVENUE PER LIFT COST PER LIFT PROFIT MARGIN*<br />
$1371m $268.5 $252.8 5.9%<br />
1.3% 1.8% 2.4% 0.5pp<br />
Sydney<br />
33.7%<br />
Melbourne<br />
34.3%<br />
Truck turnaround time (mins)<br />
29.3<br />
0.4<br />
thedcn.com.au <strong>December</strong> <strong>2019</strong> 61