CMOS Production Compatible SiGe Heteroepitaxy for High ... - Imec
CMOS Production Compatible SiGe Heteroepitaxy for High ... - Imec
CMOS Production Compatible SiGe Heteroepitaxy for High ... - Imec

You also want an ePaper? Increase the reach of your titles
YUMPU automatically turns print PDFs into web optimized ePapers that Google loves.
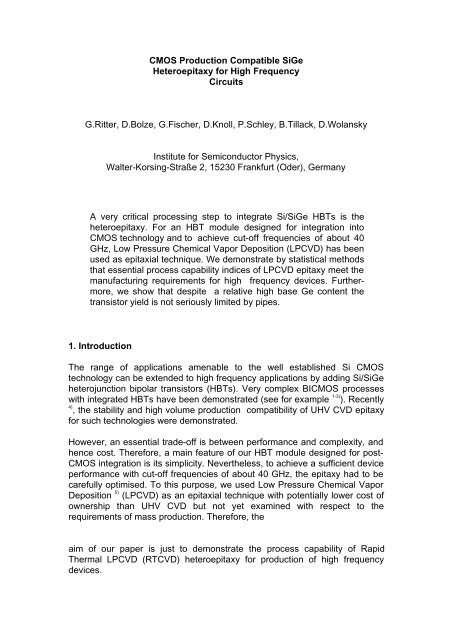
<strong>CMOS</strong> <strong>Production</strong> <strong>Compatible</strong> <strong>SiGe</strong><br />
<strong>Heteroepitaxy</strong> <strong>for</strong> <strong>High</strong> Frequency<br />
Circuits<br />
G.Ritter, D.Bolze, G.Fischer, D.Knoll, P.Schley, B.Tillack, D.Wolansky<br />
1. Introduction<br />
Institute <strong>for</strong> Semiconductor Physics,<br />
Walter-Korsing-Straße 2, 15230 Frankfurt (Oder), Germany<br />
A very critical processing step to integrate Si/<strong>SiGe</strong> HBTs is the<br />
heteroepitaxy. For an HBT module designed <strong>for</strong> integration into<br />
<strong>CMOS</strong> technology and to achieve cut-off frequencies of about 40<br />
GHz, Low Pressure Chemical Vapor Deposition (LPCVD) has been<br />
used as epitaxial technique. We demonstrate by statistical methods<br />
that essential process capability indices of LPCVD epitaxy meet the<br />
manufacturing requirements <strong>for</strong> high frequency devices. Furthermore,<br />
we show that despite a relative high base Ge content the<br />
transistor yield is not seriously limited by pipes.<br />
The range of applications amenable to the well established Si <strong>CMOS</strong><br />
technology can be extended to high frequency applications by adding Si/<strong>SiGe</strong><br />
heterojunction bipolar transistors (HBTs). Very complex BI<strong>CMOS</strong> processes<br />
with integrated HBTs have been demonstrated (see <strong>for</strong> example 1-3) ). Recently<br />
4)<br />
, the stability and high volume production compatibility of UHV CVD epitaxy<br />
<strong>for</strong> such technologies were demonstrated.<br />
However, an essential trade-off is between per<strong>for</strong>mance and complexity, and<br />
hence cost. There<strong>for</strong>e, a main feature of our HBT module designed <strong>for</strong> post-<br />
<strong>CMOS</strong> integration is its simplicity. Nevertheless, to achieve a sufficient device<br />
per<strong>for</strong>mance with cut-off frequencies of about 40 GHz, the epitaxy had to be<br />
carefully optimised. To this purpose, we used Low Pressure Chemical Vapor<br />
Deposition 5) (LPCVD) as an epitaxial technique with potentially lower cost of<br />
ownership than UHV CVD but not yet examined with respect to the<br />
requirements of mass production. There<strong>for</strong>e, the<br />
aim of our paper is just to demonstrate the process capability of Rapid<br />
Thermal LPCVD (RTCVD) heteroepitaxy <strong>for</strong> production of high frequency<br />
devices.
Ge Content (%)<br />
2. Experimental<br />
The tested epitaxial layer stacks, consisting of Si-low doped collector, <strong>SiGe</strong><br />
base, and Si-low doped emitter, were in situ deposited on LOCOS structures<br />
in a commercial single-wafer RTCVD reactor. A typical Ge profile is shown in<br />
Fig. 1. Transistor parameters primarily influenced by the epitaxial<br />
characteristic were measured. To obtain reliable statistics, about 300 similarly<br />
processed 4“ wafers were studied. On each wafer, the parameters were<br />
measured on 120 chips. As measure <strong>for</strong> the stability and wafer uni<strong>for</strong>mity of<br />
the epitaxial base doping, the pinched base sheet resistances R SBi was used.<br />
The thickness of the epitaxial Si layers covering vertically the <strong>SiGe</strong> base were<br />
estimated from the measured junction capacitances of collector-base and<br />
base-emitter, respectively. Thickness and Ge content of the HBT base were<br />
obtained by x-ray diffraction method. Considering the relatively high Ge<br />
content in our base layer in comparison to other authors (e.g. 3,4) ), an<br />
essential point was to evaluate the pipe limited yield by measuring the<br />
collector to emitter leakage current I CE0 of macro devices (emitter area A E = 10 4<br />
µm 2 , external base area A ext = 2 . 10 4 µm 2 ). As non-piped devices we defined<br />
such with a leakage current lower than 10 nA at V CE = 2 V and V BE = 0.<br />
20<br />
15<br />
10<br />
5<br />
XRD Intensity (a.u.)<br />
10<br />
5<br />
-2<br />
10 -2<br />
10<br />
5<br />
-3<br />
10 -3<br />
10<br />
5<br />
-4<br />
10 -4<br />
10<br />
5<br />
-5<br />
10 -5<br />
10 -6<br />
10 -6<br />
-2000 -1000 0<br />
Δ θ (arcsec)<br />
Fig.1:<br />
Ge concentration in the base of an<br />
HBTobtained from XRD rocking curve<br />
(insert) 6) 0 20 40 60 80 100<br />
Depth (nm)<br />
.<br />
Fig.2:<br />
Pipe-limited yield of HBT’s, defined by<br />
a collector-emitter leakage current<br />
criterion.<br />
3. Specification Tolerances and Process Capability Indices<br />
Wafer<br />
0<br />
0 20 40 60 80 100<br />
Both devices and technological processes are specified by a desired target<br />
value (X) and upper and lower specification limits (USL, LSL) of parameters.<br />
The specification tolerance is characterized by the mean values of the<br />
parameters and the value range from -3 s to +3 s (s is their standard<br />
deviation) obtained by suitable measuring methods. The value of 6 s is the<br />
process capability.<br />
The commonly used capability indices 7) are the process potential (C P ) and the<br />
process capability index (C pk ). C P is the ratio of specification tolerance and<br />
60<br />
50<br />
40<br />
30<br />
20<br />
10<br />
Yield of I_CEo<br />
Yield (I_CEo) / %
process capability. C PK considers the difference between target and actual<br />
mean value in relation to the half of specification tolerance. For a stable<br />
technology it is desirable <strong>for</strong> these parameters to be as high as possible.<br />
For reasonable capability studies, the LSL and USL have to be established<br />
properly. To this purpose we simulated the influence of different parameters<br />
of the Si/<strong>SiGe</strong>/Si HBT profile on static and dynamic device per<strong>for</strong>mance. A<br />
variation of the following epitaxial parameters was considered:<br />
The Germanium content in the base plateau (x), the thickness of <strong>SiGe</strong> layer<br />
(DGe), the thickness values of low doped emitter and low doped collector<br />
(LDE, LDC), the Boron dose and there<strong>for</strong>e the R SBi . We calculated the<br />
following device parameters:<br />
The static current gain (B N ), the transit frequency f T and the maximum<br />
oscillation frequency f max , and the noise figure F min .<br />
We obtained the permissible upper and lower variation limits of each epitaxial<br />
parameter not decreasing the f T and f max target values of 10 %, increasing the<br />
F min target of 10 %, and not violating the + 25 % variation window of B N ,<br />
respectively. According to these conditions, we obtained the lower and upper<br />
specification limits of the epitaxy parameters not violating any of the<br />
permissible variation limits of the device parameters considered. The resulting<br />
LSL and USL in relation to the target values are shown in table 1.<br />
4. Results and Conclusions<br />
Fig. 2 shows the yield data reached on processed wafers. It is obviously, that<br />
the device yield is not seriously limited by pipes despite the relative high Ge<br />
content of the HBTs. Defect investigations showed that the layer stacks<br />
overcome epitaxy and post-epitaxial processing including the emitter<br />
annealing ( 800 °C@15 min + 1000°C@ 30 s) without <strong>for</strong>mation of misfit<br />
dislocations. There<strong>for</strong>e, threading dislocations were avoided as main source<br />
of pipes in heteroepitaxy.<br />
Fig. 3 demonstrates by means of the distribution of R SBi considering about 10<br />
000 data points, that our RTCVD epitaxy meets both the technological target<br />
and the specification limits. A similar result we obtained <strong>for</strong> the other<br />
evaluated parameters. For the low doped emitter thickness that is shown in<br />
Fig. 4. The values of C P and C PK obtained <strong>for</strong> all parameters are shown in<br />
table 1.<br />
Summarizing our results, we demonstrated that essential process capability<br />
indices of LPCVD epitaxy meet the manufacturing requirements <strong>for</strong> high<br />
frequency devices. There<strong>for</strong>e, this kind of epitaxy should be a real alternative<br />
to UHV CVD with respect to process stability and cost <strong>for</strong> HBT integration into<br />
high volume production (e. g. <strong>CMOS</strong>).
Tab. 1: Technological targets X, relative upper and lower specification limits<br />
(USL/X, LSL/X), and capability indices C P , C PK of relevant epitaxy<br />
parameters.<br />
Number of Data Points<br />
Parameter X LSL/X USL/X C P C PK<br />
3000<br />
2000<br />
1000<br />
0<br />
LDE<br />
LDC<br />
DGe<br />
x<br />
RSBi<br />
References:<br />
60 nm<br />
120 nm<br />
25 nm<br />
0,20<br />
5000 Ω<br />
Rsbi Distribution<br />
Target<br />
-25 %<br />
-29 %<br />
-50 %<br />
-10 %<br />
-38 %<br />
Mean 4719 Ohm<br />
Sigma 734 Ohm<br />
Cp 1.1<br />
Cpk 0.94<br />
LSL ULS<br />
3000 4000 5000 6000 7000 8000<br />
Rsbi / Ohm<br />
Fig. 3:<br />
Distribution of R SBi including the value of<br />
technological target and specification<br />
limits (LSL, USL). The statistical values<br />
and C P , C PK are inserted.<br />
+42 %<br />
+35 %<br />
+50 %<br />
+10 %<br />
+54 %<br />
1) E. Crabbe et al., IEDM Tech. Dig., pp. 83 - 86, 1993.<br />
2) A. Schüppen et al., IEDM Tech. Dig., pp. 743 - 746, 1995.<br />
3) D. L. Harame et al., IEDM Tech. Dig., pp. 19 - 22, 1992.<br />
4) D. C. Ahlgren et al., IEDM Tech. Dig., pp. 859 - 862, 1996.<br />
5) See, e. g., G. Ritter et al., MRS Symp. Proc., Vol. 387, pp. 341 - 346,<br />
1995.<br />
6) P. Zaumseil, Cryst. Res. Technol. 31(4), pp. 529 - 537, 1996.<br />
7) See, e. g., ed. R. Bowman et al., „Advanced VLSI Fabrication“ (ICE,<br />
1995),<br />
pp. 1017 - 1022.<br />
Number of Data Points<br />
3000<br />
2500<br />
2000<br />
1500<br />
1000<br />
500<br />
1.3<br />
1.6<br />
1.5<br />
1.5<br />
1.1<br />
1.2<br />
1.5<br />
1.4<br />
1.4<br />
0.9<br />
Depletion Layer Width (E-B) Distribution<br />
Target<br />
Mean 48.7 nm<br />
Sigma 4.3 nm<br />
Cp 1.3<br />
Cpk 1.2<br />
LSL ULS<br />
0<br />
30 40 50 60 70<br />
Depletion Layer Width (E-B) / nm<br />
Fig. 4:<br />
Distribution of the thickness values of<br />
low doped emitter obtained by electrical<br />
measurement on the background<br />
of target and specification tolerance<br />
values.