Modelling and Simulating the Selective Epitaxial Growth of ... - Imec
Modelling and Simulating the Selective Epitaxial Growth of ... - Imec
Modelling and Simulating the Selective Epitaxial Growth of ... - Imec

Create successful ePaper yourself
Turn your PDF publications into a flip-book with our unique Google optimized e-Paper software.
<strong>Modelling</strong> <strong>and</strong> <strong>Simulating</strong> <strong>the</strong><br />
<strong>Selective</strong> <strong>Epitaxial</strong> <strong>Growth</strong> <strong>of</strong> Silicon under<br />
Consideration <strong>of</strong> Anisotropic <strong>Growth</strong> Rates<br />
Rainer G. Spallek*, Dietmar Temmler , Thomas Preußer*, Torsten Rönsch*, Stefan Ulbrich*<br />
*Dresden University <strong>of</strong> Technology, Department <strong>of</strong> Computer Engineering, D-01062 Dresden<br />
¡ Infineon Technologies Dresden, D-01099 Dresden<br />
Abstract<br />
¢ rgs,preusser,roensch,ulbrich£ @ite.inf.tu-dresden.de, dietmar.temmler@infineon.com<br />
This work presents a new model for <strong>the</strong> simulation <strong>of</strong><br />
thin layer deposition <strong>and</strong> etching processes. Especially<br />
suited for <strong>the</strong> simulation <strong>of</strong> highly anisotropic processes,<br />
<strong>the</strong> frontier model is introduced in <strong>the</strong> context <strong>of</strong> selective<br />
epitaxial growth <strong>of</strong> silicon. The general approach to this<br />
new simulation model is described, <strong>and</strong> <strong>the</strong> simulation <strong>of</strong><br />
selective epitaxial growth is validated against experimental<br />
results.<br />
1. Introduction<br />
<strong>Epitaxial</strong> growth <strong>of</strong> silicon is widely used to decrease<br />
<strong>the</strong> defect density in <strong>the</strong> wafer production [1]. It has also<br />
been applied to <strong>the</strong> fabrication <strong>of</strong> bipolar transistors [2], to<br />
<strong>the</strong> advanced BiCMOS technology [3] <strong>and</strong> to <strong>the</strong> production<br />
<strong>of</strong> high voltage circuits [4].<br />
The advancing compactification <strong>of</strong> semiconductor devices<br />
entailed different attempts in DRAM technology to<br />
exploit <strong>the</strong> third dimension, such as vertical transistors<br />
[5] <strong>and</strong> epi-buried-straps [6]. The latter concept realizes<br />
a stacked DRAM design by implementing <strong>the</strong> selection<br />
transistor <strong>of</strong> a DRAM cell partly on epitaxially grown silicon,<br />
thus moving it closer to or even partially above <strong>the</strong><br />
deep trench capacitor.<br />
Today’s st<strong>and</strong>ard process simulation s<strong>of</strong>tware does not<br />
include models for selective epitaxy. Heeding <strong>the</strong> special<br />
nature <strong>of</strong> silicon epitaxy, this paper introduces <strong>the</strong> frontier<br />
model as a new concept for <strong>the</strong> simulation <strong>of</strong> thin<br />
layer deposition <strong>and</strong> removal. Section 2 outlines <strong>the</strong> physical<br />
background <strong>of</strong> <strong>the</strong> epitaxy process; section 3 introduces<br />
<strong>the</strong> concept <strong>of</strong> <strong>the</strong> new simulation model; section 4<br />
presents <strong>the</strong> obtained results <strong>and</strong> <strong>the</strong>ir experimental validation;<br />
<strong>and</strong> section 5 concludes <strong>the</strong> paper.<br />
2. Physical background<br />
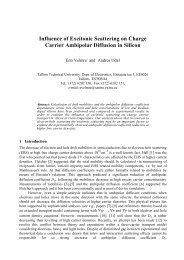
The epitaxial growth <strong>of</strong> silicon is regularly performed<br />
as a Chemical Vapor Deposition (CVD) process deploying<br />
silane (¤¦¥¨§�© ) or one <strong>of</strong> its chlorine derivates (¤¦¥�§�©���������� )<br />
as gaseous silicon source <strong>of</strong>ten accompanied by hydrogen<br />
(§�� ) <strong>and</strong> hydrogen chloride (§���� ). A dichloro silane<br />
¤¦¥�§ � ��� � (g)<br />
¤�¥���� � (*) ��§ � (g)<br />
��� (gas)<br />
� (g) ��§ � (g)<br />
¤¦¥����<br />
��� (surface)<br />
(s) ����§���� (g)<br />
¤¦¥<br />
g — gaseous; s — solid; * — activated<br />
Figure 1: Dichloro silane process<br />
Figure 2: <strong>Growth</strong> <strong>of</strong> a ¢������<br />
£ -face<br />
) process in an § � /§���� -enriched atmosphere (����¤ 1 provided<br />
<strong>the</strong> reference for <strong>the</strong> calibration <strong>and</strong> validation <strong>of</strong><br />
our simulation model. This process was thoroughly studied<br />
in [7] where dichloro (¤¦¥������ silylene ) was identified<br />
as <strong>the</strong> main species responsible for <strong>the</strong> surface absorption<br />
through reactions similar to those shown in Figure 1.<br />
During selective epitaxial growth (SEG), deposited silicon<br />
atoms tend, by surface diffusion, to fill holes in <strong>the</strong><br />
surface plane to reduce <strong>the</strong> number <strong>of</strong> dangling bounds.<br />
Figure 2 illustrates this effect for a ¢������<br />
-face, where<br />
£<br />
only atoms within <strong>the</strong> surface layer are left with two open<br />
bounds. The same holds for <strong>the</strong> ¢������<br />
-face. O<strong>the</strong>r faces<br />
£<br />
frequently observed after SEG processes are ¢������<br />
,<br />
¢������<br />
£<br />
<strong>and</strong>, occasionally, £ ¢������<br />
are assumed to be composed <strong>of</strong> different crystallographic<br />
steps [8].<br />
Process parameters <strong>of</strong> <strong>the</strong> SEG range from temperature,<br />
total <strong>and</strong> partial gas pressures to gas flow properties<br />
<strong>and</strong> <strong>the</strong> current surface structure. An increase <strong>of</strong> <strong>the</strong> process<br />
temperature or <strong>the</strong> total pressure speeds up <strong>the</strong> growth<br />
£ , <strong>the</strong> last two <strong>of</strong> which<br />
1 performed on a 200 mm-Epi-Centura by Applied Materials
{110}<br />
{113}<br />
{001}<br />
Nitride Nitride<br />
Silicon<br />
{113}<br />
Figure 3: Schematic SEG process<br />
{110}<br />
<strong>and</strong> results in s<strong>of</strong>ter contours, i. e. less clearly distinguishable<br />
faces. Higher pressure also reduces <strong>the</strong> selectivity <strong>of</strong><br />
<strong>the</strong> growth, a property majorly influenced by <strong>the</strong> share <strong>of</strong><br />
§���� in <strong>the</strong> total gas flow. Low §���� concentrations enable<br />
<strong>the</strong> nucleation <strong>of</strong> silicon on all surfaces whereas high §����<br />
concentrations yield a selective growth exclusively on silicon<br />
surfaces or even a net etching <strong>of</strong> silicon.<br />
While selectivity is not an issue during substrate preparation,<br />
it is a valuable instrument during device fabrication.<br />
Since SEG directly affects <strong>the</strong> device properties,<br />
its simulation is critical. On monocrystal silicon, extremely<br />
anisotropic growth rates dependent on <strong>the</strong> crystallographic<br />
faces are observed, which establish a challenge<br />
for <strong>the</strong> simulation tool. Figure 3 depicts <strong>the</strong> typical growth<br />
schematically.<br />
{110}<br />
{113}<br />
{001}<br />
{113}<br />
{111} {111}<br />
{110}<br />
Figure 4: <strong>Growth</strong> rate as a function <strong>of</strong> growth direction<br />
3. Simulation model<br />
Typical process simulators describe <strong>the</strong> device structure<br />
by a set <strong>of</strong> discretisation points. Since SEG simulation<br />
essentially requires <strong>the</strong> movement <strong>of</strong> <strong>the</strong> surface, a<br />
model assigning a displacement to each surface point � is<br />
applied:<br />
�����������������<br />
1<br />
Silicon<br />
2<br />
4<br />
3<br />
Nitride<br />
Figure 5: Basic frontier growth in frontier model<br />
where <strong>the</strong> growth rate ������� can depend on <strong>the</strong> material<br />
at � (selectivity), surface direction (anisotropic growth),<br />
process temperature <strong>and</strong> pressure <strong>and</strong> on <strong>the</strong> simulation<br />
time step.<br />
Our implementation <strong>of</strong> <strong>the</strong> SEG simulation was incorporated<br />
into DUPSIM, a 2D device <strong>and</strong> process simulator<br />
developed at Dresden University <strong>of</strong> Technology. For <strong>the</strong><br />
processed device structures, DUPSIM uses a string representation<br />
describing layer boundaries as polylines. Although<br />
initial simulations were performed with rate models<br />
like <strong>the</strong> one shown in Figure 4, manually fitted to specific<br />
process parameters 2 , no satisfying results were obtained.<br />
The string model turned out to be incapable <strong>of</strong><br />
h<strong>and</strong>ling <strong>the</strong> extremely anisotropic growth rates <strong>and</strong> generating<br />
correct faces. These deficiencies <strong>of</strong> <strong>the</strong> string approach<br />
are due to <strong>the</strong> concave shape <strong>of</strong> <strong>the</strong> applied rate<br />
model, which leaves <strong>the</strong> exact behavior <strong>of</strong> a surface movement<br />
undefined in angles.<br />
We introduce <strong>the</strong> frontier model as a new approach to<br />
model <strong>the</strong> growth <strong>of</strong> crystallographic faces. The central<br />
idea is to move <strong>the</strong> line segments defining <strong>the</strong> surface instead<br />
<strong>of</strong> its discretization points. Each segment is translated<br />
perpendicularly according to <strong>the</strong> rate obtained from<br />
<strong>the</strong> rate model. Wherever two line segments meet at an<br />
angle, certain intermediate directions are introduced to allow<br />
<strong>the</strong> formation <strong>of</strong> new faces. These directions can be<br />
generated within <strong>the</strong> simulation s<strong>of</strong>tware or taken from a<br />
crystallographic knowledge base <strong>of</strong> preferred growth directions.<br />
Finally, <strong>the</strong> new surface is determined by concatenating<br />
<strong>the</strong> intersection points <strong>of</strong> <strong>the</strong> possibly extrapolated<br />
line segments.<br />
The basic process <strong>of</strong> frontier growth is illustrated in<br />
Figure 5. The growth is performed selectively only on<br />
silicon surfaces. Also note <strong>the</strong> additional frontiers at <strong>the</strong><br />
corner <strong>of</strong> <strong>the</strong> silicon structure, not all <strong>of</strong> <strong>the</strong>m persisting<br />
within <strong>the</strong> final polyline <strong>of</strong> <strong>the</strong> new surface.<br />
2 850 � C, 15 Torr, 32 slm ��� , 0.26 slm ����� , <strong>and</strong> 0.16 slm ����� in a<br />
��������� cross section
Nitride<br />
Silicon<br />
Figure 6: Overgrowth at material boundaries<br />
Similarly to <strong>the</strong> loop elimination in string model implementations,<br />
<strong>the</strong> frontier model needs to be able to identify<br />
frontiers that are relevant to a proper surface description.<br />
Assume <strong>the</strong> surface described in Figure 5 is processed<br />
from left to right. Line segment 1 be given in parametric<br />
form by its leftmost point <strong>and</strong> a horizontal direction<br />
pointing to <strong>the</strong> right. Each succeeding line segment is defined<br />
by its intersection � point with its predecessor, <strong>and</strong><br />
a �<br />
�<br />
vector in processing direction:<br />
�����<br />
���������<br />
�<br />
A line segment whose presumed successor intersects at a<br />
point with ��� 0 is irrelevant. This holds for segment 3 <strong>of</strong><br />
Figure 5. Thus, <strong>the</strong> identification <strong>of</strong> irrelevant line segments<br />
can easily be done during <strong>the</strong> transformation <strong>and</strong><br />
does not require an additional processing step.<br />
Although o<strong>the</strong>r materials are overgrown by epitaxial<br />
silicon, a material boundary establishes a discontinuity enabling<br />
<strong>the</strong> formation <strong>of</strong> new faces. Our implementation<br />
assumes <strong>the</strong> boundary point to be <strong>the</strong> seed <strong>of</strong> <strong>the</strong> epitaxial<br />
overgrowth. Therefore, as illustrated in Figure 6, all faces<br />
throughout a 270 ¡<br />
loop are calculated speculatively. The<br />
first intersection point <strong>of</strong> <strong>the</strong> surface <strong>of</strong> <strong>the</strong> neighboring<br />
material with this loop <strong>the</strong>n determines <strong>the</strong> first relevant<br />
segment.<br />
4. Experimental validation<br />
The primary test structure for <strong>the</strong> calibration <strong>and</strong> validation<br />
<strong>of</strong> our simulation was a silicon window. A layer <strong>of</strong><br />
80 nm <strong>of</strong> silicon nitride was deposited on 20 mm wafers<br />
with an initial growth <strong>of</strong> padoxide. Following lithography<br />
<strong>and</strong> etching steps produced windows <strong>of</strong> about 140 nm diameter<br />
within <strong>the</strong> nitride layer.<br />
Various SEG processes were conducted on wafers with<br />
those structures. Our experiments spanned a temperature<br />
range from 850 to 1000 ¡ C <strong>and</strong> were carried out with an<br />
overall pressure <strong>of</strong> 15 Torr <strong>and</strong> varying partial gas pressures.<br />
The st<strong>and</strong>ard experiment <strong>the</strong> results refer to was<br />
a 850 ¡ C process at 15 Torr with gas flows <strong>of</strong> 32 §�� slm ,<br />
0.26 slm DCS <strong>and</strong> 0.16 §���� slm .<br />
Measurements were performed within SEM (scanning<br />
electron microscope) pictures, as <strong>the</strong> one presented in Figure<br />
7 showing a ¢������<br />
cross section. The typical stable<br />
£<br />
Figure 7: Silicon window – experimental result<br />
Figure 8: Silicon window – simulation result<br />
crystallographic faces [8] at ¢������<br />
, £ ¢������<br />
<strong>and</strong> £ ¢������<br />
£<br />
can be observed.<br />
Experiments with different target thicknesses from 30<br />
to 170 nm provided <strong>the</strong> data <strong>of</strong> <strong>the</strong> epitaxial growth <strong>of</strong> <strong>the</strong><br />
main faces, which was used to calibrate <strong>the</strong> rate model in<br />
<strong>the</strong> crystallographic knowledge base <strong>of</strong> preferred growth<br />
directions within <strong>the</strong> process simulator DUPSIM. Figure 8<br />
shows a typical simulation result, including a final reflow<br />
process step.<br />
To show that, beyond <strong>the</strong> qualitative congruence, <strong>the</strong>re<br />
is also a quantitative match <strong>of</strong> experimental <strong>and</strong> simulation<br />
results, various measurements have been done. The<br />
definitions <strong>of</strong> <strong>the</strong> measurement points are given in Figure<br />
9. They reflect <strong>the</strong> most important features <strong>of</strong> <strong>the</strong><br />
grown structure. A direct comparison <strong>of</strong> experimental <strong>and</strong><br />
simulation results, as provided in Table 1, shows a close<br />
correspondence between <strong>the</strong> physical process <strong>and</strong> its simulation.<br />
5. Conclusion<br />
The frontier model is introduced as a new approach<br />
to model <strong>the</strong> growth <strong>of</strong> crystallographic faces. By moving<br />
whole frontiers instead <strong>of</strong> just discretization points (as<br />
in <strong>the</strong> string model), extremely anisotropic growth rates,<br />
which occur in <strong>the</strong> selective epitaxial growth <strong>of</strong> silicon,<br />
can be h<strong>and</strong>led.<br />
The implementation <strong>of</strong> <strong>the</strong> frontier model strongly<br />
benefits from <strong>the</strong> close contact to <strong>the</strong> practical epitaxy experiments.<br />
So <strong>the</strong> rate model is directly derivated from<br />
<strong>the</strong> measurement results <strong>of</strong> real selective epitaxial growth<br />
processes.<br />
Experimental validation <strong>of</strong> <strong>the</strong> results shows a good<br />
congruence between simulation <strong>and</strong> <strong>the</strong> physical process<br />
<strong>of</strong> selective epitaxy. Moreover, <strong>the</strong> advantages <strong>of</strong> <strong>the</strong> new<br />
concept may also be used for etching <strong>and</strong> o<strong>the</strong>r processes<br />
<strong>of</strong> thin layer deposition <strong>and</strong> removal.
4a 3 4b<br />
1<br />
Figure 9: Silicon window – measurement template<br />
experimental<br />
results [nm]<br />
simulation<br />
results [nm]<br />
target thickness [nm]<br />
30,0 90,0 130,0 170,0<br />
1 173,0 165,1 169,0 171,0<br />
2 31,5 95,3 136,6 174,9<br />
3 141,5 45,2 26,5 17,7<br />
4a 23,6 63,9 69,8 80,6<br />
4b 20,6 64,9 83,5 82,6<br />
1 175,0 175,0 175,0 175,0<br />
2 30,5 93,5 136,0 178,0<br />
3 128,9 55,3 32,2 6,7<br />
4a 23,0 59,9 71,4 84,2<br />
4b 23,0 59,9 71,4 84,2<br />
Table 1: Comparison: experimental vs. simulation results<br />
References<br />
[1] C. Menon, A. Bentzen, G. L<strong>and</strong>gren, <strong>and</strong> H. Radamson,<br />
“Defect density in non-selective <strong>and</strong> selective<br />
Si/SiGe structures,” Journal <strong>of</strong> Crystal <strong>Growth</strong>,<br />
vol. 237, p. 259ff, Apr. 2002.<br />
[2] R. Bashir, F. Hébert, J. DeSantis, et al., “A complementary<br />
bipolar technology family with a vertically<br />
integrated PNP for high-frequency analog applications,”<br />
IEEE Transactions on Electron Devices,<br />
vol. 48, p. 2525ff, Nov. 2001.<br />
[3] M. Racanelli, K. Schuegraf, A. Kalburge, et al., “Ultra<br />
high speed SiGe NPN for advanced BiCMOS technology,”<br />
IEDM Technical Digest, p. 336ff, 2001.<br />
[4] K. Fujihira, S. Tamura, T. Kimoto, <strong>and</strong> H. Matsunami,<br />
“Low-loss, high-voltage 6H-SiC epitaxial pi-n<br />
diode,” IEEE Transactions on Electron Devices,<br />
vol. 49, p. 150ff, Jan. 2002.<br />
[5] D. Behammer, L. Vescan, R. Loo, et al., “<strong>Selective</strong>ly<br />
grown vertical Si-p MOS transistor with short channel<br />
lengths,” Electronics Letters, vol. 32, no. 4, p. 406ff,<br />
1996.<br />
2<br />
[6] M. Liebsch, “Selektives epitaktisches Schichtwachstum<br />
für skalierte DRAM,” Diplomarbeit, Dresden<br />
University <strong>of</strong> Technology, July 2002.<br />
[7] M. T. Swihart <strong>and</strong> R. W. Carr, “On <strong>the</strong> mechanism<br />
<strong>of</strong> homogeneous decomposition <strong>of</strong> <strong>the</strong> chlorinated<br />
silanes. Chain reactions propagated by divalent silicon<br />
species,” J. Phys. Chem. A, vol. 102, no. 9, p. 1542ff,<br />
1998.<br />
[8] K. Grimm, “Untersuchung der Facettenbildung bei selektiver<br />
Epitaxie von Si mittels LPCVD,” Forschungsbericht<br />
Jül-3416, Forschungszentrum Jülich, Institut<br />
für Schicht- und Ionentechnik, July 1997.