Synthesis, Characterization, and Gas Permeation Properties
Synthesis, Characterization, and Gas Permeation Properties
Synthesis, Characterization, and Gas Permeation Properties

Create successful ePaper yourself
Turn your PDF publications into a flip-book with our unique Google optimized e-Paper software.
39<br />
Chapter 1<br />
The DSEt of ethyl cellulose was estimated to be 2.69, by calculating the integration<br />
ratio of methyl protons (labeled as a, in Figure 1) to the rest of the protons in ethyl<br />
cellulose, indicating the presence of 0.31 hydroxy groups per anhydroglucose unit.<br />
Degree of silylation (DSSi) of polymers (2a–f) was determined by calculating the<br />
integration ratio of the methyl protons of ethyl (labeled as a, in Figure 1) to those of<br />
silyl content (labeled as b, in Figure 1) <strong>and</strong> complete silylation of the residual hydroxy<br />
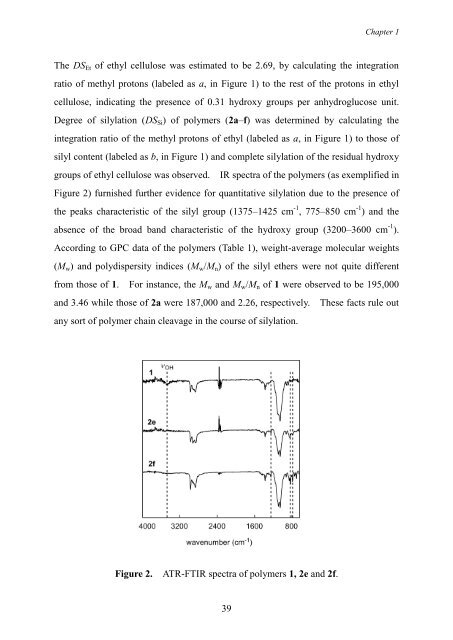
groups of ethyl cellulose was observed. IR spectra of the polymers (as exemplified in<br />
Figure 2) furnished further evidence for quantitative silylation due to the presence of<br />
the peaks characteristic of the silyl group (1375–1425 cm -1 , 775–850 cm -1 ) <strong>and</strong> the<br />
absence of the broad b<strong>and</strong> characteristic of the hydroxy group (3200–3600 cm -1 ).<br />
According to GPC data of the polymers (Table 1), weight-average molecular weights<br />
(Mw) <strong>and</strong> polydispersity indices (Mw/Mn) of the silyl ethers were not quite different<br />
from those of 1. For instance, the Mw <strong>and</strong> Mw/Mn of 1 were observed to be 195,000<br />
<strong>and</strong> 3.46 while those of 2a were 187,000 <strong>and</strong> 2.26, respectively. These facts rule out<br />
any sort of polymer chain cleavage in the course of silylation.<br />
Figure 2. ATR-FTIR spectra of polymers 1, 2e <strong>and</strong> 2f.