Comprehensive Annual Financial Report 2020
The Comprehensive Annual Financial Report includes all funds of the city. This report includes all government activities, organizations, and functions for which the City is financially accountable.
The Comprehensive Annual Financial Report includes all funds of the city. This report includes all government activities, organizations, and functions for which the City is financially accountable.

Create successful ePaper yourself
Turn your PDF publications into a flip-book with our unique Google optimized e-Paper software.
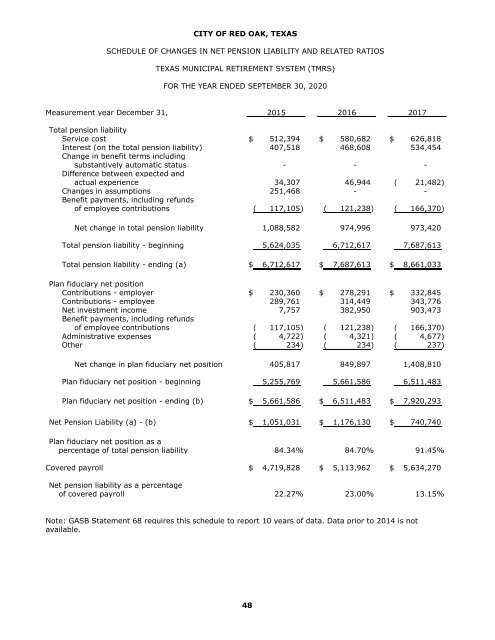
CITY OF RED OAK, TEXAS<br />
SCHEDULE OF CHANGES IN NET PENSION LIABILITY AND RELATED RATIOS<br />
TEXAS MUNICIPAL RETIREMENT SYSTEM (TMRS)<br />
FOR THE YEAR ENDED SEPTEMBER 30, <strong>2020</strong><br />
Measurement year December 31, 2015 2016 2017<br />
Total pension liability<br />
Service cost $ 512,394 $ 580,682 $ 626,818<br />
Interest (on the total pension liability) 407,518 468,608 534,454<br />
Change in benefit terms including<br />
substantively automatic status - - -<br />
Difference between expected and<br />
actual experience 34,307 46,944 ( 21,482)<br />
Changes in assumptions 251,468 - -<br />
Benefit payments, including refunds<br />
of employee contributions ( 117,105) ( 121,238) ( 166,370)<br />
Net change in total pension liability 1,088,582 974,996 973,420<br />
Total pension liability - beginning 5,624,035 6,712,617 7,687,613<br />
Total pension liability - ending (a) $ 6,712,617 $ 7,687,613 $ 8,661,033<br />
Plan fiduciary net position<br />
Contributions - employer $ 230,360 $ 278,291 $ 332,845<br />
Contributions - employee 289,761 314,449 343,776<br />
Net investment income 7,757 382,950 903,473<br />
Benefit payments, including refunds<br />
of employee contributions ( 117,105) ( 121,238) ( 166,370)<br />
Administrative expenses ( 4,722) ( 4,321) ( 4,677)<br />
Other ( 234) ( 234) ( 237)<br />
Net change in plan fiduciary net position 405,817 849,897 1,408,810<br />
Plan fiduciary net position - beginning 5,255,769 5,661,586 6,511,483<br />
Plan fiduciary net position - ending (b) $ 5,661,586 $ 6,511,483 $ 7,920,293<br />
Net Pension Liability (a) - (b) $ 1,051,031 $ 1,176,130 $ 740,740<br />
Plan fiduciary net position as a<br />
percentage of total pension liability 84.34% 84.70% 91.45%<br />
Covered payroll $ 4,719,828 $ 5,113,962 $ 5,634,270<br />
Net pension liability as a percentage<br />
of covered payroll 22.27% 23.00% 13.15%<br />
Note: GASB Statement 68 requires this schedule to report 10 years of data. Data prior to 2014 is not<br />
available.<br />
48