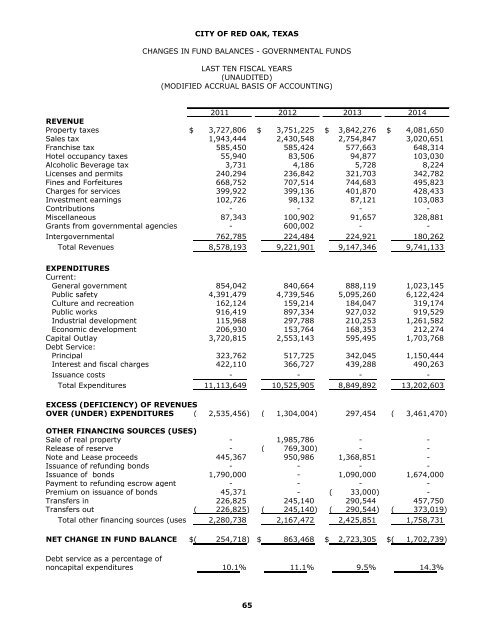
CITY OF RED OAK, TEXAS CHANGES IN FUND BALANCES - GOVERNMENTAL FUNDS LAST TEN FISCAL YEARS (UNAUDITED) (MODIFIED ACCRUAL BASIS OF ACCOUNTING) 2011 2012 2013 2014 REVENUE Property taxes $ 3,727,806 $ 3,751,225 $ 3,842,276 $ 4,081,650 Sales tax 1,943,444 2,430,548 2,754,847 3,020,651 Franchise tax 585,450 585,424 577,663 648,314 Hotel occupancy taxes 55,940 83,506 94,877 103,030 Alcoholic Beverage tax 3,731 4,186 5,728 8,224 Licenses and permits 240,294 236,842 321,703 342,782 Fines and Forfeitures 668,752 707,514 744,683 495,823 Charges for services 399,922 399,136 401,870 428,433 Investment earnings 102,726 98,132 87,121 103,083 Contributions - - - - Miscellaneous 87,343 100,902 91,657 328,881 Grants from governmental agencies - 600,002 - - Intergovernmental 762,785 224,484 224,921 180,262 Total Revenues 8,578,193 9,221,901 9,147,346 9,741,133 EXPENDITURES Current: General government 854,042 840,664 888,119 1,023,145 Public safety 4,391,479 4,739,546 5,095,260 6,122,424 Culture and recreation 162,124 159,214 184,047 319,174 Public works 916,419 897,334 927,032 919,529 Industrial development 115,968 297,788 210,253 1,261,582 Economic development 206,930 153,764 168,353 212,274 Capital Outlay 3,720,815 2,553,143 595,495 1,703,768 Debt Service: Principal 323,762 517,725 342,045 1,150,444 Interest and fiscal charges 422,110 366,727 439,288 490,263 Issuance costs - - - - Total Expenditures 11,113,649 10,525,905 8,849,892 13,202,603 EXCESS (DEFICIENCY) OF REVENUES OVER (UNDER) EXPENDITURES ( 2,535,456) ( 1,304,004) 297,454 ( 3,461,470) OTHER FINANCING SOURCES (USES) Sale of real property - 1,985,786 - - Release of reserve - ( 769,300) - - Note and Lease proceeds 445,367 950,986 1,368,851 - Issuance of refunding bonds - - - - Issuance of bonds 1,790,000 - 1,090,000 1,674,000 Payment to refunding escrow agent - - - - Premium on issuance of bonds 45,371 - ( 33,000) - Transfers in 226,825 245,140 290,544 457,750 Transfers out ( 226,825) ( 245,140) ( 290,544) ( 373,019) Total other financing sources (uses) 2,280,738 2,167,472 2,425,851 1,758,731 NET CHANGE IN FUND BALANCE $( 254,718) $ 863,468 $ 2,723,305 $( 1,702,739) Debt service as a percentage of noncapital expenditures 10.1% 11.1% 9.5% 14.3% 65
Table 4 2015 2016 2017 2018 2019 <strong>2020</strong> $ 4,177,442 $ 4,718,288 $ 5,248,141 $ 5,919,915 $ 6,881,332 $ 7,905,106 4,072,836 3,897,973 3,761,566 4,433,407 4,693,893 5,584,807 780,644 759,708 853,683 735,818 777,141 742,438 122,882 165,188 162,468 169,662 195,732 162,389 8,663 12,501 11,887 13,641 13,950 9,878 453,860 383,631 448,161 924,535 811,267 1,277,120 467,813 469,496 469,637 363,928 432,708 379,145 456,898 490,104 492,042 525,998 550,923 8,154,215 108,996 117,567 138,703 189,107 353,138 332,046 - - - - - 144,367 274,542 167,734 189,597 126,087 140,620 56,382 - - - - - - 339,721 608,311 454,275 701,691 567,042 1,372,133 11,264,297 11,790,501 12,230,160 14,103,789 15,417,746 26,120,026 1,033,065 1,165,085 1,277,771 755,204 1,052,036 1,610,525 5,607,528 6,044,534 6,403,553 7,547,007 8,519,195 8,070,342 309,878 342,409 324,024 373,696 393,798 800,430 980,329 1,240,448 1,160,727 1,071,367 1,411,637 2,063,724 81,704 59,489 94,367 173,975 155,888 1,104,636 131,452 581,446 157,583 70,634 191,916 58,940 541,862 937,304 2,494,281 1,203,551 7,000,822 2,225,172 707,505 706,007 1,024,536 1,145,992 1,838,205 2,534,062 472,014 401,682 599,303 491,610 822,758 931,131 - - - - - 299,168 9,865,337 11,478,404 13,536,145 12,833,036 21,386,255 19,698,130 1,398,960 312,097 (1,305,985) 1,270,753 ( 5,968,509) 6,421,896 - 1,148,148 196,685 - - - - - - - - - - - - - - - - - - - - 1,830,000 4,097,000 4,208,000 3,305,000 - 10,130,000 9,443,000 ( 3,762,314) - ( 1,016,257) - - ( 2,041,218) 176,016 - 238,193 - 619,355 250,331 398,950 402,540 578,062 449,480 1,251,476 3,254,225 ( 398,950) ( 402,540) ( 744,883) ( 587,438) ( 1,251,476) ( 3,254,225) 510,702 5,356,148 2,556,800 ( 137,958) 10,749,355 9,482,113 $ 1,909,662 $ 5,668,245 $ 1,250,815 $ 1,132,795 $ 4,780,846 $ 15,904,009 12.7% 10.5% 14.7% 14.1% 18.5% 21.6% 66
- Page 1 and 2:
City of Red Oak, Texas Comprehensiv
- Page 3 and 4:
Required Supplementary Information
- Page 5 and 6:
THIS PAGE LEFT BLANK INTENTIONALLY
- Page 7 and 8:
THIS PAGE LEFT BLANK INTENTIONALLY
- Page 9 and 10:
THE CITY The City of Red Oak (the
- Page 11 and 12:
INDUSTRY During 2020, Compass Datac
- Page 13 and 14:
In order to be awarded a Certificat
- Page 15 and 16:
Government Finance Officers Associa
- Page 18 and 19:
THIS PAGE LEFT BLANK INTENTIONALLY
- Page 20 and 21:
THIS PAGE LEFT BLANK INTENTIONALLY
- Page 22 and 23:
Other Matters Required Supplementar
- Page 24 and 25:
Both of the government-wide financi
- Page 26 and 27:
Changes in Net Position Governmenta
- Page 28 and 29:
Governmental Activities Business-ty
- Page 30 and 31:
Capital Projects Capital project fu
- Page 32 and 33:
THIS PAGE LEFT BLANK INTENTIONALLY
- Page 34 and 35:
CITY OF RED OAK, TEXAS STATEMENT OF
- Page 36 and 37:
CITY OF RED OAK, TEXAS BALANCE SHEE
- Page 38 and 39:
THIS PAGE LEFT BLANK INTENTIONALLY
- Page 40 and 41:
CITY OF RED OAK, TEXAS STATEMENT OF
- Page 42 and 43:
CITY OF RED OAK, TEXAS RECONCILIATI
- Page 44 and 45:
CITY OF RED OAK, TEXAS STATEMENT OF
- Page 46 and 47:
CITY OF RED OAK, TEXAS STATEMENT OF
- Page 48 and 49: Governmental fund financial stateme
- Page 50 and 51: The costs of normal maintenance and
- Page 52 and 53: Committed fund balance includes fun
- Page 54 and 55: V. CAPITAL ASSETS Capital asset act
- Page 56 and 57: VII. LONG-TERM DEBT Long-term debt
- Page 58 and 59: Bonds payable currently outstanding
- Page 60 and 61: Revenue Bonds - Governmental Activi
- Page 62 and 63: The actuarial assumptions were deve
- Page 64 and 65: The City reported $384,378 as defer
- Page 66 and 67: OPEB Expense, Deferred Outflows, an
- Page 68 and 69: THIS PAGE LEFT BLANK INTENTIONALLY
- Page 70 and 71: CITY OF RED OAK, TEXAS SCHEDULE OF
- Page 72 and 73: THIS PAGE LEFT BLANK INTENTIONALLY
- Page 74 and 75: CITY OF RED OAK, TEXAS SCHEDULE OF
- Page 76 and 77: CITY OF RED OAK, TEXAS SCHEDULE OF
- Page 78 and 79: CITY OF RED OAK, TEXAS SCHEDULE OF
- Page 80 and 81: THIS PAGE LEFT BLANK INTENTIONALLY
- Page 82 and 83: CITY OF RED OAK, TEXAS COMBINING BA
- Page 84 and 85: CITY OF RED OAK, TEXAS SCHEDULE OF
- Page 86 and 87: THIS PAGE LEFT BLANK INTENTIONALLY
- Page 88 and 89: THIS PAGE LEFT BLANK INTENTIONALLY
- Page 90 and 91: CITY OF RED OAK, TEXAS NET POSITION
- Page 92 and 93: CITY OF RED OAK, TEXAS CHANGES IN N
- Page 94 and 95: CITY OF RED OAK, TEXAS CHANGES IN N
- Page 96 and 97: CITY OF RED OAK, TEXAS FUND BALANCE
- Page 100 and 101: CITY OF RED OAK, TEXAS ASSESSED VAL
- Page 102 and 103: CITY OF RED OAK, TEXAS DIRECT AND O
- Page 104 and 105: THIS PAGE LEFT BLANK INTENTIONALLY
- Page 106 and 107: CITY OF RED OAK, TEXAS RATIOS OF GE
- Page 108 and 109: THIS PAGE LEFT BLANK INTENTIONALLY
- Page 110 and 111: CITY OF RED OAK, TEXAS RATIOS OF GE
- Page 112 and 113: CITY OF RED OAK, TEXAS DIRECT AND O
- Page 114 and 115: CITY OF RED OAK, TEXAS PLEDGE-REVEN
- Page 116 and 117: THIS PAGE LEFT BLANK INTENTIONALLY
- Page 118 and 119: CITY OF RED OAK, TEXAS FULL-TIME EQ
- Page 120 and 121: CITY OF RED OAK, TEXAS OPERATING IN
- Page 122 and 123: THIS PAGE LEFT BLANK INTENTIONALLY
- Page 124 and 125: THIS PAGE LEFT BLANK INTENTIONALLY
- Page 126 and 127: Compliance and Other Matters As par
- Page 128: THIS PAGE LEFT BLANK INTENTIONALLY