Asian Sky Quarterly 2021 Q3

Create successful ePaper yourself
Turn your PDF publications into a flip-book with our unique Google optimized e-Paper software.
ECONOMICS<br />
EAST ASIA & CENTRAL ASIA | JAPAN, SOUTH KOREA & INDIA<br />
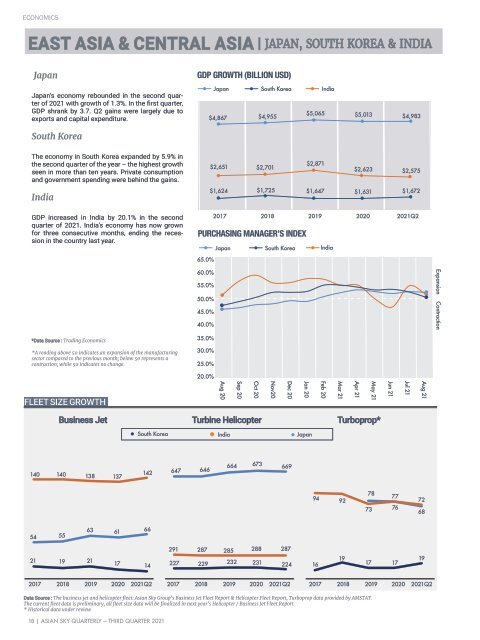
Japan<br />
GDP GROWTH (BILLION USD)<br />
Japan’s economy rebounded in the second quarter<br />
of <strong>2021</strong> with growth of 1.3%. In the first quarter,<br />
GDP shrank by 3.7. Q2 gains were largely due to<br />
exports and capital expenditure.<br />
Japan<br />
$4,867<br />
South Korea<br />
$4,955<br />
$5,065<br />
India<br />
$5,013<br />
$4,983<br />
South Korea<br />
The economy in South Korea expanded by 5.9% in<br />
the second quarter of the year – the highest growth<br />
seen in more than ten years. Private consumption<br />
and government spending were behind the gains.<br />
$2,651<br />
$2,701<br />
$2,871<br />
$2,623<br />
$2,575<br />
India<br />
$1,624<br />
$1,725<br />
$1,647<br />
$1,631<br />
$1,672<br />
GDP increased in India by 20.1% in the second<br />
quarter of <strong>2021</strong>. India’s economy has now grown<br />
for three consecutive months, ending the recession<br />
in the country last year.<br />
2017 2018 2019 2020 <strong>2021</strong>Q2<br />
PURCHASING MANAGER’S INDEX<br />
Japan<br />
South Korea India<br />
65.0%<br />
60.0%<br />
55.0%<br />
50.0%<br />
45.0%<br />
40.0%<br />
Expansion Contraction<br />
*Data Source : Trading Economics<br />
35.0%<br />
*A reading above 50 indicates an expansion of the manufacturing<br />
sector compared to the previous month; below 50 represents a<br />
contraction; while 50 indicates no change.<br />
30.0%<br />
25.0%<br />
20.0%<br />
FLEET SIZE GROWTH<br />
Aug 20<br />
Sep 20<br />
Oct 20<br />
Nov20<br />
Dec 20<br />
Jan 20<br />
Feb 20<br />
Mar 21<br />
Apr 21<br />
May 21<br />
Jun 21<br />
Jul 21<br />
Aug 21<br />
Business Jet<br />
Turbine Helicopter<br />
Turboprop*<br />
South Korea<br />
India<br />
Japan<br />
140<br />
140<br />
138 137<br />
142<br />
647<br />
646<br />
664 673<br />
669<br />
94<br />
92<br />
78<br />
73<br />
77<br />
76<br />
72<br />
68<br />
54<br />
55<br />
63 61<br />
66<br />
21<br />
19<br />
21<br />
291 287 285 288<br />
17 14<br />
227 229 232 231<br />
287<br />
224<br />
16<br />
19<br />
17<br />
17<br />
19<br />
2017 2018 2019 2020 <strong>2021</strong>Q2 2017 2018 2019 2020 <strong>2021</strong>Q2 2017 2018 2019 2020 <strong>2021</strong>Q2<br />
Data Source : The business jet and helicopter fleet: <strong>Asian</strong> <strong>Sky</strong> Group’s Business Jet Fleet Report & Helicopter Fleet Report, Turboprop data provided by AMSTAT.<br />
The current fleet data is preliminary, all fleet size data will be finalized in next year’s Helicopter / Business Jet Fleet Report.<br />
* Historical data under review<br />
18 | ASIAN SKY QUARTERLY — THIRD QUARTER <strong>2021</strong>