Insurance and Interconnectedness in the Financial Services Industry
Insurance and Interconnectedness in the Financial Services Industry
Insurance and Interconnectedness in the Financial Services Industry
You also want an ePaper? Increase the reach of your titles
YUMPU automatically turns print PDFs into web optimized ePapers that Google loves.
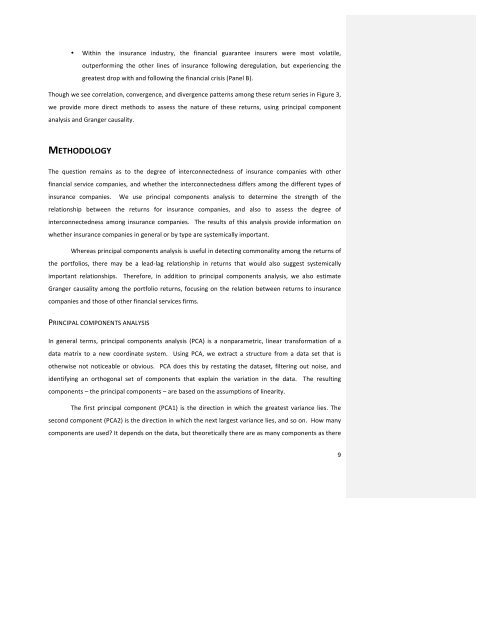
• With<strong>in</strong> <strong>the</strong> <strong>in</strong>surance <strong>in</strong>dustry, <strong>the</strong> f<strong>in</strong>ancial guarantee <strong>in</strong>surers were most volatile,<br />
outperform<strong>in</strong>g <strong>the</strong> o<strong>the</strong>r l<strong>in</strong>es of <strong>in</strong>surance follow<strong>in</strong>g deregulation, but experienc<strong>in</strong>g <strong>the</strong><br />
greatest drop with <strong>and</strong> follow<strong>in</strong>g <strong>the</strong> f<strong>in</strong>ancial crisis (Panel B).<br />
Though we see correlation, convergence, <strong>and</strong> divergence patterns among <strong>the</strong>se return series <strong>in</strong> Figure 3,<br />
we provide more direct methods to assess <strong>the</strong> nature of <strong>the</strong>se returns, us<strong>in</strong>g pr<strong>in</strong>cipal component<br />
analysis <strong>and</strong> Granger causality.<br />
METHODOLOGY<br />
The question rema<strong>in</strong>s as to <strong>the</strong> degree of <strong>in</strong>terconnectedness of <strong>in</strong>surance companies with o<strong>the</strong>r<br />
f<strong>in</strong>ancial service companies, <strong>and</strong> whe<strong>the</strong>r <strong>the</strong> <strong>in</strong>terconnectedness differs among <strong>the</strong> different types of<br />
<strong>in</strong>surance companies. We use pr<strong>in</strong>cipal components analysis to determ<strong>in</strong>e <strong>the</strong> strength of <strong>the</strong><br />
relationship between <strong>the</strong> returns for <strong>in</strong>surance companies, <strong>and</strong> also to assess <strong>the</strong> degree of<br />
<strong>in</strong>terconnectedness among <strong>in</strong>surance companies. The results of this analysis provide <strong>in</strong>formation on<br />
whe<strong>the</strong>r <strong>in</strong>surance companies <strong>in</strong> general or by type are systemically important.<br />
Whereas pr<strong>in</strong>cipal components analysis is useful <strong>in</strong> detect<strong>in</strong>g commonality among <strong>the</strong> returns of<br />
<strong>the</strong> portfolios, <strong>the</strong>re may be a lead-‐lag relationship <strong>in</strong> returns that would also suggest systemically<br />
important relationships. Therefore, <strong>in</strong> addition to pr<strong>in</strong>cipal components analysis, we also estimate<br />
Granger causality among <strong>the</strong> portfolio returns, focus<strong>in</strong>g on <strong>the</strong> relation between returns to <strong>in</strong>surance<br />
companies <strong>and</strong> those of o<strong>the</strong>r f<strong>in</strong>ancial services firms.<br />
PRINCIPAL COMPONENTS ANALYSIS<br />
In general terms, pr<strong>in</strong>cipal components analysis (PCA) is a nonparametric, l<strong>in</strong>ear transformation of a<br />
data matrix to a new coord<strong>in</strong>ate system. Us<strong>in</strong>g PCA, we extract a structure from a data set that is<br />
o<strong>the</strong>rwise not noticeable or obvious. PCA does this by restat<strong>in</strong>g <strong>the</strong> dataset, filter<strong>in</strong>g out noise, <strong>and</strong><br />
identify<strong>in</strong>g an orthogonal set of components that expla<strong>in</strong> <strong>the</strong> variation <strong>in</strong> <strong>the</strong> data. The result<strong>in</strong>g<br />
components – <strong>the</strong> pr<strong>in</strong>cipal components – are based on <strong>the</strong> assumptions of l<strong>in</strong>earity.<br />
The first pr<strong>in</strong>cipal component (PCA1) is <strong>the</strong> direction <strong>in</strong> which <strong>the</strong> greatest variance lies. The<br />
second component (PCA2) is <strong>the</strong> direction <strong>in</strong> which <strong>the</strong> next largest variance lies, <strong>and</strong> so on. How many<br />
components are used? It depends on <strong>the</strong> data, but <strong>the</strong>oretically <strong>the</strong>re are as many components as <strong>the</strong>re<br />
9


