Insurance and Interconnectedness in the Financial Services Industry
Insurance and Interconnectedness in the Financial Services Industry
Insurance and Interconnectedness in the Financial Services Industry

You also want an ePaper? Increase the reach of your titles
YUMPU automatically turns print PDFs into web optimized ePapers that Google loves.
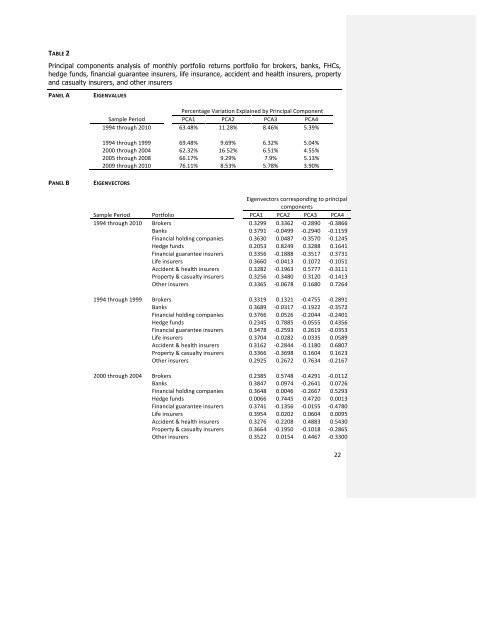
TABLE 2<br />
Pr<strong>in</strong>cipal components analysis of monthly portfolio returns portfolio for brokers, banks, FHCs,<br />
hedge funds, f<strong>in</strong>ancial guarantee <strong>in</strong>surers, life <strong>in</strong>surance, accident <strong>and</strong> health <strong>in</strong>surers, property<br />
<strong>and</strong> casualty <strong>in</strong>surers, <strong>and</strong> o<strong>the</strong>r <strong>in</strong>surers<br />
PANEL A EIGENVALUES<br />
PANEL B EIGENVECTORS<br />
Percentage Variation Expla<strong>in</strong>ed by Pr<strong>in</strong>cipal Component<br />
Sample Period PCA1 PCA2 PCA3 PCA4<br />
1994 through 2010 63.48% 11.28% 8.46% 5.39%<br />
1994 through 1999 69.48% 9.69% 6.32% 5.04%<br />
2000 through 2004 62.32% 16.52% 6.51% 4.55%<br />
2005 through 2008 66.17% 9.29% 7.9% 5.13%<br />
2009 through 2010 76.11% 8.53% 5.78% 3.90%<br />
Eigenvectors correspond<strong>in</strong>g to pr<strong>in</strong>cipal<br />
components<br />
Sample Period Portfolio PCA1 PCA2 PCA3 PCA4<br />
1994 through 2010 Brokers 0.3299 0.3362 -‐0.2890 -‐0.3866<br />
Banks 0.3791 -‐0.0499 -‐0.2940 -‐0.1159<br />
F<strong>in</strong>ancial hold<strong>in</strong>g companies 0.3630 0.0487 -‐0.3570 -‐0.1245<br />
Hedge funds 0.2053 0.8249 0.3288 0.1641<br />
F<strong>in</strong>ancial guarantee <strong>in</strong>surers 0.3356 -‐0.1888 -‐0.3517 0.3731<br />
Life <strong>in</strong>surers 0.3660 -‐0.0413 0.1072 -‐0.1051<br />
Accident & health <strong>in</strong>surers 0.3282 -‐0.1963 0.5777 -‐0.3111<br />
Property & casualty <strong>in</strong>surers 0.3256 -‐0.3480 0.3120 -‐0.1413<br />
O<strong>the</strong>r <strong>in</strong>surers 0.3365 -‐0.0678 0.1680 0.7264<br />
1994 through 1999 Brokers 0.3319 0.1321 -‐0.4755 -‐0.2891<br />
Banks 0.3689 -‐0.0317 -‐0.1922 -‐0.3572<br />
F<strong>in</strong>ancial hold<strong>in</strong>g companies 0.3766 0.0526 -‐0.2044 -‐0.2401<br />
Hedge funds 0.2345 0.7885 -‐0.0555 0.4356<br />
F<strong>in</strong>ancial guarantee <strong>in</strong>surers 0.3478 -‐0.2593 0.2619 -‐0.0353<br />
Life <strong>in</strong>surers 0.3704 -‐0.0282 -‐0.0335 0.0589<br />
Accident & health <strong>in</strong>surers 0.3162 -‐0.2844 -‐0.1180 0.6807<br />
Property & casualty <strong>in</strong>surers 0.3366 -‐0.3698 0.1604 0.1623<br />
O<strong>the</strong>r <strong>in</strong>surers 0.2925 0.2672 0.7634 -‐0.2167<br />
2000 through 2004 Brokers 0.2385 0.5748 -‐0.4291 -‐0.0112<br />
Banks 0.3847 0.0974 -‐0.2641 0.0726<br />
F<strong>in</strong>ancial hold<strong>in</strong>g companies 0.3648 0.0046 -‐0.2667 0.5293<br />
Hedge funds 0.0066 0.7445 0.4720 0.0013<br />
F<strong>in</strong>ancial guarantee <strong>in</strong>surers 0.3741 -‐0.1356 -‐0.0155 -‐0.4780<br />
Life <strong>in</strong>surers 0.3954 0.0202 0.0604 0.0095<br />
Accident & health <strong>in</strong>surers 0.3276 -‐0.2208 0.4883 0.5430<br />
Property & casualty <strong>in</strong>surers 0.3664 -‐0.1950 -‐0.1018 -‐0.2865<br />
O<strong>the</strong>r <strong>in</strong>surers 0.3522 0.0154 0.4467 -‐0.3300<br />
22