Insurance and Interconnectedness in the Financial Services Industry
Insurance and Interconnectedness in the Financial Services Industry
Insurance and Interconnectedness in the Financial Services Industry

You also want an ePaper? Increase the reach of your titles
YUMPU automatically turns print PDFs into web optimized ePapers that Google loves.
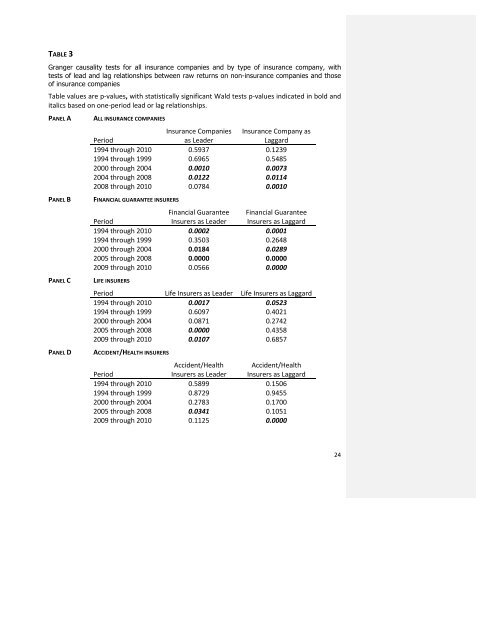
TABLE 3<br />
Granger causality tests for all <strong>in</strong>surance companies <strong>and</strong> by type of <strong>in</strong>surance company, with<br />
tests of lead <strong>and</strong> lag relationships between raw returns on non-<strong>in</strong>surance companies <strong>and</strong> those<br />
of <strong>in</strong>surance companies<br />
Table values are p-‐values, with statistically significant Wald tests p-‐values <strong>in</strong>dicated <strong>in</strong> bold <strong>and</strong><br />
italics based on one-‐period lead or lag relationships.<br />
PANEL A ALL INSURANCE COMPANIES<br />
<strong>Insurance</strong> Companies <strong>Insurance</strong> Company as<br />
Period<br />
as Leader<br />
Laggard<br />
1994 through 2010 0.5937 0.1239<br />
1994 through 1999 0.6965 0.5485<br />
2000 through 2004 0.0010 0.0073<br />
2004 through 2008 0.0122 0.0114<br />
2008 through 2010 0.0784 0.0010<br />
PANEL B FINANCIAL GUARANTEE INSURERS<br />
PANEL C LIFE INSURERS<br />
F<strong>in</strong>ancial Guarantee F<strong>in</strong>ancial Guarantee<br />
Period<br />
Insurers as Leader Insurers as Laggard<br />
1994 through 2010 0.0002 0.0001<br />
1994 through 1999 0.3503 0.2648<br />
2000 through 2004 0.0184 0.0289<br />
2005 through 2008 0.0000 0.0000<br />
2009 through 2010 0.0566 0.0000<br />
Period Life Insurers as Leader Life Insurers as Laggard<br />
1994 through 2010 0.0017 0.0523<br />
1994 through 1999 0.6097 0.4021<br />
2000 through 2004 0.0871 0.2742<br />
2005 through 2008 0.0000 0.4358<br />
2009 through 2010 0.0107 0.6857<br />
PANEL D ACCIDENT/HEALTH INSURERS<br />
Accident/Health Accident/Health<br />
Period<br />
Insurers as Leader Insurers as Laggard<br />
1994 through 2010 0.5899 0.1506<br />
1994 through 1999 0.8729 0.9455<br />
2000 through 2004 0.2783 0.1700<br />
2005 through 2008 0.0341 0.1051<br />
2009 through 2010 0.1125 0.0000<br />
24