Insurance and Interconnectedness in the Financial Services Industry
Insurance and Interconnectedness in the Financial Services Industry
Insurance and Interconnectedness in the Financial Services Industry

Create successful ePaper yourself
Turn your PDF publications into a flip-book with our unique Google optimized e-Paper software.
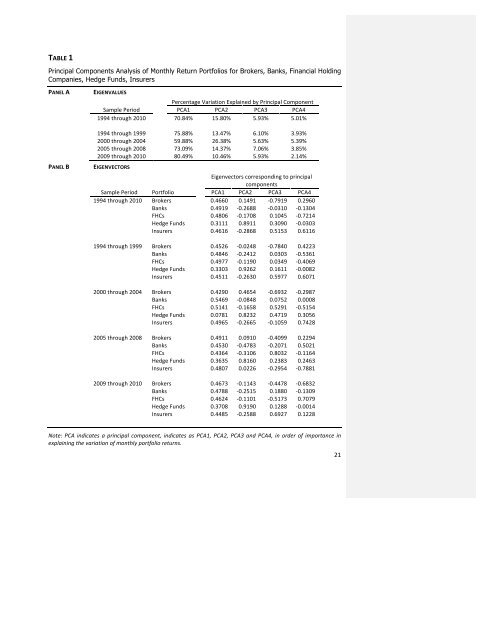
TABLE 1<br />
Pr<strong>in</strong>cipal Components Analysis of Monthly Return Portfolios for Brokers, Banks, F<strong>in</strong>ancial Hold<strong>in</strong>g<br />
Companies, Hedge Funds, Insurers<br />
PANEL A EIGENVALUES<br />
PANEL B EIGENVECTORS<br />
Percentage Variation Expla<strong>in</strong>ed by Pr<strong>in</strong>cipal Component<br />
Sample Period PCA1 PCA2 PCA3 PCA4<br />
1994 through 2010 70.84% 15.80% 5.93% 5.01%<br />
1994 through 1999 75.88% 13.47% 6.10% 3.93%<br />
2000 through 2004 59.88% 26.38% 5.63% 5.39%<br />
2005 through 2008 73.09% 14.37% 7.06% 3.85%<br />
2009 through 2010 80.49% 10.46% 5.93% 2.14%<br />
Eigenvectors correspond<strong>in</strong>g to pr<strong>in</strong>cipal<br />
components<br />
Sample Period Portfolio PCA1 PCA2 PCA3 PCA4<br />
1994 through 2010 Brokers 0.4660 0.1491 -‐0.7919 0.2960<br />
Banks 0.4919 -‐0.2688 -‐0.0310 -‐0.1304<br />
FHCs 0.4806 -‐0.1708 0.1045 -‐0.7214<br />
Hedge Funds 0.3111 0.8911 0.3090 -‐0.0303<br />
Insurers 0.4616 -‐0.2868 0.5153 0.6116<br />
1994 through 1999 Brokers 0.4526 -‐0.0248 -‐0.7840 0.4223<br />
Banks 0.4846 -‐0.2412 0.0303 -‐0.5361<br />
FHCs 0.4977 -‐0.1190 0.0349 -‐0.4069<br />
Hedge Funds 0.3303 0.9262 0.1611 -‐0.0082<br />
Insurers 0.4511 -‐0.2630 0.5977 0.6071<br />
2000 through 2004 Brokers 0.4290 0.4654 -‐0.6932 -‐0.2987<br />
Banks 0.5469 -‐0.0848 0.0752 0.0008<br />
FHCs 0.5141 -‐0.1658 0.5291 -‐0.5154<br />
Hedge Funds 0.0781 0.8232 0.4719 0.3056<br />
Insurers 0.4965 -‐0.2665 -‐0.1059 0.7428<br />
2005 through 2008 Brokers 0.4911 0.0910 -‐0.4099 0.2294<br />
Banks 0.4530 -‐0.4783 -‐0.2071 0.5021<br />
FHCs 0.4364 -‐0.3106 0.8032 -‐0.1164<br />
Hedge Funds 0.3635 0.8160 0.2383 0.2463<br />
Insurers 0.4807 0.0226 -‐0.2954 -‐0.7881<br />
2009 through 2010 Brokers 0.4673 -‐0.1143 -‐0.4478 -‐0.6832<br />
Banks 0.4788 -‐0.2515 0.1880 -‐0.1309<br />
FHCs 0.4624 -‐0.1101 -‐0.5173 0.7079<br />
Hedge Funds 0.3708 0.9190 0.1288 -‐0.0014<br />
Insurers 0.4485 -‐0.2588 0.6927 0.1228<br />
Note: PCA <strong>in</strong>dicates a pr<strong>in</strong>cipal component, <strong>in</strong>dicates as PCA1, PCA2, PCA3 <strong>and</strong> PCA4, <strong>in</strong> order of importance <strong>in</strong><br />
expla<strong>in</strong><strong>in</strong>g <strong>the</strong> variation of monthly portfolio returns.<br />
21