Insurance and Interconnectedness in the Financial Services Industry
Insurance and Interconnectedness in the Financial Services Industry
Insurance and Interconnectedness in the Financial Services Industry
You also want an ePaper? Increase the reach of your titles
YUMPU automatically turns print PDFs into web optimized ePapers that Google loves.
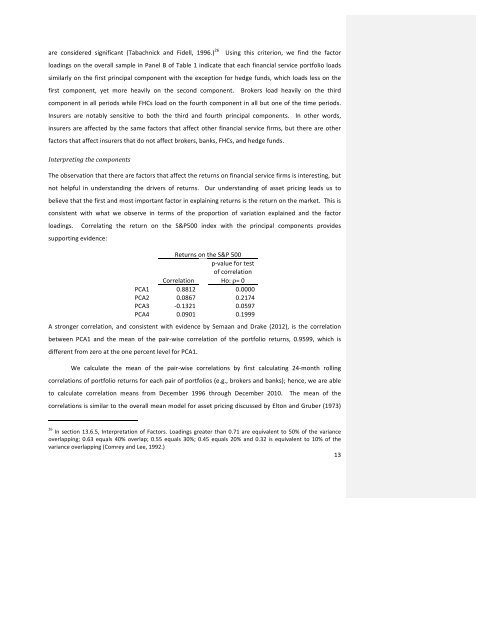
are considered significant (Tabachnick <strong>and</strong> Fidell, 1996.) 26 Us<strong>in</strong>g this criterion, we f<strong>in</strong>d <strong>the</strong> factor<br />
load<strong>in</strong>gs on <strong>the</strong> overall sample <strong>in</strong> Panel B of Table 1 <strong>in</strong>dicate that each f<strong>in</strong>ancial service portfolio loads<br />
similarly on <strong>the</strong> first pr<strong>in</strong>cipal component with <strong>the</strong> exception for hedge funds, which loads less on <strong>the</strong><br />
first component, yet more heavily on <strong>the</strong> second component. Brokers load heavily on <strong>the</strong> third<br />
component <strong>in</strong> all periods while FHCs load on <strong>the</strong> fourth component <strong>in</strong> all but one of <strong>the</strong> time periods.<br />
Insurers are notably sensitive to both <strong>the</strong> third <strong>and</strong> fourth pr<strong>in</strong>cipal components. In o<strong>the</strong>r words,<br />
<strong>in</strong>surers are affected by <strong>the</strong> same factors that affect o<strong>the</strong>r f<strong>in</strong>ancial service firms, but <strong>the</strong>re are o<strong>the</strong>r<br />
factors that affect <strong>in</strong>surers that do not affect brokers, banks, FHCs, <strong>and</strong> hedge funds.<br />
Interpret<strong>in</strong>g <strong>the</strong> components<br />
The observation that <strong>the</strong>re are factors that affect <strong>the</strong> returns on f<strong>in</strong>ancial service firms is <strong>in</strong>terest<strong>in</strong>g, but<br />
not helpful <strong>in</strong> underst<strong>and</strong><strong>in</strong>g <strong>the</strong> drivers of returns. Our underst<strong>and</strong><strong>in</strong>g of asset pric<strong>in</strong>g leads us to<br />
believe that <strong>the</strong> first <strong>and</strong> most important factor <strong>in</strong> expla<strong>in</strong><strong>in</strong>g returns is <strong>the</strong> return on <strong>the</strong> market. This is<br />
consistent with what we observe <strong>in</strong> terms of <strong>the</strong> proportion of variation expla<strong>in</strong>ed <strong>and</strong> <strong>the</strong> factor<br />
load<strong>in</strong>gs. Correlat<strong>in</strong>g <strong>the</strong> return on <strong>the</strong> S&P500 <strong>in</strong>dex with <strong>the</strong> pr<strong>in</strong>cipal components provides<br />
support<strong>in</strong>g evidence:<br />
Returns on <strong>the</strong> S&P 500<br />
p-‐value for test<br />
of correlation<br />
Correlation Ho: ρ= 0<br />
PCA1 0.8812 0.0000<br />
PCA2 0.0867 0.2174<br />
PCA3 -‐0.1321 0.0597<br />
PCA4 0.0901 0.1999<br />
A stronger correlation, <strong>and</strong> consistent with evidence by Semaan <strong>and</strong> Drake (2012), is <strong>the</strong> correlation<br />
between PCA1 <strong>and</strong> <strong>the</strong> mean of <strong>the</strong> pair-‐wise correlation of <strong>the</strong> portfolio returns, 0.9599, which is<br />
different from zero at <strong>the</strong> one percent level for PCA1.<br />
We calculate <strong>the</strong> mean of <strong>the</strong> pair-‐wise correlations by first calculat<strong>in</strong>g 24-‐month roll<strong>in</strong>g<br />
correlations of portfolio returns for each pair of portfolios (e.g., brokers <strong>and</strong> banks); hence, we are able<br />
to calculate correlation means from December 1996 through December 2010. The mean of <strong>the</strong><br />
correlations is similar to <strong>the</strong> overall mean model for asset pric<strong>in</strong>g discussed by Elton <strong>and</strong> Gruber (1973)<br />
26<br />
In section 13.6.5, Interpretation of Factors. Load<strong>in</strong>gs greater than 0.71 are equivalent to 50% of <strong>the</strong> variance<br />
overlapp<strong>in</strong>g; 0.63 equals 40% overlap; 0.55 equals 30%; 0.45 equals 20% <strong>and</strong> 0.32 is equivalent to 10% of <strong>the</strong><br />
variance overlapp<strong>in</strong>g (Comrey <strong>and</strong> Lee, 1992.)<br />
13


