Continuity of Earth Observation Data for Australia: Research ... - csiro
Continuity of Earth Observation Data for Australia: Research ... - csiro
Continuity of Earth Observation Data for Australia: Research ... - csiro

Create successful ePaper yourself
Turn your PDF publications into a flip-book with our unique Google optimized e-Paper software.
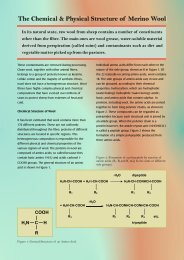
EO <strong>Data</strong> Type<br />
Table 3-5 Project Annual Budget <strong>for</strong> ‘Essential’ Satellite EO <strong>Data</strong> Types<br />
up to $100,000<br />
Entries indicate the number <strong>of</strong> projects<br />
$100,000 to<br />
$500,000<br />
Annual Budget<br />
36 <strong>Continuity</strong> <strong>of</strong> <strong>Earth</strong> <strong>Observation</strong> <strong>Data</strong> <strong>for</strong> <strong>Australia</strong>: R&D • January 2012<br />
$500,000 to<br />
$1,000,000<br />
$1,000,000+<br />
Atmospheric Chemistry 0 0 0 2 2<br />
Atmospheric<br />
Temperature and<br />
Humidity Sounding<br />
Cloud Pr<strong>of</strong>ile and Rain<br />
Radar<br />
<strong>Earth</strong> Radiation Budget<br />
Radiometry<br />
Gravity, Magnetic Field<br />
and Geodynamic<br />
TOTAL<br />
0 1 0 2 3<br />
0 1 0 2 3<br />
0 1 0 1 2<br />
1 2 0 0 3<br />
Hyperspectral Imagery 0 1 2 1 4<br />
Passive Microwave<br />
Radiometry<br />
0 4 0 3 7<br />
Lidar 0 3 0 2 5<br />
Multiple Direction/<br />
Polarisation<br />
0 1 0 2 3<br />
Ocean Colour 0 1 3 2 6<br />
Optical – High<br />
Resolution<br />
Optical – Low<br />
Resolution<br />
Optical – Medium<br />
Resolution<br />
3 4 2 1 10<br />
5 9 5 8 27<br />
4 10 4 5 23<br />
Radar Altimetry 1 1 0 6 8<br />
Synthetic Aperture<br />
Radar – C band<br />
Synthetic Aperture<br />
Radar – L band<br />
Synthetic Aperture<br />
Radar – X band<br />
1 0 0 1 2<br />
2 1 0 2 5<br />
0 0 1 1 2<br />
Scatterometry 0 0 0 2 2<br />
TOTAL 17 40 17 43 117<br />
Similarly, an analysis <strong>of</strong> data usage in terms <strong>of</strong> the four types <strong>of</strong> research establishment is presented in Table<br />
3-6. The results in Table 3-6 suggest that most Federal and State agencies rely on optical sensors to support<br />
their EO-related R&D activities, whereas research and academic institutions use a wider range <strong>of</strong> data types.