Continuity of Earth Observation Data for Australia: Research ... - csiro
Continuity of Earth Observation Data for Australia: Research ... - csiro
Continuity of Earth Observation Data for Australia: Research ... - csiro

You also want an ePaper? Increase the reach of your titles
YUMPU automatically turns print PDFs into web optimized ePapers that Google loves.
<strong>Continuity</strong> <strong>of</strong> <strong>Earth</strong> <strong>Observation</strong> <strong>Data</strong> <strong>for</strong> <strong>Australia</strong>:<br />
<strong>Research</strong> and Development Dependencies to 2020<br />
January 2012
Enquiries<br />
Enquiries should be addressed to:<br />
Dr Kimberley Clayfield<br />
Executive Manager | Space Sciences and Technology<br />
CSIRO Astronomy and Space Science<br />
Email Kimberley.Clayfield@<strong>csiro</strong>.au<br />
Study Team<br />
Dr A. Alexander Held and Dr Kimberley C. Clayfield, CSIRO<br />
Stephen Ward and George Dyke, Symbios Communications Pty Ltd<br />
Barbara Harrison<br />
Acknowledgments<br />
CSIRO acknowledges the support provided by the Space Policy Unit, Department <strong>of</strong> Industry, Innovation,<br />
Science, <strong>Research</strong> and Tertiary Education, in carrying out this study.<br />
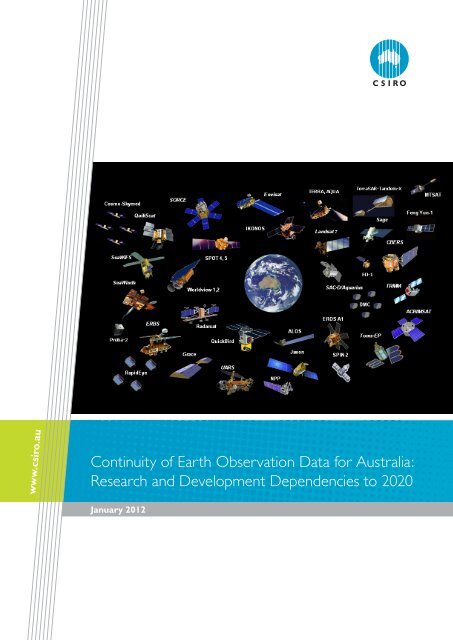
Cover Image<br />
Depiction <strong>of</strong> the various active geostationary and low <strong>Earth</strong> orbit <strong>Earth</strong> observation satellites operating<br />
over <strong>Australia</strong>. Source: Adapted with permission from a graphic by the secretariat <strong>of</strong> the Group on <strong>Earth</strong><br />
<strong>Observation</strong>s (GEO) and from various member agencies <strong>of</strong> the Committee on <strong>Earth</strong> <strong>Observation</strong> Satellites<br />
(CEOS).<br />
Copyright and Disclaimer<br />
© Commonwealth Scientific and Industrial <strong>Research</strong> Organisation 2012<br />
To the extent permitted by law, all rights are reserved and no part <strong>of</strong> this publication covered by copyright<br />
may be reproduced or copied in any <strong>for</strong>m or by any means except with the written permission <strong>of</strong> CSIRO.<br />
Print ISBN 978 0 643 10796 0<br />
PDF ISBN 978 0 643 10797 7<br />
Published by CSIRO Astronomy and Space Science, Canberra, <strong>Australia</strong>, 2012.<br />
Important Disclaimer<br />
CSIRO advises that the in<strong>for</strong>mation contained in this publication comprises general statements based on<br />
scientific research. The reader is advised and needs to be aware that such in<strong>for</strong>mation may be incomplete<br />
or unable to be used in any specific situation. No reliance or actions must there<strong>for</strong>e be made on that<br />
in<strong>for</strong>mation without seeking prior expert pr<strong>of</strong>essional, scientific and technical advice. To the extent<br />
permitted by law, CSIRO (including its employees and consultants) excludes all liability to any person <strong>for</strong> any<br />
consequences, including but not limited to all losses, damages, costs, expenses and any other compensation,<br />
arising directly or indirectly from using this publication (in part or in whole) and any in<strong>for</strong>mation or material<br />
contained in it.
Contents<br />
Key Findings ........................................................................................................................................................................1<br />
Key Recommendations ....................................................................................................................................................2<br />
Executive Summary ..........................................................................................................................................................5<br />
Scope ..........................................................................................................................................................................................................5<br />
Survey Population ...................................................................................................................................................................................5<br />
Main Results ................................................................................................................................................................................................5<br />
<strong>Data</strong> <strong>Continuity</strong> Risks ............................................................................................................................................................................6<br />
Critical Relationships ..............................................................................................................................................................................7<br />
Infrastructure Implications ..................................................................................................................................................................7<br />
1 Introduction...........................................................................................................................................................9<br />
1.1 <strong>Earth</strong> <strong>Observation</strong> ................................................................................................................................................................9<br />
1.2 Purpose .........................................................................................................................................................................................9<br />
1.3 Objectives ................................................................................................................................................................................. 10<br />
1.4 Related Reports ................................................................................................................................................................... 10<br />
1.5 Report Annex ......................................................................................................................................................................... 12<br />
2 Context <strong>of</strong> CEODA-R&D Survey ................................................................................................................. 13<br />
2.1 Survey Structure ................................................................................................................................................................... 13<br />
2.1.1 Scope ...................................................................................................................................................................... 13<br />
2.1.2 Approach .............................................................................................................................................................. 14<br />
2.1.3 Specific Questions ........................................................................................................................................... 15<br />
2.2 Survey Population ................................................................................................................................................................ 18<br />
2.3 Benefits <strong>of</strong> R&D .................................................................................................................................................................... 21<br />
2.3.1 Societal Benefit Areas .................................................................................................................................. 21<br />
2.3.2 National Significance ...................................................................................................................................... 22<br />
2.3.3 Linkages to Operational Programs ...................................................................................................... 24<br />
2.3.4 Operational Outcomes ................................................................................................................................ 25<br />
2.3.5 Collaboration .................................................................................................................................................... 28<br />
2.4 Major Projects ........................................................................................................................................................................ 29<br />
2.4.1 AusCover TERN ............................................................................................................................................... 30<br />
2.4.2 BLUELink .............................................................................................................................................................. 30<br />
2.4.3 IMOS ....................................................................................................................................................................... 31<br />
2.4.4 Joint Remote Sensing <strong>Research</strong> Centre .............................................................................................. 31<br />
2.4.5 Numerical Weather Prediction ................................................................................................................ 31<br />
2.4.6 Other Meteorological <strong>Research</strong> .............................................................................................................. 31<br />
2.5 Summary ................................................................................................................................................................................... 32<br />
<strong>Continuity</strong> <strong>of</strong> <strong>Earth</strong> <strong>Observation</strong> <strong>Data</strong> <strong>for</strong> <strong>Australia</strong>: R&D • January 2012 i
3 EO <strong>Data</strong> Requirements: Current ................................................................................................................... 33<br />
3.1 Usage ......................................................................................................................................................................................... 33<br />
3.1.1 All Projects ........................................................................................................................................................... 33<br />
3.1.2 Major Projects .................................................................................................................................................... 37<br />
3.2 Supply ........................................................................................................................................................................................ 39<br />
3.3 Priority <strong>Data</strong> Types ............................................................................................................................................................... 41<br />
3.3.1 Low Resolution Optical (>80m) ............................................................................................................ 43<br />
3.3.2 Medium Resolution Optical (10–80m) ............................................................................................... 47<br />
3.3.3 High Resolution Optical (
5 EO <strong>Data</strong> Availability .......................................................................................................................................... 77<br />
5.1 Global supply context ........................................................................................................................................................ 77<br />
5.1.1 Overview ............................................................................................................................................................ 77<br />
5.1.2 Government versus Commercial .......................................................................................................... 78<br />
5.1.3 <strong>Research</strong> versus Operational .................................................................................................................. 78<br />
5.1.4 Global Trends and <strong>Data</strong> Policies ............................................................................................................. 79<br />
5.2 Priority <strong>Data</strong> Type Scenarios .......................................................................................................................................... 82<br />
5.2.1 Low Resolution Optical (>80m) ............................................................................................................ 82<br />
Low Resolution Optical <strong>Data</strong> Gap Risk Assessment: MODIS ............................................... 84<br />
5.2.2 Medium Resolution Optical (10–80m) ............................................................................................. 85<br />
Medium Resolution Optical <strong>Data</strong> Gap Risk Assessment: Landsat-5 TM .......................... 87<br />
5.2.3 High Resolution Optical (
List <strong>of</strong> Figures<br />
Figure 2-1 Scope <strong>of</strong> Survey ............................................................................................................................................................................ 14<br />
Figure 2-2 Surveyed Projects by <strong>Research</strong> Establishment Type .................................................................................................. 19<br />
Figure 2-3 Annual Project Budgets ............................................................................................................................................................. 20<br />
Figure 2-4 Average Annual Project Staffing ........................................................................................................................................... 20<br />
Figure 2-5 Project Duration ........................................................................................................................................................................... 21<br />
Figure 3-1 Usage <strong>of</strong> Priority <strong>Data</strong> Types by Surveyed Projects .................................................................................................. 42<br />
List <strong>of</strong> Tables<br />
Table ES-1 Priority <strong>Data</strong> Types: Satellite 5-Year Supply <strong>Continuity</strong> Risk and Key Providers ..........................................8<br />
Table 2-1 Survey Approach ............................................................................................................................................................................ 15<br />
Table 2-2 Survey Instrument Types............................................................................................................................................................. 16<br />
Table 2-3 Academic Institutions Surveyed ............................................................................................................................................. 18<br />
Table 2-4 <strong>Research</strong> Organisations Surveyed ........................................................................................................................................ 18<br />
Table 2-5 Federal Agencies Surveyed ....................................................................................................................................................... 19<br />
Table 2-6 State Agencies Surveyed ............................................................................................................................................................ 19<br />
Table 2-7 Societal Benefit Area (SBA) Definitions ........................................................................................................................... 22<br />
Table 2-8 National Benefits and Significance <strong>of</strong> Surveyed Projects ......................................................................................... 23<br />
Table 2-9 Operational Programs Supported by Multiple Surveyed Projects .................................................................... 25<br />
Table 2-10 Future Operational Outcomes from Surveyed Projects ...................................................................................... 26<br />
Table 2-11 Project Collaboration ................................................................................................................................................................ 28<br />
Table 2-12 International Space Agency Connections to Surveyed Projects....................................................................... 29<br />
Table 2-13 Large and Significant Projects in Survey ......................................................................................................................... 30<br />
Table 3-1 EO <strong>Data</strong> Importance ................................................................................................................................................................... 33<br />
Table 3-2 Satellite EO <strong>Data</strong> Importance ................................................................................................................................................. 34<br />
Table 3-3 Airborne EO <strong>Data</strong> Importance .............................................................................................................................................. 35<br />
Table 3-4 In Situ and Other EO <strong>Data</strong> Importance ............................................................................................................................ 35<br />
Table 3-5 Project Annual Budget <strong>for</strong> ‘Essential’ Satellite EO <strong>Data</strong> Types ............................................................................... 36<br />
Table 3-6 <strong>Research</strong> Establishments Using ‘Essential’ Satellite EO <strong>Data</strong> Types ..................................................................... 37<br />
Table 3-7 Major Projects using ‘Essential’ <strong>Data</strong> Types ....................................................................................................................... 38<br />
Table 3-8 Supply Sources <strong>for</strong> ‘Essential’ Satellite EO <strong>Data</strong> Types ............................................................................................... 39<br />
Table 3-9 Current <strong>Data</strong> Volumes <strong>for</strong> Selected Projects ................................................................................................................. 41<br />
Table 3-10 Predominant Requirements <strong>of</strong> Priority <strong>Data</strong> Types.................................................................................................. 42<br />
iv <strong>Continuity</strong> <strong>of</strong> <strong>Earth</strong> <strong>Observation</strong> <strong>Data</strong> <strong>for</strong> <strong>Australia</strong>: R&D • January 2012
Table 3-11 Projects Dependent on Low Resolution Optical <strong>Data</strong> .......................................................................................... 44<br />
Table 3-12 Usage <strong>of</strong> Low Resolution Optical <strong>Data</strong> .......................................................................................................................... 44<br />
Table 3-13 Projects Dependent on Medium Resolution Optical <strong>Data</strong> ................................................................................. 47<br />
Table 3-14 Usage <strong>of</strong> Medium Resolution Optical <strong>Data</strong> ................................................................................................................. 48<br />
Table 3-15 Projects Dependent on High Resolution Optical <strong>Data</strong> ......................................................................................... 50<br />
Table 3-16 Usage <strong>of</strong> High Resolution Optical <strong>Data</strong> ......................................................................................................................... 50<br />
Table 3-17 Characteristics <strong>of</strong> SAR Frequencies .................................................................................................................................. 52<br />
Table 3-18 Projects Dependent on SAR <strong>Data</strong> .................................................................................................................................... 52<br />
Table 3-19 Usage <strong>of</strong> SAR <strong>Data</strong> ..................................................................................................................................................................... 53<br />
Table 3-20 Projects Dependent on Passive Microwave Radiometry ...................................................................................... 54<br />
Table 3-21 Usage <strong>of</strong> Passive Microwave Radiometers .................................................................................................................... 54<br />
Table 3-22 Projects Dependent on Radar Altimeter <strong>Data</strong> ........................................................................................................... 56<br />
Table 3-23 Usage <strong>of</strong> Radar Altimeters ..................................................................................................................................................... 56<br />
Table 3-24 Projects Dependent on Hyperspectral Imagery ........................................................................................................ 57<br />
Table 3-25 Usage <strong>of</strong> Hyperspectral Imagery ........................................................................................................................................ 58<br />
Table 3-26 Characteristics <strong>of</strong> Lidar Instruments ................................................................................................................................. 59<br />
Table 3-27 Projects Dependent on Lidar <strong>Data</strong> ................................................................................................................................... 59<br />
Table 3-28 Usage <strong>of</strong> Lidar Sensors ............................................................................................................................................................. 59<br />
Table 3-29 Projects Dependent on Ocean Colour <strong>Data</strong> .............................................................................................................. 60<br />
Table 3-30 Usage <strong>of</strong> Ocean Colour <strong>Data</strong> .............................................................................................................................................. 61<br />
Table 3-31 EO Coverage Requirements by Application Area .................................................................................................... 62<br />
Table 4-1 EO <strong>Data</strong> Type Importance: 2-Year Self-Assessment by <strong>Research</strong>ers ................................................................ 64<br />
Table 4-2 EO <strong>Data</strong> Type Importance: 5-Year Self-Assessment by <strong>Research</strong>ers ................................................................ 65<br />
Table 4-3 Current and Projected <strong>Data</strong> Volumes <strong>for</strong> Selected Projects ................................................................................. 68<br />
Table 5-1 <strong>Data</strong> <strong>Continuity</strong> Options: Low Resolution Optical ..................................................................................................... 83<br />
Table 5-2 Possible Alternative Sensors <strong>for</strong> MODIS .......................................................................................................................... 84<br />
Table 5-3 <strong>Data</strong> <strong>Continuity</strong> Options: Medium Resolution Optical ............................................................................................ 87<br />
Table 5-4 Possible Alternative Sensors <strong>for</strong> Landsat-5 TM .............................................................................................................. 89<br />
Table 5-5 <strong>Data</strong> <strong>Continuity</strong> Options: SAR ................................................................................................................................................ 91<br />
Table 5-6 <strong>Data</strong> <strong>Continuity</strong> Options: Passive Microwave Radiometers ................................................................................... 93<br />
Table 5-7 <strong>Data</strong> <strong>Continuity</strong> Options: Radar Altimeters .................................................................................................................... 94<br />
Table 5-8 <strong>Data</strong> <strong>Continuity</strong> Options: Hyperspectral Imagers ....................................................................................................... 96<br />
Table 5-9 <strong>Data</strong> <strong>Continuity</strong> Options: Lidar .............................................................................................................................................. 97<br />
Table 5-10 <strong>Data</strong> <strong>Continuity</strong> Options: Ocean Colour ...................................................................................................................... 98<br />
Table 5-11 Priority <strong>Data</strong> Types: Satellite 5-Year Supply <strong>Continuity</strong> Risk and Key Providers ...................................... 99<br />
Table 6-1 Priority <strong>Data</strong> Types: Satellite 5-Year Supply <strong>Continuity</strong> Risk and Key Providers .......................................108<br />
<strong>Continuity</strong> <strong>of</strong> <strong>Earth</strong> <strong>Observation</strong> <strong>Data</strong> <strong>for</strong> <strong>Australia</strong>: R&D • January 2012 v
vi <strong>Continuity</strong> <strong>of</strong> <strong>Earth</strong> <strong>Observation</strong> <strong>Data</strong> <strong>for</strong> <strong>Australia</strong>: R&D • January 2012
KEY FINDINGS<br />
KEY FINDINGS<br />
• <strong>Australia</strong>n <strong>Earth</strong> observation (EO) research and development (R&D) is fragmented and underpinned<br />
by data from over 40 <strong>for</strong>eign owned and operated satellites that have been identified as important<br />
<strong>for</strong> the continuity <strong>of</strong> EO data supply <strong>for</strong> <strong>Australia</strong>. <strong>Australia</strong> is one <strong>of</strong> the largest users world-wide<br />
(by volume and variety) <strong>of</strong> EOS data provided by <strong>for</strong>eign satellites.<br />
• The majority <strong>of</strong> <strong>Australia</strong>n EO research projects surveyed in detail, support and provide continuous<br />
improvement to at least 60 current operational EO programs in Federal and State governments,<br />
leading to improved weather <strong>for</strong>ecasting and public safety warnings, improved environmental<br />
monitoring and in<strong>for</strong>med climate policy, effective surveillance and defence <strong>of</strong> territorial waters,<br />
improved disaster prediction and response, in<strong>for</strong>med resource exploration and management, and<br />
improved agricultural and water management capabilities. This support underpins <strong>Earth</strong> observation<br />
dependencies within currently active Federal and State government programs estimated to be worth<br />
approximately $950 million (Geoscience <strong>Australia</strong>, 2010).<br />
• The primary sources <strong>of</strong> EO data <strong>for</strong> <strong>Australia</strong>n researchers are NASA and NOAA satellites (USA),<br />
even though these are not always optimal <strong>for</strong> some <strong>Australia</strong>n requirements. The European Space<br />
Agency (ESA) and the Japan Aerospace Exploration Agency (JAXA) are rapidly emerging as key future<br />
suppliers <strong>of</strong> multiple data streams needed <strong>for</strong> <strong>Australia</strong>n R&D, with several other future data sources<br />
also likely to include Germany, India, China, Korea, Italy and France.<br />
• The <strong>Australia</strong>n research community, as well as operational agencies, contribute to overseas EO<br />
programs through participation in global satellite calibration programs and the direct downlink and<br />
return <strong>of</strong> data back to owner countries, as well as participating in international science teams <strong>for</strong><br />
selected missions, developing new applications <strong>for</strong> these data.<br />
• Every year, over 100 TB <strong>of</strong> <strong>Earth</strong> observation data (satellite and airborne) are obtained by more than<br />
200 research projects across <strong>Australia</strong>, and either downloaded directly over the Internet <strong>for</strong> free<br />
or purchased from data suppliers. Assuming that data volumes double each year, it is conservatively<br />
estimated that the volume <strong>of</strong> data downloaded will exceed 1 PB per year by 2016.<br />
• Free and open data policies <strong>for</strong> access to real-time broadcast data and associated historical archives,<br />
combined with routine production <strong>of</strong> over 40 standard products in the case <strong>of</strong> the US MODIS<br />
program, have made data from the USGS Landsat satellite series, the NOAA AVHRR and NASA<br />
MODIS sensors by far the most widely used data across the EO R&D sector in <strong>Australia</strong>, with almost<br />
60% <strong>of</strong> surveyed projects using data from one or more <strong>of</strong> these three data sources. However, these<br />
systems are not well designed <strong>for</strong> <strong>Australia</strong>’s requirements, given our landscapes are dominated by soils,<br />
rocks and dry vegetation.<br />
• Eleven <strong>of</strong> the 25 R&D projects surveyed that rely on MODIS data currently maintain their own<br />
MODIS data archives <strong>of</strong> more than 30 TB, and individually acquire over 1 TB <strong>of</strong> MODIS data per year.<br />
Four <strong>of</strong> the 12 projects using AVHRR store more than 10 TB <strong>of</strong> historical imagery each, and also<br />
acquire over 1 TB annually.<br />
• Current satellite data continuity issues <strong>for</strong> Landsat data, ALOS L-band SAR data, and EO data from<br />
other science missions with limited, uncertain or broken continuity (e.g. CALIPSO, OCO, ASTER,<br />
GRACE), as well as uncertainties around the quality <strong>of</strong> the new VIIRS sensors which are to replace the<br />
ageing MODIS sensors, may create potentially serious data gaps across multiple R&D programs and<br />
associated operational government mapping programs. The risk associated with such data gaps will<br />
depend heavily on contingency planning by the various user groups, and the sourcing <strong>of</strong> alternative<br />
data streams <strong>of</strong> adequate quality and accessibility.<br />
<strong>Continuity</strong> <strong>of</strong> <strong>Earth</strong> <strong>Observation</strong> <strong>Data</strong> <strong>for</strong> <strong>Australia</strong>: R&D • January 2012 1
KEY RECOMMENDATIONS<br />
• Nine Priority <strong>Data</strong> Types 1 <strong>for</strong> <strong>Australia</strong>n research projects were identified in this study, based on the<br />
number <strong>of</strong> surveyed R&D projects relying on these datasets. Of the top four Priority <strong>Data</strong> Types<br />
identified, there is one actual and current data gap <strong>for</strong> L-band Synthetic Aperture Radar (SAR),<br />
and a very high risk <strong>of</strong> a data gap <strong>for</strong> Medium Resolution Optical data, given the suspension <strong>of</strong><br />
operation <strong>of</strong> the Landsat-5 mission in late 2011. A <strong>for</strong>mal coordinated national approach to ensure<br />
continuity and evaluate alternative data sources <strong>for</strong> critical data supplies <strong>for</strong> <strong>Australia</strong>n researchers,<br />
particularly Medium Resolution Optical data, is strongly recommended as a matter <strong>of</strong> priority, both<br />
with regard to international agreements (particularly with NASA/USGS, ESA, JAXA and other<br />
priority countries), as well as nationally coordinated EO infrastructure planning.<br />
• Government-funded research infrastructure programs and multi-agency research networks<br />
such as the Terrestrial Ecosystem <strong>Research</strong> Network (TERN), the Integrated Marine Observing<br />
System (IMOS), the WA Centre <strong>of</strong> Excellence <strong>for</strong> 3D Mineral Mapping (C3DMM) and AuScope,<br />
lead the way in demonstrating the effectiveness <strong>of</strong> coordination <strong>of</strong> participation in international<br />
networks, and coordination <strong>of</strong> production, standardisation, inter-operability and open access to<br />
key EO-derived datasets <strong>for</strong> use by <strong>Australia</strong>n researchers. Consistent with the 2011 Strategic<br />
Roadmap <strong>for</strong> <strong>Australia</strong>n <strong>Research</strong> Infrastructure (DIISR), these facilities and coordination approaches<br />
should be expanded where possible to other critical EO application areas (e.g. soils, atmospheric<br />
observations), and these data services should continue to receive ongoing central support.<br />
• As data supply agencies world-wide move increasingly towards centralised, Internet-based data<br />
distribution models, more concerted national coordination will be required to ensure current<br />
investments into broadband networks and associated infrastructure can be efficiently and effectively<br />
utilised to improve access to and management <strong>of</strong> the various EO data streams used by R&D and<br />
operational users in <strong>Australia</strong>.<br />
• A small but innovative and dynamic airborne remote sensing R&D and commercial data supply<br />
sector underpins much <strong>of</strong> the EOS R&D community in <strong>Australia</strong> and should continue to be<br />
supported where applicable.<br />
• Several relatively new sensor systems, which may not be widely used currently, merit more<br />
attention in terms <strong>of</strong> continuity and critical data gaps across a range <strong>of</strong> new science and application<br />
fields important to <strong>Australia</strong>. These have strong potential to provide valuable new in<strong>for</strong>mation <strong>for</strong><br />
key essential variables important, <strong>for</strong> example, to hydrological, Antarctic and marine studies, and<br />
<strong>for</strong> monitoring terrestrial dynamics, and atmospheric gas and aerosol climatologies. These sensor<br />
systems include GPS occultation, AMSR-E, OCO-ACE, GRACE, GOSAT, CALIPSO, and ESA<br />
Biomass. Key <strong>Australia</strong>n organisations and researchers will need to monitor these systems on an<br />
ongoing basis, and the CEODA-R&D survey should be updated on a regular basis.<br />
• The <strong>Australia</strong>n R&D community has tended to use ‘whatever free data are available’, provided<br />
it <strong>of</strong>fers suitable data quality, continuity, coverage and access arrangements. International space<br />
agencies should continue to be encouraged and supported as they move towards free and open<br />
data access policies.<br />
1 Priority <strong>Data</strong> Types ranked by frequency <strong>of</strong> usage across surveyed projects (no weighting applied <strong>for</strong> data volumes): Low Resolution<br />
Optical; Medium Resolution Optical; High Resolution Optical; Synthetic Aperture Radar (SAR) (C-, L- and X-band); Passive Microwave<br />
Radiometry; Radar Altimetry; Hyperspectral Imagery; Lidar; Ocean Colour.<br />
2 <strong>Continuity</strong> <strong>of</strong> <strong>Earth</strong> <strong>Observation</strong> <strong>Data</strong> <strong>for</strong> <strong>Australia</strong>: R&D • January 2012
KEY RECOMMENDATIONS<br />
• Coordinated <strong>Australia</strong>n participation in regional and global EOS coordination bodies, such as the<br />
Committee on <strong>Earth</strong> <strong>Observation</strong> Satellites (CEOS), the Group on <strong>Earth</strong> <strong>Observation</strong>s (GEO),<br />
the Coordination Group <strong>for</strong> Meteorological Satellites (CGMS) and the Asia Pacific Regional Space<br />
Agency Forum, as well as negotiation <strong>of</strong> new data agreements with emerging suppliers <strong>of</strong> public<br />
good EO data, will there<strong>for</strong>e help secure current and future data access to critical EO datasets.<br />
• To continue to realise the great benefits that EO data increasingly provide, <strong>Australia</strong>’s modest<br />
contribution towards international EO programs should be more closely integrated and<br />
coordinated across research facilities, R&D agencies and university groups, and expanded to include<br />
better support <strong>for</strong> satellite calibration/validation, international science team membership, data<br />
downlink – as a Southern Hemisphere and regional ‘data node’, regional development assistance,<br />
and scientific collaborations on the development <strong>of</strong> new applications.<br />
• US and European financial pressures are likely to cause shifts in large new <strong>Earth</strong> observation<br />
investments and associated R&D programs. Asia and South America are likely new growth regions,<br />
presenting <strong>Australia</strong> with significant opportunities <strong>for</strong> increased engagement with, and enhancement<br />
<strong>of</strong> R&D collaborations and technical development assistance <strong>for</strong>, emerging space nations.<br />
• <strong>Australia</strong>’s EO R&D and operational user community should undertake a detailed study <strong>of</strong> the<br />
relative merits <strong>of</strong> increased national investment into EO space segment infrastructure development<br />
(<strong>for</strong> example, niche sensor technologies, hosted payloads, co-investment in joint space missions<br />
with other space-capable nations, or alternatively, high altitude unmanned aerial plat<strong>for</strong>ms), as an<br />
avenue towards future self-reliance, securing future data streams, and to help grow <strong>Australia</strong>’s<br />
research, international collaborations and industrial development in the field <strong>of</strong> <strong>Earth</strong> observation.<br />
Three high priority candidate areas <strong>for</strong> further exploration are: SAR, Hyperspectral imagery, and<br />
Short Wave and Thermal Infrared. Cost-effective contributions could be made through international<br />
virtual constellations.<br />
<strong>Continuity</strong> <strong>of</strong> <strong>Earth</strong> <strong>Observation</strong> <strong>Data</strong> <strong>for</strong> <strong>Australia</strong>: R&D • January 2012 3
4 <strong>Continuity</strong> <strong>of</strong> <strong>Earth</strong> <strong>Observation</strong> <strong>Data</strong> <strong>for</strong> <strong>Australia</strong>: R&D • January 2012
EXECUTIVE SUMMARY<br />
Scope<br />
EXECUtivE SUMMARy<br />
The Space Policy Unit (SPU) within the Department <strong>of</strong> Industry, Innovation, Science, <strong>Research</strong> and Tertiary<br />
Education (DIISRTE, <strong>for</strong>merly DIISR) engaged CSIRO to survey the key dependencies and future priorities<br />
<strong>for</strong> EO data (space and airborne) used by the <strong>Australia</strong>n research community. A recent companion report,<br />
entitled <strong>Continuity</strong> <strong>of</strong> <strong>Earth</strong> <strong>Observation</strong> <strong>Data</strong> <strong>for</strong> <strong>Australia</strong>: Operational Requirements to 2015 <strong>for</strong> Lands, Coasts<br />
and Oceans (CEODA-Ops) (Geoscience <strong>Australia</strong>, 2011), detailed the projected EOS data requirements <strong>for</strong><br />
<strong>Australia</strong>n Government agencies in 2015, and assessed the expected availability <strong>of</strong> EOS data in <strong>Australia</strong><br />
to 2020. A third report focusing on operational meteorological <strong>Earth</strong> <strong>Observation</strong> (EO) data needs is in<br />
preparation by the Bureau <strong>of</strong> Meteorology (BoM).<br />
Survey Population<br />
Nearly 200 significant and representative <strong>Australia</strong>n R&D projects requiring EO data were identified from<br />
research teams within CSIRO, Cooperative <strong>Research</strong> Centres (CRCs), universities, and Federal and State<br />
government agencies. National benefits from this research are many and varied, including improved weather<br />
<strong>for</strong>ecasting and public safety warnings, improved environmental monitoring and in<strong>for</strong>med climate policy,<br />
effective surveillance and defence <strong>of</strong> territorial waters, improved disaster prediction and response, in<strong>for</strong>med<br />
resource exploration and management, and improved agricultural and water management capabilities.<br />
From these projects, 56 projects from 31 organisations were selected as a representative sample set <strong>of</strong> the<br />
wide variety <strong>of</strong> EO-related R&D activities in <strong>Australia</strong>, and include the majority <strong>of</strong> the prominent research<br />
groups. These 56 projects (with a total annual budget <strong>of</strong> approximately $35 million and employment <strong>of</strong> over<br />
190 full time equivalents, in both civil and defence organisations) were surveyed in more detail in terms <strong>of</strong><br />
their current and future EO data requirements, their current and future data supply preferences, and their<br />
linkages to national and international programs, both research and operational. Over 70% <strong>of</strong> the projects<br />
surveyed in detail are linked to current operational EO-dependent programs in <strong>Australia</strong>, as reported in<br />
CEODA-Ops.<br />
Main Results<br />
The 56 R&D projects studied in detail in this survey demonstrated great ingenuity and diversity in their data<br />
access arrangements and their use <strong>of</strong> EO data across a wide range <strong>of</strong> application areas, collectively using 59<br />
different satellite EO instruments that are considered essential to research. Of these 59 instruments, 17 are<br />
used uniquely by the Centre <strong>for</strong> <strong>Australia</strong>n Weather and Climate <strong>Research</strong> (CAWCR) and BoM in support<br />
<strong>of</strong> their National Weather Program (NWP) and application research projects. This highlights the importance<br />
<strong>of</strong>, and <strong>Australia</strong>’s reliance on, EOS data as a key input towards improved understanding <strong>of</strong> the various<br />
physical and biological processes, human impacts and elements that <strong>for</strong>m part <strong>of</strong> the <strong>Earth</strong> System, and <strong>for</strong><br />
underpinning State and Federal programs which ensure improved evidence-based management <strong>of</strong> essential<br />
food-, water-, resources-, environmental- and national security across <strong>Australia</strong>.<br />
<strong>Continuity</strong> <strong>of</strong> <strong>Earth</strong> <strong>Observation</strong> <strong>Data</strong> <strong>for</strong> <strong>Australia</strong>: R&D • January 2012 5
Nine broadly classified “Priority <strong>Data</strong> Types” have been identified, based upon their criticality in support <strong>of</strong><br />
research outcomes, and their widespread usage across multiple projects. These are (in decreasing order<br />
<strong>of</strong> usage):<br />
• Low Resolution Optical;<br />
• Medium Resolution Optical;<br />
• High Resolution Optical;<br />
• SAR (C-, L- and X-band);<br />
• Passive Microwave Radiometry;<br />
• Radar Altimetry;<br />
• Hyperspectral Imagery;<br />
• Lidar; and<br />
• Ocean Colour.<br />
While also used extensively in routine operational programs across <strong>Australia</strong>n Government agencies, the<br />
Low and Medium Resolution Optical data are also by far the most widely used data types in the R&D<br />
sector, with Low Resolution Optical data being used by around half <strong>of</strong> the surveyed projects. SAR data<br />
represent the next most widely used data type, and their use is expected to grow as data streams become<br />
more accessible and continuous.<br />
<strong>Research</strong>ers assessed that their needs <strong>for</strong> these Priority <strong>Data</strong> Types will not change significantly over the<br />
next five years, although a broadening <strong>of</strong> the available satellite EO instrument suite and increased use <strong>of</strong><br />
new EO data sources with higher spatial and spectral resolutions are widely anticipated. There<strong>for</strong>e, significant<br />
increases in the variety <strong>of</strong> data streams and in particular in data volumes are envisioned in future.<br />
Survey results highlighted the tendency <strong>of</strong> the R&D community to historically use ‘whatever free data are<br />
available’, provided it <strong>of</strong>fers suitable data quality, continuity, coverage and access arrangements. The purchase<br />
<strong>of</strong> large volumes <strong>of</strong> commercial EO data is financially unsustainable <strong>for</strong> the vast majority <strong>of</strong> projects<br />
surveyed.<br />
Several relatively new sensor systems, which may not be widely used currently, merit more attention in<br />
terms <strong>of</strong> continuity and critical data gaps across a range <strong>of</strong> new science and application fields important<br />
to <strong>Australia</strong>. These have strong potential to provide valuable new in<strong>for</strong>mation <strong>for</strong> key essential variables<br />
important, <strong>for</strong> example, to hydrological, Antarctic and marine studies, and <strong>for</strong> monitoring terrestrial dynamics,<br />
and atmospheric gas and aerosol climatologies. These sensor systems include GPS occultation, AMSR-E,<br />
OCO-ACE, GRACE, GOSAT, CALIPSO, and ESA Biomass. Key <strong>Australia</strong>n organisations and researchers will<br />
need to monitor these systems on an ongoing basis, and the CEODA-R&D survey should be updated on a<br />
regular basis.<br />
Awareness <strong>of</strong> future international EO satellite program plans, data contingency planning, radio-frequency<br />
protection issues, and the need to strengthen international partnerships with additional supplier agencies,<br />
varied significantly among individual researchers but was generally low, with few researchers following global<br />
developments closely. This suggests that the R&D community may need to be better in<strong>for</strong>med <strong>of</strong> future<br />
opportunities be<strong>for</strong>e national priorities can be established.<br />
<strong>Data</strong> <strong>Continuity</strong> Risks<br />
Of the top four Priority <strong>Data</strong> Types listed above, there is one current data gap <strong>for</strong> L-band SAR, and a<br />
significant risk <strong>of</strong> a data gap <strong>for</strong> Medium Resolution Optical data (see Table ES-1). Numerous operational<br />
national programs and legislated monitoring activities could be delayed or otherwise affected by loss <strong>of</strong><br />
L-band SAR data, Landsat and MODIS data in particular, due to the significant cost and ef<strong>for</strong>t associated<br />
with changing data processing protocols and negotiating data access, as programs transition to alternative<br />
data sources.<br />
6 <strong>Continuity</strong> <strong>of</strong> <strong>Earth</strong> <strong>Observation</strong> <strong>Data</strong> <strong>for</strong> <strong>Australia</strong>: R&D • January 2012
EXECUtivE SUMMARy<br />
Landsat data continuity had been dependent on the ongoing health <strong>of</strong> the ageing Landsat-5 satellite<br />
(suspended in November 2011, possibly at end <strong>of</strong> life) and the relative utility <strong>of</strong> a malfunctioning Landsat-7<br />
satellite, and is the subject <strong>of</strong> some anxiety in the relevant user communities. In the short-term, the<br />
economic impact to <strong>Australia</strong> <strong>of</strong> losing access to Landsat data has been assessed as $100 million in the first<br />
year <strong>of</strong> a data gap, with a flow-on effect in subsequent years <strong>for</strong> the duration <strong>of</strong> that gap (ACIL Tasman,<br />
2010).<br />
NASA’s replacement mission, the Landsat <strong>Data</strong> <strong>Continuity</strong> Mission (LDCM, Landsat-8), is not expected to<br />
be operational until mid-2013. Beyond 2013, the European Space Agency/European Commission’s (ESA/<br />
EC) Sentinel-2 mission (part <strong>of</strong> Europe’s Global Monitoring <strong>for</strong> Environment and Security/GMES satellite<br />
program) should also provide ample Medium Resolution Optical data.<br />
Similarly, due in part to free access to over 40 derived products, use <strong>of</strong> MODIS data is so widespread<br />
in <strong>Australia</strong>n research and government programs that inevitably a very significant financial and technical<br />
cost will be incurred across several national and regional programs in the event that this sensor becomes<br />
unreliable or unavailable, <strong>for</strong>cing R&D and operations sectors to transition to other sensors and in<strong>for</strong>mation<br />
products derived from new sensors such as VIIRS or Sentinel-3.<br />
A gap in new acquisitions <strong>of</strong> L-band SAR data has existed since the failure <strong>of</strong> Japan’s ALOS mission in March<br />
2011 and has significantly impacted the research community, including those supporting routine national<br />
and international <strong>for</strong>est carbon, vegetation mapping and disaster monitoring programs using this type <strong>of</strong><br />
radar imaging.<br />
Critical Relationships<br />
The current financial crises in the US and Europe could have significant implications <strong>for</strong> continuity <strong>of</strong> EO<br />
data supply to <strong>Australia</strong>. NASA and NOAA have been the most important suppliers <strong>of</strong> EO satellite data<br />
in support <strong>of</strong> <strong>Australia</strong>n R&D needs over the last decades. However, the future supply prospects <strong>for</strong> the<br />
Priority <strong>Data</strong> Types identified suggest that a larger number <strong>of</strong> additional suppliers and data types will be<br />
important to <strong>Australia</strong> in the future. This has implications <strong>for</strong> both the planning and prioritisation <strong>of</strong> key<br />
relationships and infrastructure in support <strong>of</strong> these expanded data supply and management arrangements.<br />
In the near term, <strong>Australia</strong>’s relationship with ESA could potentially grow to one <strong>of</strong> equal importance <strong>for</strong> the<br />
provision <strong>of</strong> EO satellite data <strong>for</strong> <strong>Australia</strong>n R&D needs, provided that data access terms improve, and that<br />
the current financial crisis does not affect ESA’s launch schedule or ground segment capacities. Based on<br />
technical specifications, ESA (and in some cases the EC) was identified in this survey as a key future supplier<br />
<strong>for</strong> as many as seven Priority <strong>Data</strong> Types, based on data from the GMES program and the five series <strong>of</strong><br />
Sentinel satellite missions.<br />
Furthermore, to enhance access to other key EO datasets, and as a key participant in regional cooperation<br />
and space agency <strong>for</strong>ums, <strong>Australia</strong> has a strong opportunity to continue and further enhance space-related<br />
cooperation in the region. More active ‘export’ <strong>of</strong> <strong>Australia</strong>’s EO data calibration and analysis expertise, via<br />
bilateral or multilateral science collaborations or development assistance agreements in the Asia-Pacific<br />
region, would build goodwill and secure better access to various EO data streams provided by space<br />
agencies in the region (primarily Japan, india, China, thailand and Korea).<br />
Infrastructure Implications<br />
In the near term, the rapid move to Internet-based distribution by major supply agencies, an increase<br />
in the variety <strong>of</strong> data types, and an increase in data volumes by up to a factor <strong>of</strong> ten over the next five<br />
years suggest that efficient on-line access will be critical to minimise data cost, duplication and latency. This<br />
has significant implications <strong>for</strong> national data networks and computing infrastructure with regard to data<br />
transmission, storage, pre-processing and provision, and will require national coordination.<br />
<strong>Continuity</strong> <strong>of</strong> <strong>Earth</strong> <strong>Observation</strong> <strong>Data</strong> <strong>for</strong> <strong>Australia</strong>: R&D • January 2012 7
The need <strong>for</strong> careful, systematic calibration and validation (Cal/Val) <strong>of</strong> EOS datasets is urgent. National<br />
infrastructure to support radiometric Cal/Val is considered by many researchers to be a fundamental<br />
element in ensuring both EO data quality and strong relationships with <strong>for</strong>eign collaborators, including<br />
in support <strong>of</strong> the growing number <strong>of</strong> operational programs relying on these data, especially in areas <strong>of</strong><br />
legislative monitoring.<br />
SAR data and hyperspectral imagery were both identified by the largest number <strong>of</strong> potential users as future<br />
priority data types <strong>for</strong> the R&D community. Future missions <strong>of</strong>fering these data types, such as Sentinel-1<br />
(ESA/EC, May 2013), ALOS-2 (JAXA, 2013), ALOS-3 (JAXA, 2014), PRiSMA (ASi, 2014) and EnMap<br />
(DLR, Apr 2015), <strong>of</strong>fer significant opportunities <strong>for</strong> data streams <strong>of</strong> high value to the research community.<br />
Adequate planning, with sufficient lead-time, <strong>for</strong> the reception, processing, archiving and distribution <strong>of</strong><br />
these specialist data types will be essential if maximum national benefit is to be derived once these satellites<br />
are launched.<br />
Priority EO<br />
<strong>Data</strong> Type<br />
Optical: Low<br />
Resolution<br />
Optical: Medium<br />
Resolution<br />
Optical: High<br />
Resolution<br />
Table ES-1 Priority <strong>Data</strong> Types: Satellite 5-Year Supply <strong>Continuity</strong> Risk and Key Providers<br />
5-year<br />
continuity<br />
risk<br />
Low<br />
Current key providers<br />
(and missions)<br />
NASA (MODIS)<br />
NOAA/EUMETSAT (AVHRR)<br />
JMA (MtSAt series)<br />
High USGS (Landsat-5/7)<br />
Low<br />
SAR: C-band Low<br />
SAR: L-band<br />
No<br />
current<br />
supply<br />
SAR: X-band Low<br />
Passive Microwave<br />
Radiometry<br />
Medium<br />
Radar Altimetry Medium<br />
Hyperspectral<br />
Imagery<br />
USA commercial providers<br />
(Worldview, GeoEye)<br />
ESA (Envisat)<br />
CSA (Radarsat)<br />
8 <strong>Continuity</strong> <strong>of</strong> <strong>Earth</strong> <strong>Observation</strong> <strong>Data</strong> <strong>for</strong> <strong>Australia</strong>: R&D • January 2012<br />
-<br />
ASI (COSMO-SkyMed)<br />
DLR (terraSAR-X)<br />
NASA (Aqua – just concluded)<br />
NOAA/DoD (DMSP series)<br />
JAXA/NASA (tRMM)<br />
ESA (SMOS)<br />
EUMEtSAt-NOAA (Jason series)<br />
ESA (Envisat)<br />
High NASA (EO-1)<br />
Future key providers<br />
(and missions)<br />
ESA/EC (Sentinel-3 series)<br />
NOAA (NPP/JPSS series)<br />
JAXA (GCOM-C series)<br />
JMA (MtSAt series)<br />
USGS (LDCM)<br />
ESA/EC (Sentinel-2 series)<br />
USA & European commercial<br />
providers<br />
(Worldview, GeoEye, Pleiades)<br />
Airborne operators<br />
ESA/EC (Sentinel-1 series)<br />
CSA (Radarsat & RCM)<br />
CONAE-ASI (SAOCOM-1A)<br />
JAXA (ALOS-2)<br />
ASI (COSMO-SkyMed series)<br />
DLR (terraSAR-X series)<br />
JAXA/NASA (GCOM-W series)<br />
NASA (GPM, Aquarius, SMAP)<br />
NOAA/DoD (DMSP series)<br />
ESA (SMOS)<br />
ISRO (Megha-Tropiques, RISAT-3)<br />
EUMEtSAt-NOAA (Jason series)<br />
ESA/EC (Sentinel-3 series)<br />
DLR (EnMAP)<br />
ASI (PRISMA)<br />
MEti/JAXA (ALOS-3)<br />
Predominant<br />
Latency<br />
Requirement<br />
Hours/Weeks<br />
Days/Weeks<br />
Days/Weeks<br />
Weeks<br />
Weeks<br />
Weeks<br />
Hours<br />
Hours<br />
Weeks<br />
Lidar High NASA (CALIPSO) ESA/JAXA (<strong>Earth</strong>CARE) Weeks<br />
Ocean Colour Low<br />
ESA (MERIS)<br />
NASA (MODIS)<br />
ISRO (OCEANSAT)<br />
ESA/EC (Sentinel-3 series)<br />
JAXA (GCOM-C series)<br />
ISRO (OCEANSAT)<br />
NOAA (NPP/JPSS series)<br />
Hours
1 INTRODUCTION<br />
1.1 <strong>Earth</strong> <strong>Observation</strong><br />
INTRODUCTION<br />
<strong>Earth</strong> <strong>Observation</strong> (EO) encompasses a diverse group <strong>of</strong> activities that quantify, map and monitor several<br />
key characteristics <strong>of</strong> the <strong>Earth</strong> using remote measurement techniques. This is commonly referred to as<br />
remote sensing. EO activities include measurements from satellite sensors, airborne sensors, and in situ<br />
sensors. <strong>Earth</strong> <strong>Observation</strong>s from Space (EOS) describes a range <strong>of</strong> approaches that observe and measure<br />
<strong>Earth</strong> surface properties from space-based plat<strong>for</strong>ms.<br />
For the purposes <strong>of</strong> this survey and report, the EO-related projects analysed here involve those which<br />
focus their work on directly using, or deriving products from, both satellite-based and airborne sensor<br />
measurements, as well as the use <strong>of</strong> in situ (ground) measurements that are taken to directly support or<br />
validate satellite and/or airborne data acquisitions.<br />
There is a growing operational and economic dependence on EO data <strong>for</strong> a diverse range <strong>of</strong> applications<br />
in <strong>Australia</strong>. This currently involves at least 92 major Federal and State programs (Geoscience <strong>Australia</strong>,<br />
2010) and $3.3 billion per year GDP contribution <strong>for</strong> both direct and indirect productivity measurements<br />
(ACIL Tasman, 2010). EO operational applications in <strong>Australia</strong> typically include modelling climate, <strong>for</strong>ecasting<br />
weather, monitoring water management and quality, surveillance <strong>of</strong> oceans, mapping <strong>for</strong>ests, estimating<br />
agricultural production, mitigating hazards, responding to disasters, assessing urban expansion, locating mining<br />
and energy resources, maintaining national security, protecting borders, positioning, transport and navigation<br />
(Geoscience <strong>Australia</strong>, 2011).<br />
<strong>Australia</strong> does not have its own EO satellite system, so all EOS data are currently sourced from <strong>for</strong>eign<br />
satellites. Given our dependence on these data <strong>for</strong> multiple, critical national needs, it must be emphasised<br />
that security <strong>of</strong> supply from these <strong>for</strong>eign sources is beyond <strong>Australia</strong>n control. In light <strong>of</strong> the ever-growing<br />
operational and research needs and dependencies on EO data continuity, this situation should be a matter<br />
<strong>of</strong> significant national concern.<br />
1.2 Purpose<br />
In the process <strong>of</strong> framing a new space policy <strong>for</strong> <strong>Australia</strong>, the Space Policy Unit (SPU), within the<br />
Department <strong>of</strong> Industry, Innovation, Science, <strong>Research</strong> and Tertiary Education (DIISRTE), conducted a<br />
number <strong>of</strong> in<strong>for</strong>mation-gathering activities. As one part <strong>of</strong> this process, the SPU engaged CSIRO to survey<br />
the key dependencies and future priorities <strong>for</strong> EO data (space and airborne) used by the <strong>Australia</strong>n<br />
research community. This survey, <strong>Continuity</strong> <strong>of</strong> <strong>Earth</strong> <strong>Observation</strong> <strong>Data</strong> <strong>for</strong> <strong>Australia</strong>: <strong>Research</strong> and Development<br />
Requirements to 2020 (CEODA-R&D), focused on those teams and experts conducting basic and applied<br />
remote sensing research to advance EO science, and included those groups that undertake research and<br />
development (R&D) in support <strong>of</strong> major national programs that make operational use <strong>of</strong> EO data.<br />
In particular, the survey aimed to characterise EO satellite and airborne data needs, requirements and gaps<br />
in <strong>Australia</strong>’s EO-related R&D sector. The results <strong>of</strong> this survey are presented in Sections 2, 3 and 4.<br />
A sample set <strong>of</strong> significant and representative R&D projects requiring EO were identified and surveyed in<br />
terms <strong>of</strong> their current and future EO data requirements, their current and future data supply preferences,<br />
and their linkages to national and international programs, both research and operational. Most importantly,<br />
the survey ascertained those areas where improved coordination and possible investments are needed to<br />
secure future data access <strong>for</strong> <strong>Australia</strong>’s EO-related R&D sector.<br />
The survey aimed to provide as complete a picture as possible <strong>of</strong> the <strong>Australia</strong>n EO-related R&D<br />
community, identifying issues that are key to ensuring continuity <strong>of</strong> data supply <strong>for</strong> future development and<br />
innovation. As such, it involved a comprehensive set <strong>of</strong> questions (see Section 2.1.3 and Appendix C <strong>for</strong><br />
details) and the cooperation <strong>of</strong> participants is both acknowledged and greatly appreciated. The process <strong>of</strong><br />
<strong>Continuity</strong> <strong>of</strong> <strong>Earth</strong> <strong>Observation</strong> <strong>Data</strong> <strong>for</strong> <strong>Australia</strong>: R&D • January 2012 9
this survey has enabled respondents to gain greater awareness and familiarity with the diverse range <strong>of</strong> EO<br />
data sources that are being planned <strong>for</strong> future use.<br />
1.3 Objectives<br />
This report, CEODA-R&D, seeks to address the following objectives.<br />
1. To report the outcomes <strong>of</strong> a survey conducted by CSIRO to characterise satellite and airborne EO<br />
data requirements and gaps in <strong>Australia</strong>’s EO-related R&D sector, including<br />
• the importance <strong>of</strong> the availability <strong>of</strong> the EO data in support <strong>of</strong> the R&D project outcomes,<br />
and the role and magnitude <strong>of</strong> the R&D in support <strong>of</strong> operational government or commercial<br />
programs and their related social and economic impact <strong>for</strong> <strong>Australia</strong><br />
• data types <strong>of</strong> special importance to the R&D sector, based on the criticality <strong>of</strong> the data<br />
availability to the outcomes and whether certain data types are critical to multiple projects.<br />
2. To determine how EOS data requirements are presumed to be satisfied by existing and planned<br />
satellite systems, to document the nature <strong>of</strong> the supporting arrangements <strong>for</strong> access by <strong>Australia</strong><br />
and, where possible, to define how these requirements are expected to evolve in the next ten<br />
years, including identifying<br />
• which EOS missions are a priority <strong>for</strong> guaranteed access by <strong>Australia</strong>’s R&D community over<br />
the next ten years<br />
• which relationships, with both space agency data providers and with related research partners,<br />
are a priority in terms <strong>of</strong> data access and activities related to improved data analysis and<br />
exploitation<br />
• opportunities <strong>for</strong> potential expansion <strong>of</strong> national and international collaborations and<br />
partnerships, and ways in which the <strong>Australia</strong>n EO R&D sector can contribute and support<br />
<strong>for</strong>eign programs.<br />
3. To highlight the implications <strong>of</strong> anticipated future EOS data requirements in terms <strong>of</strong> future<br />
support, infrastructure needs and capabilities, including<br />
• an assessment as to the likely future EOS access scenarios and continuity risks which face the<br />
R&D sector, and identifying future contingencies.<br />
1.4 Related Reports<br />
This report (CEODA-R&D) provides an important complement to several recent reviews <strong>of</strong> the extent and<br />
significance <strong>of</strong> EO data usage in <strong>Australia</strong>.<br />
Of these, the recent report A National Space Policy: Views from the <strong>Earth</strong> <strong>Observation</strong> Community (Geoscience<br />
<strong>Australia</strong>, 2010) identified 92 Federal and State government programs that use EOS data on an operational<br />
basis. These programs encompass a wide range <strong>of</strong> applications areas, landscapes and localities. This set <strong>of</strong><br />
operational programs was used in The Economic Value <strong>of</strong> <strong>Earth</strong> <strong>Observation</strong> from Space (ACIL Tasman, 2010)<br />
to estimate the direct contribution <strong>of</strong> EOS to <strong>Australia</strong>’s Gross Domestic Product (GDP) at $1.4 billion<br />
per year in 2008-09. This estimate considered the combined value <strong>of</strong> imagery, technology and skilled labour<br />
within these programs. In light <strong>of</strong> the growing dependency on EOS <strong>for</strong> in<strong>for</strong>mation on climate change,<br />
natural resource management, and environmental reporting and compliance, this figure is expected to<br />
exceed $4 billion per year by 2015. Additionally, the related productivity benefits to the <strong>Australia</strong>n economy,<br />
that is, the impacts <strong>of</strong> EOS in<strong>for</strong>mation on productivity in other market sectors 2 , were estimated at<br />
2 Market sectors deemed to derive significant productivity benefits from EOS were Agriculture, Forestry, Fisheries, Mining and<br />
Petroleum, Property and Business Services, Federal and State governments, Natural Resource Management, Environment and Climate<br />
Change, Biosecurity, Defence and National Security, Counterterrorism, Emergency Management, and Maritime and Air Safety (ACIL<br />
Tasman, 2010).<br />
10 <strong>Continuity</strong> <strong>of</strong> <strong>Earth</strong> <strong>Observation</strong> <strong>Data</strong> <strong>for</strong> <strong>Australia</strong>: R&D • January 2012
INTRODUCTION<br />
$1.9 billion per year in 2008-09, and projected to be worth $2.5 billion per year by 2015. Further economic<br />
benefits totalling $1 billion per year, were estimated <strong>for</strong> providing enhanced in<strong>for</strong>mation from EOS relating<br />
to climate change, natural resource management and emergency management.<br />
Current Government expenditure on EO in <strong>Australia</strong> approximates $100 million per year (Space Policy<br />
Unit, 2010). Using the above estimate <strong>of</strong> the economic benefits <strong>of</strong> EOS to the <strong>Australia</strong>n economy, namely a<br />
$3.3 billion per annum GDP contribution <strong>for</strong> both direct and related productivity benefits, EOS is providing<br />
a return on investment <strong>of</strong> more than 30 to one.<br />
Many <strong>of</strong> the specific operational uses <strong>of</strong> EO data are underpinned by a diverse and talented R&D sector<br />
that comprises numerous research establishments. These institutions per<strong>for</strong>m the essential functions <strong>of</strong><br />
ensuring the quality <strong>of</strong> routinely used EO data, developing new uses <strong>for</strong> available data, and maintaining a<br />
watching brief on new and emerging technologies in this area. The <strong>Australia</strong>n Academy <strong>of</strong> Science (AAS)<br />
and the <strong>Australia</strong>n Academy <strong>of</strong> Technological Sciences and Engineering (ATSE), in consultation with space<br />
science and EO experts, prepared the <strong>Australia</strong>n Strategic Plan <strong>for</strong> <strong>Earth</strong> <strong>Observation</strong>s from Space (ATSE,<br />
2009). This plan concluded that the growing future EO needs <strong>of</strong> <strong>Australia</strong> could only be reliably met by an<br />
increased national commitment to EOS data provision and associated R&D. The plan also identified eight key<br />
national challenges <strong>for</strong> <strong>Australia</strong>, each <strong>of</strong> which should involve extensive use <strong>of</strong> EOS:<br />
• Climate change;<br />
• Water availability;<br />
• Natural disaster mitigation;<br />
• Safe and secure transport;<br />
• Energy and resources security;<br />
• Agriculture, <strong>for</strong>estry and ecosystems;<br />
• Coasts and oceans; and<br />
• National security.<br />
The most recent report, entitled <strong>Continuity</strong> <strong>of</strong> <strong>Earth</strong> <strong>Observation</strong> <strong>Data</strong> <strong>for</strong> <strong>Australia</strong>: Operational Requirements<br />
to 2015 <strong>for</strong> Lands, Coasts and Oceans (CEODA-Ops) (Geoscience <strong>Australia</strong>, 2011), detailed the projected<br />
EOS data requirements <strong>for</strong> land, coast and ocean applications <strong>for</strong> <strong>Australia</strong>n government agencies in 2015,<br />
and assessed the expected availability <strong>of</strong> EOS data in <strong>Australia</strong> to 2020. Based on the data requirements <strong>for</strong><br />
91 3 <strong>of</strong> the 92 operational programs detailed in Geoscience <strong>Australia</strong> (2010), an almost twentyfold increase<br />
in EOS data usage was <strong>for</strong>ecast over the next five years. The total annual EOS data storage requirements <strong>for</strong><br />
those programs were conservatively estimated at 1.2 PB per year in 2015. By contrast, EOS data availability<br />
in <strong>Australia</strong> was projected to decrease in the same time period based on current supply arrangements<br />
and systems.<br />
CEODA-Ops assessed data requirements in terms <strong>of</strong> five data categories – Low Resolution Optical (> 80 m<br />
pixel), Medium Resolution Optical (10 m – 80 m pixel), High Resolution Optical (< 10 m pixel), Synthetic<br />
Aperture Radar (SAR), and Passive Microwave Radiometry. (In this context, ‘optical’ implied detection <strong>of</strong><br />
surface properties in multiple visible and/or near infrared wavelengths (bands), including thermal infrared).<br />
Two <strong>of</strong> these data categories, Medium Resolution Optical and SAR, were considered to be the most at risk<br />
<strong>of</strong> data gaps <strong>for</strong> land and marine applications be<strong>for</strong>e 2015. Medium resolution optical data is used by 79%<br />
<strong>of</strong> the sample operational programs <strong>for</strong> a wide range <strong>of</strong> land and water management applications, including<br />
the National Carbon Accounting System (NCAS). CEODA-Ops recommended that access to future EOS<br />
missions be <strong>for</strong>malised immediately and that a decadal infrastructure plan be <strong>for</strong>mulated to safeguard the<br />
supply <strong>of</strong> EOS data in <strong>Australia</strong>.<br />
3 Program 26 was not included in this sample due to insufficient EOS data usage.<br />
<strong>Continuity</strong> <strong>of</strong> <strong>Earth</strong> <strong>Observation</strong> <strong>Data</strong> <strong>for</strong> <strong>Australia</strong>: R&D • January 2012 11
As detailed in the Objectives (see Section 1.3), the present report focuses on the data requirements in<br />
<strong>Australia</strong>’s EO-related R&D sector, which were not considered in the CEODA-Ops report. On the basis<br />
<strong>of</strong> a cross-section <strong>of</strong> 56 sample R&D projects in this survey, those EO data types and missions that are <strong>of</strong><br />
special importance to R&D in <strong>Australia</strong> are identified. To highlight potential EO data continuity risks, future<br />
data supply options are also considered, both in terms <strong>of</strong> projected R&D requirements and infrastructure<br />
capabilities. The collaborations involved in EO-related R&D, both nationally and internationally, are examined,<br />
and the interrelationships between R&D project outcomes and several key operational programs<br />
are described.<br />
1.5 Report Annex<br />
This report is accompanied by an Annex document, with appendices that provide more detail and data in<br />
support <strong>of</strong> the sections in the main report:<br />
Appendix A – R&D Projects Included the Study: with details <strong>of</strong> organisations, contacts, project<br />
objectives etc.<br />
Appendix B – <strong>Australia</strong>n EO-dependent Operational Programs: details the 91 current EOS data<br />
programs being undertaken by Federal and State agencies in <strong>Australia</strong>, which were discussed in terms<br />
<strong>of</strong> project linkages in Section 2.<br />
Appendix C – Survey Questions: documents the worksheets <strong>of</strong> which the study survey<br />
was comprised.<br />
Appendix D – Instrument Details <strong>for</strong> Priority <strong>Data</strong> Types: provides technical characteristics <strong>for</strong> all<br />
the instruments discussed in the continuity outlook discussions.<br />
Appendix E – Priority <strong>Data</strong> Types – <strong>Continuity</strong> Outlook: additional details and timelines to<br />
supplement the discussion in Section 5.<br />
12 <strong>Continuity</strong> <strong>of</strong> <strong>Earth</strong> <strong>Observation</strong> <strong>Data</strong> <strong>for</strong> <strong>Australia</strong>: R&D • January 2012
2 CONTEXT OF CEODA-R&D SURVEY<br />
CONtEXt Of CEODA-R&D SURvEy<br />
The processes involved with the <strong>Continuity</strong> <strong>of</strong> <strong>Earth</strong> <strong>Observation</strong> <strong>Data</strong> <strong>for</strong> <strong>Australia</strong> – <strong>Research</strong> and<br />
Development Requirements to 2020 (CEODA-R&D) survey are described in Section 2.1. The survey<br />
population is summarised and described in Sections 2.2 and 2.3 respectively. Major projects are identified<br />
in Section 2.4.<br />
2.1 Survey Structure<br />
2.1.1 Scope<br />
The CEODA-R&D survey included EO-related R&D projects that involve basic and applied research but<br />
not operational usage <strong>of</strong> this research. The evolving cycles <strong>of</strong> EO-related research and development are<br />
represented by concentric regions in Figure 2-1. Starting from the centre <strong>of</strong> Figure 2-1, these regions show<br />
the interrelationships between:<br />
1. Basic EO-related R&D (shown as red), such as atmospheric correction, Cal/Val, new sensors and<br />
derived products;<br />
2. Application <strong>of</strong> EO products (shown as blue), continuous improvement programs, pre-operational<br />
or demonstration pilots such as the set-up phase <strong>for</strong> the Sentinel Hotspots 4 program; and<br />
3. Operational use <strong>of</strong> EO (shown as white), such as climate modelling, the National Carbon<br />
Accounting System (NCAS), or the operational Sentinel Hotspots program.<br />
Activities that would fit into the red and blue regions in Figure 2-1 (described as 1. and 2. above) are<br />
considered in this report. The companion study CEODA-Ops (Geoscience <strong>Australia</strong>, 2011) addresses the EO<br />
data continuity needs <strong>of</strong> operational programs in <strong>Australia</strong>. Related studies, including ATSE (2009) and ACIL<br />
Tasman (2010) highlighted the significance <strong>of</strong> EO to the <strong>Australia</strong>n science community and the <strong>Australia</strong>n<br />
economy respectively (see Section 1.4).<br />
The sample set <strong>of</strong> EO-related R&D projects selected <strong>for</strong> this survey covers a diverse range <strong>of</strong> research<br />
topics, application areas, and EO data types. These projects are listed in Appendix A.<br />
The study focus has been on R&D centres with research activity that is directly related to the exploitation<br />
and application <strong>of</strong> EO data. It should be noted that EO data are key inputs to a broad range <strong>of</strong> research<br />
beyond the scope <strong>of</strong> this survey. For example, almost every meteorological research study will make use <strong>of</strong><br />
some EO data either directly in the <strong>for</strong>m <strong>of</strong> images or through the use <strong>of</strong> datasets where EO have provided<br />
the key input data into analyses and historical reanalysis datasets, assimilated into a model framework.<br />
4 Sentinel is a national bushfire monitoring system that provides timely in<strong>for</strong>mation about hotspots to emergency service managers<br />
across <strong>Australia</strong> (see: http://sentinel.ga.gov.au/acres/sentinel/index.shtml).<br />
<strong>Continuity</strong> <strong>of</strong> <strong>Earth</strong> <strong>Observation</strong> <strong>Data</strong> <strong>for</strong> <strong>Australia</strong>: R&D • January 2012 13
2.1.2 Approach<br />
Figure 2-1 Scope <strong>of</strong> Survey<br />
Only projects defined within the inner two concentric circles below are included in this survey.<br />
The very wide range and dispersed nature <strong>of</strong> the EO R&D sector in <strong>Australia</strong> led to a two-stage survey<br />
process, conducted between July and September 2011:<br />
Part 1 – Preliminary Survey<br />
The first stage <strong>of</strong> the survey identified the majority <strong>of</strong> potential survey participants from relevant Federal<br />
and State organisations, including CSIRO, academia, CRCs, defence and land management agencies, who<br />
were asked to complete Worksheets 1 and 2a <strong>of</strong> the survey spreadsheet (see Table 2-1 and Appendix C).<br />
The questions therein were directed to the managerial staff responsible <strong>for</strong> overseeing multiple EO-related<br />
R&D capabilities and projects.<br />
Projects vary substantially in size and significance across the survey sample—from a one-person research<br />
activity involving a single EOS data type, through to the R&D undertaken by the Centre <strong>for</strong> <strong>Australia</strong>n<br />
Weather and Climate <strong>Research</strong> (CAWCR) in support <strong>of</strong> the nation’s numerical weather prediction (NWP)<br />
capabilities, which involves dozens <strong>of</strong> different EOS data types and multiple researchers as well as weather<br />
applications including high impact events and applications such as rainfall estimation, fog detection, severe<br />
weather <strong>for</strong>ecast development, volcanic ash etc.<br />
An e-mail based survey was used to collate in<strong>for</strong>mation in Part 1 <strong>of</strong> the process. A total <strong>of</strong> 217 EO-related<br />
R&D projects were identified, <strong>of</strong> which 187 projects from 31 organisations were considered <strong>for</strong> inclusion in<br />
Part 2.<br />
14 <strong>Continuity</strong> <strong>of</strong> <strong>Earth</strong> <strong>Observation</strong> <strong>Data</strong> <strong>for</strong> <strong>Australia</strong>: R&D • January 2012
Part 2 – Detailed Survey<br />
CONtEXt Of CEODA-R&D SURvEy<br />
The second stage in the survey refined the study sample further to a total <strong>of</strong> 56 projects based on the<br />
possibility <strong>of</strong> documenting project characteristics and with a view to ensuring that the sample represented<br />
the full spectrum <strong>of</strong> EO-related R&D activity in <strong>Australia</strong> and the balance <strong>of</strong> activity therein. (The survey<br />
sample is fully characterised in Section 2.2).<br />
Part 2 <strong>of</strong> the process captured more detailed project in<strong>for</strong>mation using an e-mail survey directed at the<br />
research staff responsible <strong>for</strong> managing the actual projects. Respondents were asked to complete, to<br />
the extent possible, the second half <strong>of</strong> Worksheet 2, and Worksheets 3-6 (see Table 2-1 and Appendix<br />
C) ahead <strong>of</strong> an extended interview with the survey team to review the responses provided. Telephone<br />
interviews were held in most cases to verify and complete the e-mail survey tables, with face-to-face<br />
meetings being held in a few cases.<br />
The full list <strong>of</strong> survey participants is detailed in Appendix A. The survey structure is summarised in Table 2-1.<br />
Survey Stage<br />
Part 1<br />
(Preliminary)<br />
Part 2<br />
(Detailed)<br />
Survey<br />
Worksheet<br />
1<br />
Organisation<br />
In<strong>for</strong>mation<br />
2a <strong>Research</strong> Projects<br />
2b<br />
Table 2-1 Survey Approach<br />
Topic In<strong>for</strong>mation<br />
Project Outcomes,<br />
Benefits and<br />
Resources<br />
High level details <strong>of</strong> the organisation responding to the survey<br />
Listing <strong>of</strong> projects relevant to the survey within the research program and<br />
staff contact details<br />
Listing <strong>of</strong> project outcomes, societal benefits, operational linkages, staff and<br />
funding resources, and EO data importance<br />
3 Project Overview Objectives, reference material and collaboration relevant to the project<br />
4<br />
EO <strong>Data</strong><br />
Requirements<br />
5 EO <strong>Data</strong> Supply<br />
6<br />
<strong>Continuity</strong> and<br />
Future Trends<br />
2.1.3 Specific Questions<br />
Current EO data requirements, supply, and future requirements<br />
by instrument type<br />
Current EO data supply overview, agreements, calibration and validation,<br />
volumes and costs <strong>for</strong> each instrument<br />
Project continuity, emerging technology, sensor types, and potential new<br />
applications<br />
Survey respondents were asked to provide a wide range <strong>of</strong> in<strong>for</strong>mation pertaining to their current and<br />
expected usage and supply <strong>of</strong> EO data. All survey questions are detailed in Appendix C. The following<br />
sub-sections summarise the primary survey in<strong>for</strong>mation relating to data continuity as discussed in Sections<br />
3, 4 and 5.<br />
<strong>Continuity</strong> <strong>of</strong> <strong>Earth</strong> <strong>Observation</strong> <strong>Data</strong> <strong>for</strong> <strong>Australia</strong>: R&D • January 2012 15
Table 2-2 Survey Instrument Types<br />
Instrument Type Abbreviation Description and Example Applications<br />
Atmospheric chemistry instruments AC<br />
Atmospheric temperature and humidity<br />
sounders<br />
ATHS<br />
Cloud pr<strong>of</strong>ile and rain radars CPR<br />
<strong>Earth</strong> radiation budget radiometers ERBR<br />
Gravity, magnetic field and geodynamic<br />
instruments<br />
Low resolution optical sensors<br />
(> 80 m)<br />
Medium resolution optical sensors<br />
(10 m - 80 m)<br />
High resolution optical sensors<br />
(< 10 m)<br />
GRAV<br />
Hyperspectral imagers HSI<br />
Imaging multi-spectral radiometers (passive<br />
microwave)<br />
Opt-Low<br />
Opt-Med<br />
Opt-High<br />
IMS-PM<br />
16 <strong>Continuity</strong> <strong>of</strong> <strong>Earth</strong> <strong>Observation</strong> <strong>Data</strong> <strong>for</strong> <strong>Australia</strong>: R&D • January 2012<br />
Instruments that use various techniques and different<br />
parts <strong>of</strong> the electromagnetic spectrum to undertake<br />
measurements <strong>of</strong> the atmosphere’s composition.<br />
Passive measurements <strong>of</strong> the distribution <strong>of</strong> IR or microwave<br />
radiation emitted by the atmosphere, from which vertical<br />
pr<strong>of</strong>iles <strong>of</strong> temperature and humidity through the<br />
atmosphere may be obtained.<br />
Active radars at cm wavelengths <strong>for</strong> rainfall as well as very<br />
short wavelength (mm) radar (typically 94 GHz) and lidar<br />
to detect scattering from non-precipitating cloud droplets<br />
or ice particles, thereby yielding in<strong>for</strong>mation on cloud<br />
characteristics such as moisture content and base height.<br />
Instruments taking measurements <strong>of</strong> the radiation balance<br />
between the incoming radiation from the Sun and the<br />
outgoing reflected and scattered solar radiation plus the<br />
thermal infrared emission to space.<br />
Instruments and supporting systems used to derive<br />
in<strong>for</strong>mation on the <strong>Earth</strong>’s gravity field, magnetic field or<br />
geodynamic activity.<br />
Instruments that take detailed optical images <strong>of</strong> the <strong>Earth</strong>’s<br />
surface. Generally, nadir-viewing instruments with a horizontal<br />
spatial resolution in the range 1 m to 1100 m and swath<br />
widths up to thousands <strong>of</strong> kilometres.<br />
Note: the optical resolution standards from the<br />
CEODA-Ops report have been adopted <strong>for</strong> consistency<br />
between the analyses.<br />
Instruments that take optical images in many (usually 100<br />
or more), narrow, contiguous, spectral bands. Often called<br />
“imaging spectroscopy”.<br />
Operating at microwave wavelengths, these instruments use<br />
channels within 1 to 40 GHz and 80 to 100 GHz to get day/<br />
night in<strong>for</strong>mation on the <strong>Earth</strong>’s surface.<br />
imaging microwave radars (X-Band) SAR-X These instruments transmit at frequencies <strong>of</strong> around 1 to<br />
Imaging microwave radars (C-Band) SAR-C<br />
10 GHz and measure the backscattered signals to generate<br />
microwave images <strong>of</strong> the <strong>Earth</strong>’s surface at high spatial<br />
resolutions (between 10 m and 100 m), with a swath width<br />
Imaging microwave radars (L-Band) SAR-L<br />
<strong>of</strong> 100–500 km. Includes both synthetic aperture radars<br />
(SARs) and real aperture side-looking imaging radar systems.<br />
Lidars LIDAR<br />
Multiple direction/polarisation instruments MDP<br />
Ocean colour instruments OC<br />
Radar altimeters RA<br />
Scatterometers SCATT<br />
Lidars (LIght Detection And Ranging instruments) measure<br />
the radiation that is returned either from molecules and<br />
particles in the atmosphere or from the <strong>Earth</strong>’s surface when<br />
illuminated by a laser source.<br />
Instruments that are custom-built <strong>for</strong> observing the<br />
directional or polarisational characteristics <strong>of</strong> the target’s<br />
signature (either visible/IR or microwave), as a means <strong>of</strong><br />
deriving geophysical in<strong>for</strong>mation.<br />
Ocean colour radiometers and imaging spectrometers<br />
measuring the radiance leaving inland, coastal and marine<br />
waters in the visible and near IR spectrum in the range<br />
400–1000 nm, where the colour is due to constituents <strong>of</strong><br />
the water.<br />
Active sensors that use the ranging capability <strong>of</strong> radar to<br />
measure the surface topography pr<strong>of</strong>ile along the satellite<br />
track.<br />
Instrument transmits radar pulses and receives backscattered<br />
energy, the intensity <strong>of</strong> which depends on the roughness and<br />
dielectric properties <strong>of</strong> a particular target.
Importance <strong>of</strong> EO <strong>Data</strong> to <strong>Research</strong><br />
CONtEXt Of CEODA-R&D SURvEy<br />
For each research project, survey respondents were asked to rate the importance <strong>of</strong> their current usage <strong>of</strong><br />
EO data as either:<br />
• Essential – primary input in support <strong>of</strong> the project’s outcomes;<br />
• Advantageous – secondary input but is not necessary to achieve the project’s outcomes;<br />
• Opportunistic – used on an ad hoc basis; or<br />
• Promising – not currently used but could be useful in the future.<br />
Importance <strong>of</strong> Individual EO <strong>Data</strong> Types<br />
Using the CEOS Missions, Instruments and Measurements (MIM) database definitions (Table 2-2),<br />
respondents were also asked to categorise the importance <strong>of</strong> individual EO data types to their research.<br />
EO <strong>Data</strong> Usage<br />
For each data type, additional in<strong>for</strong>mation was requested regarding current usage, including:<br />
• Supply source and any substitutes available<br />
• Spatial resolution<br />
• Maximum extent <strong>of</strong> coverage<br />
• Coverage area<br />
• Number <strong>of</strong> coverages required per year<br />
• Specific regions <strong>of</strong> interest<br />
• Temporal coverage<br />
• Latency<br />
• <strong>Continuity</strong> and co-ordination requirements<br />
• Technical details<br />
• Expected data requirements in the 2-year, 5-year and 10-year timeframes; and<br />
• Assessment <strong>of</strong> whether those requirements are expected to be met.<br />
EO <strong>Data</strong> Supply<br />
The following in<strong>for</strong>mation was also requested about the supply <strong>of</strong> each data type:<br />
• Instrument name<br />
• Instrument agency<br />
• Instrument mission<br />
• Supply start and end dates<br />
• Supply agreement type<br />
• Unique agreement terms and conditions<br />
• Agreement duration<br />
• Physical supply route<br />
• Current infrastructure obstacles<br />
• Anticipated future data supply<br />
• Quality control procedures<br />
• <strong>Data</strong> volume (annual and historical); and<br />
• <strong>Data</strong> costs (annual and historical).<br />
<strong>Continuity</strong> <strong>of</strong> <strong>Earth</strong> <strong>Observation</strong> <strong>Data</strong> <strong>for</strong> <strong>Australia</strong>: R&D • January 2012 17
2.2 Survey Population<br />
Overall, the CEODA-R&D survey process identified 217 current <strong>Australia</strong>n R&D projects. The survey<br />
ultimately comprised 187 candidate R&D projects, from which 56 were chosen <strong>for</strong> more detailed<br />
investigation. The 56 sample projects are being undertaken by 31 different organisations. The size and scope<br />
<strong>of</strong> these projects varied significantly.<br />
• Academic Institutions (universities);<br />
• <strong>Research</strong> Organisations (focused primarily on research and development, such as CSIRO, CRCs,<br />
CAWCR and WIRADA);<br />
• Federal Agencies (undertaking both operational activities and some in-house research); and<br />
• State Agencies (undertaking both operational activities and some in-house research).<br />
The breakdown <strong>of</strong> organisations included in this survey, and the number <strong>of</strong> projects surveyed from each, are<br />
detailed <strong>for</strong> each <strong>of</strong> these four types <strong>of</strong> research establishment in Tables 2-3 to 2-6 respectively. A list <strong>of</strong> all<br />
surveyed projects is given in Appendix A.<br />
The proportion <strong>of</strong> surveyed projects from each type <strong>of</strong> research establishment is shown in Figure 2-2.<br />
Table 2-3 Academic Institutions Surveyed<br />
Organisation State Part 1 Projects Part 2 Projects<br />
<strong>Australia</strong>n National University (ANU) ACT 3 1<br />
Charles Darwin University (CDU) NT 2 1<br />
Charles Sturt University (CSU) NSW 4 1<br />
Curtin University WA 8 1<br />
Monash University VIC 10 2<br />
University <strong>of</strong> Adelaide (UAdel) SA 7 2<br />
University <strong>of</strong> New South Wales (UNSW) NSW 4 2<br />
University <strong>of</strong> Queensland (UQ) QLD 5 1<br />
University <strong>of</strong> Sydney (USyd) NSW 5 1<br />
University <strong>of</strong> Tasmania (UTas) TAS 6 2<br />
University <strong>of</strong> Technology Sydney (UTS) NSW 8 1<br />
University <strong>of</strong> Wollongong (UoW) NSW 5 1<br />
Total 67 16<br />
Table 2-4 <strong>Research</strong> Organisations Surveyed<br />
Organisation State Part 1 Projects Part 2 Projects<br />
Antarctic Climate & Ecosystems CRC (CRC ACE) TAS 2 1<br />
Centre <strong>for</strong> <strong>Australia</strong>n Weather and Climate <strong>Research</strong><br />
(CAWCR)<br />
18 <strong>Continuity</strong> <strong>of</strong> <strong>Earth</strong> <strong>Observation</strong> <strong>Data</strong> <strong>for</strong> <strong>Australia</strong>: R&D • January 2012<br />
VIC 4 2<br />
CRC <strong>for</strong> Spatial In<strong>for</strong>mation (CRCSI) VIC 1 1<br />
CSIRO Ecosystems Sciences VIC 8 1<br />
CSIRO <strong>Earth</strong> Science and Resource Engineering WA 9 3<br />
CSIRO Land and Water ACT, TAS 6 5<br />
CSIRO Marine and Atmospheric <strong>Research</strong> ACT, TAS 11 5<br />
Total 41 18
Table 2-5 Federal Agencies Surveyed<br />
CONtEXt Of CEODA-R&D SURvEy<br />
Organisation State Part 1 Projects Part 2 Projects<br />
<strong>Australia</strong>n Antarctic Division (AAD) TAS 7 1<br />
<strong>Australia</strong>n Bureau <strong>of</strong> Agricultural and Resource Economics and<br />
Sciences (ABARES)<br />
ACT 4 1<br />
<strong>Australia</strong>n Institute <strong>of</strong> Marine Science (AIMS) QLD 3 1<br />
Defence Science and Technology Organisation (DSTO) SA 5 2<br />
Geoscience <strong>Australia</strong> (GA) ACT 10 5<br />
Total 29 10<br />
Table 2-6 State Agencies Surveyed<br />
Organisation State Part 1 Projects Part 2 Projects<br />
Department <strong>of</strong> Sustainability and Environment (DSE) VIC 9 1<br />
Department <strong>of</strong> Employment, Economic Development and<br />
Innovation (DEEDI)<br />
Department <strong>of</strong> Environment and Resource Management<br />
(DERM)<br />
QLD 2 1<br />
QLD 16 2<br />
Department <strong>of</strong> Primary Industries (Vic DPI) VIC 6 3<br />
Landgate WA 12 3<br />
Office <strong>of</strong> Environment and Heritage (OEH) NSW 4 1<br />
Parks Victoria VIC 1 1<br />
Total 50 12<br />
Figure 2-2 Surveyed Projects by <strong>Research</strong> Establishment Type<br />
a. Part 1 (Preliminary Survey) Projects b. Part 2 (Detailed Survey)Projects<br />
As illustrated in Figure 2-3, survey results would suggest that, <strong>for</strong> the survey sample, academic institutions<br />
and State agencies currently conduct a greater proportion <strong>of</strong> low budget EO-related R&D projects, with<br />
lower staffing levels (see Figure 2-4), than research organisations and Federal agencies with in-house<br />
R&D activities.<br />
<strong>Research</strong> organisations have the greatest proportion <strong>of</strong> large budget projects and the highest staffing levels<br />
(see Figure 2-4), while the research projects being conducted by Federal agencies are more evenly spread<br />
over all budget ranges.<br />
Interestingly, half the projects within Federal and State agencies, as well as nearly 40% in academic<br />
institutions, were specified as ongoing (see Figure 2-5), compared to less than 20% in research organisations.<br />
The majority <strong>of</strong> surveyed projects in research organisations are currently funded <strong>for</strong> four to six years.<br />
<strong>Continuity</strong> <strong>of</strong> <strong>Earth</strong> <strong>Observation</strong> <strong>Data</strong> <strong>for</strong> <strong>Australia</strong>: R&D • January 2012 19
Figure 2-3 Annual Project Budgets<br />
Figure 2-4 Average Annual Project Staffing<br />
20 <strong>Continuity</strong> <strong>of</strong> <strong>Earth</strong> <strong>Observation</strong> <strong>Data</strong> <strong>for</strong> <strong>Australia</strong>: R&D • January 2012
2.3 Benefits <strong>of</strong> R&D<br />
2.3.1 Societal Benefit Areas<br />
Figure 2-5 Project Duration<br />
CONtEXt Of CEODA-R&D SURvEy<br />
Survey respondents were asked to select up to three Societal Benefit Areas (SBAs) that were considered<br />
relevant to their project. As detailed in Table 2-7, the definition <strong>of</strong> SBAs is consistent with that used by the<br />
Group on <strong>Earth</strong> <strong>Observation</strong>s (GEO) <strong>for</strong> the Global <strong>Earth</strong> <strong>Observation</strong> System <strong>of</strong> Systems (GEOSS).<br />
The Ecosystems SBA was cited as relevant to over half the sample projects, with Agriculture, Climate,<br />
and Water being considered relevant to a little less than half. The SBAs <strong>of</strong> Biodiversity and Disaster were<br />
relevant to about 30% <strong>of</strong> the projects, while Weather, Energy and Health were only relevant to around 10%<br />
<strong>of</strong> projects. These results reflect the importance <strong>of</strong> EO data in understanding and monitoring the <strong>Australia</strong>n<br />
landscape, and also highlight those application areas where its value is already well established, as well as<br />
being indicative <strong>of</strong> the current diversity and emphasis <strong>of</strong> EO-related research in <strong>Australia</strong>.<br />
Survey respondents were also asked to list any other areas <strong>of</strong> benefit that were relevant to their research.<br />
These responses identified four additional benefit areas from EO-related R&D, namely Defence (three<br />
projects), Transport (three projects), and Minerals (two projects).<br />
<strong>Continuity</strong> <strong>of</strong> <strong>Earth</strong> <strong>Observation</strong> <strong>Data</strong> <strong>for</strong> <strong>Australia</strong>: R&D • January 2012 21
Table 2-7 Societal Benefit Area (SBA) Definitions<br />
Societal Benefit Area Description<br />
Ecosystems<br />
Agriculture<br />
Climate<br />
Water<br />
Biodiversity<br />
Disasters<br />
Weather<br />
Energy<br />
Health<br />
2.3.2 National Significance<br />
Monitor and evaluate ecosystem health, function and change <strong>of</strong> coastal and nearshore<br />
marine systems, <strong>for</strong>ests, inland water, oceanic islands and archipelagos, tundra,<br />
and watersheds.<br />
Support local, national and regional activities <strong>for</strong> agriculture, rangelands, <strong>for</strong>estry<br />
and fisheries, including famine early warning, food security prediction, drought<br />
<strong>for</strong>ecasting, agriculture production and <strong>for</strong>ecasting, aquaculture production, timber,<br />
fuel and fibre management, <strong>for</strong>est perturbations and protection, carbon and<br />
biomass estimation.<br />
Model, mitigate, adapt and assess risks <strong>of</strong> climate change <strong>for</strong> atmosphere, lands<br />
and oceans.<br />
Monitor terrestrial hydrology <strong>of</strong> surface waters, ground waters, <strong>for</strong>cings, water<br />
quality, and water usage.<br />
Assess condition and extent <strong>of</strong> ecosystems, distribution and status <strong>of</strong> species, and<br />
genetic diversity in key populations, as well as tracking invasive species.<br />
Predict and monitor earthquakes, floods, landslides, cyclones, volcanic eruptions,<br />
and wildfires.<br />
Improve weather in<strong>for</strong>mation, <strong>for</strong>ecasting and warning using numerical weather<br />
prediction (global and regional), synoptic, aeronautical and agricultural meteorology,<br />
and atmospheric chemistry.<br />
Assess viability <strong>of</strong> renewable energy sources, including hydropower, wind power,<br />
bioenergy, solar power, geothermal power.<br />
Monitor aeroallergens, air quality, and infectious diseases, and provide early warning<br />
<strong>for</strong> public health risks such as heat waves and epidemic pre-conditions.<br />
22 <strong>Continuity</strong> <strong>of</strong> <strong>Earth</strong> <strong>Observation</strong> <strong>Data</strong> <strong>for</strong> <strong>Australia</strong>: R&D • January 2012<br />
Relevance to<br />
Projects<br />
Apart from providing important scientific advances and innovations, the majority <strong>of</strong> surveyed projects also<br />
support a range <strong>of</strong> social, security, environmental and economic outcomes and needs within <strong>Australia</strong>. They<br />
encompass a broad range <strong>of</strong> objectives and applications, as summarised in Table 2-8. These national benefit<br />
areas rein<strong>for</strong>ce the relevance <strong>of</strong> EO-related research in <strong>Australia</strong> to the SBAs cited in Section 2.3.1.<br />
34<br />
27<br />
24<br />
22<br />
17<br />
17<br />
7 1<br />
6<br />
4
Table 2-8 National Benefits and Significance <strong>of</strong> Surveyed Projects<br />
CONtEXt Of CEODA-R&D SURvEy<br />
National Benefit Significance Establishment<br />
Improved weather <strong>for</strong>ecasting<br />
and public safety warnings from<br />
extreme weather events<br />
Monitor aerosols and cloud<br />
Climate modelling<br />
Antarctic monitoring and<br />
surveillance<br />
Improved gravity models<br />
Ocean <strong>for</strong>ecasting and<br />
surveillance<br />
Coastal monitoring<br />
Standardised, continental/<br />
hemispheric EOS products<br />
Early detection <strong>of</strong><br />
environmental problems<br />
Highlighting and quantifying<br />
environmental changes<br />
International Forest Carbon<br />
Initiative<br />
Estimate bushfire threats<br />
and emissions<br />
Flood disaster mapping<br />
Sparseness <strong>of</strong> surface weather data in the Southern Hemisphere<br />
makes EOS data sources particularly valuable. It is EO usage that<br />
has resulted in vast improvements in weather <strong>for</strong>ecast accuracy so<br />
that there is little hemispheric difference in skill.<br />
Enhanced weather understanding <strong>of</strong> aerosol and cloud processes,<br />
model validation, wind erosion and dust storms<br />
EO provides a growing number (currently about 30) <strong>of</strong> key data<br />
streams needed by modern numerical weather models. <strong>Research</strong><br />
including refining model boundary conditions, quality control and<br />
production <strong>of</strong> new data inputs to climate models<br />
(i.e. soil moisture, sea surface temperature, ocean current heat<br />
transfer, emissivity, ocean current heat transfer, land-surface<br />
dynamics, etc.)<br />
Applications <strong>of</strong> EO <strong>for</strong> high impact weather is critical <strong>for</strong> the<br />
analysis and short term prediction <strong>of</strong> high impact weather including<br />
fog, volcanic ash, severe thunderstorms<br />
Monitoring global climate variability, monitoring <strong>of</strong> ice and glacier<br />
thickness and dynamics, assessment <strong>of</strong> current and potential<br />
sea-level rise, flora and habitat monitoring, exercise <strong>of</strong> <strong>Australia</strong>n<br />
Antarctic sovereignty claims, <strong>for</strong>ecast support to AAD operations<br />
More detailed mapping <strong>of</strong> <strong>Earth</strong>’s crust, soil moisture dynamics at<br />
basin scales, detection <strong>of</strong> unique mineral deposits<br />
Support safety <strong>of</strong> Defence and civil shipping, sea level rise, ocean<br />
ecosystem activity, standardisation <strong>of</strong> ocean datasets<br />
Coastal water quality, coastal habitat change monitoring, sea-level<br />
measurement and calibration, improved tidal modelling, monitoring<br />
<strong>of</strong> the condition <strong>of</strong> the Great Barrier, Ningaloo and other reef<br />
systems<br />
Monitoring land cover and condition, collecting sea surface Cal/Val<br />
measurements <strong>for</strong> one eighth <strong>of</strong> the <strong>Earth</strong>’s surface<br />
Such as coral bleaching, wetland health, woody weed extent,<br />
droughts and vegetation dryness<br />
Monitoring natural resources and support <strong>for</strong> legislated monitoring<br />
systems, environmental change assessment in support <strong>of</strong> major<br />
infrastructure works<br />
Allows <strong>Australia</strong> and regional neighbours to participate in new<br />
international climate-related agreements and incentive mechanisms<br />
related to <strong>for</strong>est carbon<br />
Support emergency management, soil moisture, fuel loading<br />
,carbon emissions reporting, seasonal fire <strong>for</strong>ecast and assessment,<br />
hot spot monitoring<br />
Disaster risk assessment, improved emergency response activities<br />
and support aftermath, flood risk assessment and response<br />
planning <strong>for</strong> isolated communities<br />
CAWCR, BoM<br />
CSIRO, BoM<br />
CAWCR, BoM, UTS,<br />
MonashU, BLUELink, IMOS<br />
AAD, CRC ACE, UTas<br />
ANU<br />
CAWCR, BoM, BLUELink,<br />
CSIRO, IMOS, UTas<br />
CSIRO, IMOS, UTas,<br />
CurtinU<br />
AusCover TERN, GA,<br />
IMOS, CurtinU<br />
AIMS, OEH, Parks Victoria,<br />
Vic DPI<br />
UQ, OEH, DSE, ABARES,<br />
UAdel, CSIRO<br />
CSCSI, DCCEE, UNSW,<br />
CSIRO<br />
GA, BoM, CDU, Landgate<br />
GA, Landgate, DERM,<br />
UoW, MonashU, WIRADA<br />
Improved geological models Support <strong>of</strong> resource exploration and mining USyd, GA, CSIRO<br />
Improved geophysical<br />
measurements<br />
Assess irrigation water<br />
usage, productivity and weed<br />
infestation in agriculture<br />
Quantify groundwater and<br />
surface water extent and<br />
volumes<br />
Inland water quality monitoring<br />
Locate groundwater sources and quantify changes<br />
More efficient use <strong>of</strong> agricultural resources, reduced chemical<br />
management, and greater productivity CSU, DSE, DEEDI, CSIRO<br />
Map flood extent, soil moisture, monitor evapotranspiration and<br />
vegetation response to climate change<br />
Feasibility study <strong>for</strong> operational earth observation <strong>of</strong> inland water<br />
quality in response to monitoring requirements<br />
<strong>Continuity</strong> <strong>of</strong> <strong>Earth</strong> <strong>Observation</strong> <strong>Data</strong> <strong>for</strong> <strong>Australia</strong>: R&D • January 2012 23<br />
GA<br />
CSIRO, BoM, UNSW,<br />
MonashU, Landgate<br />
CSIRO
2.3.3 Linkages to Operational Programs<br />
The CEODA-Ops Report (Geoscience <strong>Australia</strong>, 2011) listed 91 5 operational EO programs currently<br />
being undertaken in <strong>Australia</strong> (see Appendix B). These were referenced in the CEODA-R&D survey to<br />
demonstrate the linkages between current R&D projects and operational outcomes. Survey respondents<br />
were asked to select up to three <strong>of</strong> these operational programs that were related to their projects. During<br />
the survey process, ten additional programs were identified to produce a final list <strong>of</strong> 101 operational<br />
programs (see Appendix B <strong>for</strong> details) that are related to the surveyed R&D projects.<br />
Over 70% <strong>of</strong> the R&D projects surveyed cited one or more linkages to 60 <strong>of</strong> these current operational<br />
programs. Those programs supported by multiple research projects are listed in Table 2-9.<br />
It should be noted that AusCover TERN and the Centre <strong>for</strong> Weather and Climate <strong>Research</strong> (CAWCR)<br />
were included in both the CEODA-Ops list <strong>of</strong> operational programs and the CEODA-R&D survey. These<br />
projects are unique in that they involve the joint establishment <strong>of</strong> research infrastructure and EO data<br />
centres to support both research and operational activities. As such, the two surveys address different<br />
aspects <strong>of</strong> their work.<br />
Those operational programs that are most supported by the surveyed R&D projects involve large area<br />
monitoring and/or modelling <strong>of</strong> environmental resources. In particular, EO-dependent programs that involve<br />
legislative monitoring, such as the National Carbon Accounting System (NCAS), have been developed from,<br />
and continue to be refined by, <strong>Australia</strong>n R&D projects. <strong>Australia</strong> is now a world leader in carbon accounting<br />
and shares this expertise with the global community through agreements such as the International Forest<br />
Carbon Initiative (IFCI) and co-leadership <strong>of</strong> the GEO Forest Carbon Tracking task and associated Global<br />
Forest <strong>Observation</strong> Initiative (GFOI).<br />
Many <strong>of</strong> the methodologies being used in operational programs are also derived from R&D projects that<br />
are initiated without direct operational linkages. The Sentinel Hotspots program, <strong>for</strong> example, which was<br />
based on the adaptation <strong>of</strong> international fire detection systems (Dyce et al., 2004), was conceptualised by<br />
CSIRO and the Defence Imagery and Geospatial Organisation, and implemented in collaboration with GA.<br />
This <strong>Australia</strong>n expertise has also been used to help set up the multi-hazard Sentinel Asia program (Held<br />
and Kaku, 2007). Similarly, the successful Statewide Landcover and Tree Survey (SLATS) program initiated<br />
in Queensland is being adapted <strong>for</strong> use in NSW and Victoria. State agencies are generally focused on<br />
implementation, rather than development, <strong>of</strong> original methodologies <strong>for</strong> operational use, and rely on the<br />
results <strong>of</strong> R&D projects to direct their implementations.<br />
5 Program 26 was not included in this list due to insufficient EOS data usage.<br />
24 <strong>Continuity</strong> <strong>of</strong> <strong>Earth</strong> <strong>Observation</strong> <strong>Data</strong> <strong>for</strong> <strong>Australia</strong>: R&D • January 2012
Table 2-9 Operational Programs Supported by Multiple Surveyed Projects<br />
CONtEXt Of CEODA-R&D SURvEy<br />
Operational Program Jurisdiction Number <strong>of</strong> Surveyed Projects<br />
AusCover TERN DIISR 8<br />
<strong>Australia</strong>n Antarctic Division, <strong>Australia</strong>n Antarctic <strong>Data</strong> Centre DEWHA 4<br />
Caring For Our Country DAFF 4<br />
Centre <strong>for</strong> Weather and Climate <strong>Research</strong> (CAWCR) DIISR/DSEWPC 4<br />
State <strong>of</strong> Environment (SOE) DEWHA 4<br />
<strong>Australia</strong>n Collaborative Land Use Mapping Program (ACLUMP) DAFF 3<br />
Biomass Monitoring QLD 3<br />
Emergency Management <strong>Australia</strong> AGD 3<br />
National Plan <strong>for</strong> Environmental In<strong>for</strong>mation DSEWPC 3<br />
Statewide Landcover and Tree Study (SLATS) QLD 3<br />
BLUELink DSEWPC/Defence /<br />
DIISR<br />
DEM (Digital Elevation Model) and Surface Modelling ANZLIC 2<br />
Evapo-transpiration Modelling VIC 2<br />
FireWatch Program WA 2<br />
Groundcover Monitoring QLD 2<br />
International Forest Carbon Initiative (IFCI) DCCEE 2<br />
National Carbon Accounting System (NCAS) DCCEE 2<br />
National Forest Inventory DAFF 2<br />
National Land and Water Resources Audit DAFF 2<br />
National Land Cover Mapping RET 2<br />
National Weather and Climate DEWHA 2<br />
Pre-competitive Mineral Prospecting <strong>Research</strong> RET 2<br />
Queensland Wetland mapping and Classification QLD 2<br />
Satellite Altimetry DEWHA 2<br />
Sea Surface Temperature and Height Anomaly NSW 2<br />
2.3.4 Operational Outcomes<br />
A wide range <strong>of</strong> future operational outcomes is expected to emerge from the research currently being<br />
undertaken by the survey population. Future operational outcomes cited by respondents are summarised in<br />
Table 2-10. The diversity, and national significance, <strong>of</strong> these outcomes clearly demonstrate the value <strong>of</strong> this<br />
research.<br />
<strong>Continuity</strong> <strong>of</strong> <strong>Earth</strong> <strong>Observation</strong> <strong>Data</strong> <strong>for</strong> <strong>Australia</strong>: R&D • January 2012 25<br />
2
Table 2-10 Future Operational Outcomes from Surveyed Projects<br />
Application Area Operational Outcomes Essential EO <strong>Data</strong> Types<br />
Oceanography<br />
Coastal<br />
Meteorology<br />
Glaciology<br />
Hydrology<br />
Geology<br />
Submarine detection; fishing surveillance;<br />
ocean weather alerts<br />
Sea surface topography, tidal modelling,<br />
tsunami warnings<br />
Sea surface temperature, coral health<br />
warnings, ocean colour<br />
26 <strong>Continuity</strong> <strong>of</strong> <strong>Earth</strong> <strong>Observation</strong> <strong>Data</strong> <strong>for</strong> <strong>Australia</strong>: R&D • January 2012<br />
Low Resolution Optical, Radar Altimeters, in situ<br />
Passive Microwave, Radar Altimeters, in situ<br />
Monitoring seagrass health/extent High Resolution Optical<br />
Systematic shallow coastal bathymetry/<br />
vegetation mapping<br />
<strong>Earth</strong> radiation budget radiometers, Low Resolution Optical,<br />
Ocean Colour Instruments, in situ<br />
Low Resolution Optical, Medium Resolution Optical, High<br />
Resolution Optical, Hyperspectral, Ocean Colour Instruments<br />
Routine water quality monitoring Low Resolution Optical, Ocean Colour Instruments<br />
Dust warnings;<br />
Improved weather <strong>for</strong>ecasting and<br />
climate modelling<br />
Cloud pr<strong>of</strong>ile and rain radars, Lidar, Multiple Direction/<br />
Polarisation Instruments<br />
Atmospheric chemistry instruments, atmospheric temperature<br />
and humidity sounders, cloud pr<strong>of</strong>ile and rain radars, Low<br />
Resolution Optical, passive microwave, Lidar, multiple direction/<br />
polarisation instruments, Radar Altimeters, Scatterometers<br />
Atmospheric correction models Multi-direction polarisation instruments, in situ<br />
Monitoring velocity fields <strong>of</strong> glaciers and<br />
ice sheets<br />
Improved precipitation, flood <strong>for</strong>ecasting,<br />
drought monitoring<br />
SAR (C-band)<br />
Passive Microwave, SAR (L-band), in situ<br />
Monthly evapotranspiration estimate Low Resolution Optical, High Resolution Optical, in situ<br />
Improved management <strong>of</strong> water<br />
resources from eco-hydrological<br />
dynamics<br />
Catchment scale changes in total water<br />
storage <strong>for</strong> water accounting<br />
Mapping surface permeability<br />
Routine monitoring <strong>of</strong> inland water<br />
quality<br />
Map paleovalleys <strong>for</strong> groundwater<br />
locations in arid and semi-arid <strong>Australia</strong><br />
Understanding plate tectonics<br />
Quantifying methane gas emissions and<br />
other pollutants from mining<br />
3D mineral maps (sub-surface and<br />
surface mineralogy)<br />
Low Resolution Optical<br />
Gravity instruments<br />
Medium Resolution Optical, High Resolution Optical,<br />
Hyperspectral, in situ<br />
Low Resolution Optical, Medium Resolution Optical, High<br />
Resolution Optical, Hyperspectral, Ocean Colour Instruments<br />
Low Resolution Optical, Radar Altimeters<br />
Radar Altimeters; gravity, magnetic field and geodynamic<br />
instruments<br />
High Resolution Optical, Hyperspectral, in situ<br />
Atmospheric chemistry instruments, Medium Resolution Optical,<br />
High Resolution Optical, Hyperspectral, in situ<br />
Characterising soil types High Resolution Optical, Hyperspectral, in situ<br />
Integrated, continental GIS <strong>for</strong> <strong>Australia</strong>n<br />
lithosphere <strong>for</strong> mineral exploration<br />
Medium Resolution Optical; High Resolution Optical;<br />
Hyperspectral; gravity magnetic field, and geodynamic<br />
instruments; in situ
Table 2-10 (continued)<br />
CONtEXt Of CEODA-R&D SURvEy<br />
Application Area Operational Outcomes Essential EO <strong>Data</strong> Types<br />
Disasters<br />
Agriculture<br />
Carbon<br />
Surface water mapping, flood mapping,<br />
cloud mapping,<br />
Automated feature extraction <strong>for</strong> flood<br />
lines and fire scars<br />
Monitor fire occurrence and spread Low Resolution Optical<br />
Monitor live fuel moisture to assess fire<br />
risk and drought status<br />
Low Resolution Optical, Medium Resolution Optical<br />
Low Resolution Optical, Medium Resolution Optical<br />
Low Resolution Optical<br />
Monitor oil slicks Low Resolution Optical, Medium Resolution Optical, SAR<br />
Paddock to plate tracking <strong>of</strong> products,<br />
crop auditing, regional yield and<br />
variability predictions,<br />
Monitor water requirements and usage<br />
in irrigated crops<br />
Medium Resolution Optical, High Resolution Optical, in situ<br />
Medium Resolution Optical<br />
Carbon Accounting Low Resolution Optical, Medium Resolution Optical<br />
Measuring biosequestration High Resolution Optical<br />
Monitoring <strong>for</strong>est extent <strong>for</strong> biomass<br />
and carbon estimates<br />
Estimating emissions from bushfires in<br />
tropical savannahs<br />
Medium Resolution Optical, SAR (all, especially L-band), in situ<br />
Low Resolution Optical, Medium Resolution Optical<br />
Land Use Land Use In<strong>for</strong>mation Systems Low Resolution Optical, Medium Resolution Optical<br />
Land Degradation Monitoring soil erosion risk Low Resolution Optical<br />
Wetlands<br />
Vegetation<br />
Cartography<br />
Sensor and Plat<strong>for</strong>m<br />
Design and Validation<br />
Monitor inundation extent, identify<br />
ecologically significant wetlands<br />
SAR (L-band)<br />
Operational monitoring <strong>of</strong> wetlands Medium Resolution Optical<br />
Automated large area monitoring <strong>of</strong><br />
vegetation components, assessing impact<br />
<strong>of</strong> land management regimes<br />
Monitoring <strong>for</strong>est extent and disturbance<br />
Fractional cover modelling and dynamic<br />
land cover classification<br />
Medium Resolution Optical, Lidar, in situ<br />
Low Resolution Optical, Medium Resolution Optical, High<br />
Resolution Optical, Lidar, in situ<br />
Low Resolution Optical, Medium Resolution Optical, in situ,<br />
atmospheric measurements<br />
Monitoring groundcover in rangelands Low Resolution Optical, Medium Resolution Optical, in situ<br />
Mapping weed species High Resolution Optical, in situ<br />
National, standardised biophysical<br />
products <strong>for</strong> terrestrial applications<br />
Enhanced automation <strong>of</strong> feature<br />
extraction <strong>for</strong> mapping and change<br />
detection<br />
UAV functionality <strong>for</strong> low cost, flexible<br />
local area monitoring and/or Cal/Val<br />
Low Resolution Optical, Medium Resolution Optical, High<br />
Resolution Optical, Hyperspectral, SAR (L-band), Lidar, in situ<br />
High Resolution Optical, Lidar<br />
High Resolution Optical, Hyperspectral, Lidar, Radar Altimeter,<br />
in situ<br />
Monitoring Antarctica High Resolution Optical, Lidar, Radar Altimeter, in situ<br />
Health applications e.g. pollen warnings Low Resolution Optical, Medium Resolution Optical<br />
<strong>Continuity</strong> <strong>of</strong> <strong>Earth</strong> <strong>Observation</strong> <strong>Data</strong> <strong>for</strong> <strong>Australia</strong>: R&D • January 2012 27
Anticipated operational improvements in the following areas are expected to have particular benefit<br />
<strong>for</strong> <strong>Australia</strong>:<br />
• Maritime <strong>for</strong>ecasting—this is expected to mimic the development <strong>of</strong> weather <strong>for</strong>ecasting in the last<br />
few decades;<br />
• Climate modelling and carbon accounting—both domestically and internationally to support the<br />
National Carbon Accounting System (NCAS), Indonesian National Carbon Accounting System<br />
(INCAS) and International Forest Carbon Initiative (IFCI);<br />
• Routine weather <strong>for</strong>ecasting, high impact weather detection and nowcasting, climate monitoring,<br />
disaster monitoring, aviation safety, and carbon policy implementation;<br />
• Water resource management—reliable long-term models <strong>of</strong> eco-hydrological factors, including<br />
evapo-transpiration, surface water and vegetation dynamics;<br />
• Disaster mitigation and management—early detection and rapid response <strong>for</strong> fires and floods;<br />
• Early warning <strong>for</strong> coral reef stress;<br />
• Dust warnings and soil erosion risk assessment based on improved atmospheric and soil moisture<br />
measurements;<br />
• Agricultural <strong>for</strong>ecasting <strong>for</strong> yield, irrigation needs, risks and variability;<br />
• Inland water quality monitoring in response to legislative requirements;<br />
• Coastal monitoring <strong>of</strong> both water quality and habitat health, shallow water bathymetry; and<br />
• Geoscience mapping <strong>for</strong> mineral exploration, groundwater locations and land management.<br />
Several <strong>of</strong> these operational areas have progressed rapidly over recent decades and can be expected to<br />
develop further with access to improved EO datasets. Many <strong>of</strong> these areas involve commercial benefits and/<br />
or legislative requirements, and several methodologies have been exported <strong>for</strong> use overseas.<br />
2.3.5 Collaboration<br />
Survey results relating to interactions between projects and researchers and access to restricted EO data<br />
(in the sense that the data were only available to certain activities <strong>for</strong> a defined period) are summarised in<br />
Table 2-11.<br />
Table 2-11 Project Collaboration<br />
Type <strong>of</strong> Collaboration Number <strong>of</strong> Surveyed Projects % Projects<br />
Part <strong>of</strong> Larger and/or External Program 43 77%<br />
Domestic Collaboration 53 95%<br />
International Collaboration 41 73%<br />
Access to Restricted <strong>Data</strong>sets 23 41%<br />
The significant extent <strong>of</strong> current domestic collaboration indicates that the majority <strong>of</strong> these research<br />
activities are not being conducted in isolation. These connections between researchers should reduce<br />
duplication <strong>of</strong> ef<strong>for</strong>t, and allow more efficient use <strong>of</strong> data and equipment.<br />
Over three-quarters <strong>of</strong> <strong>Australia</strong>n researchers surveyed are also actively connected to international research<br />
activities, with 20 having <strong>for</strong>mal membership <strong>of</strong> international science teams. Considering the need to<br />
access primarily <strong>for</strong>eign satellite data <strong>for</strong> research, it is no surprise to see the strong international linkages<br />
used by most R&D teams. For the surveyed projects, these connections between <strong>Australia</strong>n scientists and<br />
international space agencies are summarised in Table 2-12.<br />
28 <strong>Continuity</strong> <strong>of</strong> <strong>Earth</strong> <strong>Observation</strong> <strong>Data</strong> <strong>for</strong> <strong>Australia</strong>: R&D • January 2012
Table 2-12 International Space Agency Connections to Surveyed Projects<br />
CONtEXt Of CEODA-R&D SURvEy<br />
Agency Linkages with Surveyed Projects Principal Investigator/Mission Team<br />
NASA (USA) 14 10<br />
ESA (Europe) 10 6<br />
JAXA (Japan) 9 1<br />
ISRO (India) 5 1<br />
CNES (France) 3 1<br />
CSA (Canada) 3 1<br />
DLR (Germany) 3 0<br />
USGS (USA) 3 0<br />
GISTDA (Thailand) 1 0<br />
NOAA (USA) 1 0<br />
TOTAL 52 16<br />
In addition, several projects have linkages with other international bodies:<br />
• 22 projects cited collaboration with 33 overseas universities and/or research organisations;<br />
• 17 projects are working with 17 international partnerships (such as WMO);<br />
• Eight projects are collaborating with 14 <strong>for</strong>eign government agencies (such as the British Geological<br />
Survey); and<br />
• Five projects are collaborating with seven <strong>for</strong>eign corporations (such as US company ITT).<br />
By virtue <strong>of</strong> these various connections, 20 (36%) <strong>of</strong> the surveyed research projects gain access to EO<br />
datasets that are not publicly available.<br />
<strong>Australia</strong>’s involvement with these international partners includes exporting methodologies <strong>for</strong> using<br />
EO data, designing sensor components <strong>for</strong> <strong>for</strong>thcoming space missions, and calibration and validation<br />
activities <strong>for</strong> new sensors. The latter is seen by many researchers to be <strong>Australia</strong>’s major contribution to the<br />
international EO community.<br />
2.4 Major Projects<br />
To avoid the potential <strong>for</strong> bias in analysing survey results, the magnitude <strong>of</strong> some surveyed projects warrants<br />
particular consideration. One key complication in analysis <strong>of</strong> these projects, however, has been the need to<br />
decide what proportion <strong>of</strong> the work and resources are truly dedicated to R&D and quality control activities,<br />
versus basic operation <strong>of</strong> data access and delivery systems to other operational or external research<br />
programs. Selected characteristics <strong>for</strong> the 13 largest projects are summarised in Table 2-13.<br />
It should be recognised that these major projects will be amongst the heaviest users <strong>of</strong> EO data in the<br />
country. For the sake <strong>of</strong> simplicity and to avoid debate over relative importance or ranking <strong>of</strong> one activity<br />
over another, the study has not weighted the analysis <strong>of</strong> data usage based on data volumes. Rather<br />
each project is given equal weight, and readers can draw their own conclusions based on the extensive<br />
in<strong>for</strong>mation presented regarding the purpose <strong>of</strong> the underlying research and the related national outcomes<br />
and benefits. This does have a bearing on the nature <strong>of</strong> the conclusions regarding Priority <strong>Data</strong> Types<br />
in Section 3. Meteorology and climate research at BoM and CAWCR are the heaviest data users in<br />
the country, and accordingly atmospheric measurements – such as from IR sounders – would receive a<br />
significantly higher priority than in our analysis, were the results weighted. Instead it is seen that there are not<br />
a large number <strong>of</strong> users outside the focused weather and climate community. Their particular needs are the<br />
proposed focus <strong>of</strong> a further report in the CEODA series.<br />
<strong>Continuity</strong> <strong>of</strong> <strong>Earth</strong> <strong>Observation</strong> <strong>Data</strong> <strong>for</strong> <strong>Australia</strong>: R&D • January 2012 29
On the basis <strong>of</strong> their resources, duration, data usage, collaboration and nationally significant operational<br />
outcomes, six <strong>of</strong> these projects were deemed major, namely AusCover tERN, BLUELink, iMOS, Joint Remote<br />
Sensing <strong>Research</strong> Centre, Numerical Weather Prediction, and Other Meteorological <strong>Research</strong>. These will be<br />
referred to as the CEODA-R&D Major Projects in subsequent sections <strong>of</strong> this report.<br />
Project<br />
Numerical Weather<br />
Prediction<br />
Approximate<br />
Annual Budget<br />
($ million)<br />
Table 2-13 Large and Significant Projects in Survey<br />
Duration<br />
(years)<br />
Annual<br />
Staffing<br />
(FTE)<br />
30 <strong>Continuity</strong> <strong>of</strong> <strong>Earth</strong> <strong>Observation</strong> <strong>Data</strong> <strong>for</strong> <strong>Australia</strong>: R&D • January 2012<br />
Essential EO<br />
<strong>Data</strong> Types<br />
5 1974-ongoing 19 9<br />
Domestic Collaboration<br />
BoM, University <strong>of</strong> Melbourne,<br />
Macquarie University, RMIT<br />
BLUELink 4 2002-2014 8.5 2 BoM, CSIRO, Navy<br />
AusCover TERN 2 2009-2014 10 6<br />
Other<br />
Meteorological<br />
<strong>Research</strong><br />
2 1974-ongoing 8 9<br />
IMOS 2 2007-2013 2 4<br />
Unlocking the<br />
Landsat Archive<br />
Virtual Geological<br />
Observatory<br />
(VirGO)<br />
1+ 2011-2013 9 2<br />
1+ 2003-present 8 3<br />
GA, ABARES, ERIN-SEWPaC, Curtin<br />
University, RMIT, UQ, UTS, UAdel,<br />
CDU, QDERM, BoM, CSIRO<br />
BoM, University <strong>of</strong> Melbourne,<br />
Macquarie University, RMIT<br />
WASTAC, BoM, GA, AIMS, CSIRO,<br />
UTas<br />
GA, Lockheed Martin <strong>Australia</strong> Ltd,<br />
NCI, CRCSI, Victorian Partnership <strong>for</strong><br />
Advanced Computing<br />
University <strong>of</strong> Sydney, CSIRO, AuScope,<br />
GA, Monash University<br />
WIRADA 1+ 2008-2013 7 3 CSIRO, CAWCR, ANU, UQ<br />
C3DMM 1+ 2009-2013 6.7 4<br />
ERSDAC Soil<br />
Mapping<br />
CSIRO, GSWA, AuScope Grid, iVEC,<br />
GA, BHP-B, Murchison Metals<br />
1+ 2009-2011 5 2 CSIRO, DAFWA and DEC (WA)<br />
Paleovalleys 1 2008-2012 5 2<br />
GA, WA+SA+NT Geological Surveys,<br />
WA+SA Dept <strong>of</strong> Water, NT DNREAS,<br />
UNSW, Flinders University<br />
IFCI Demonstration 1 2009-2012 4 3 UNSW, CRCSI, CSIRO, DCCEE<br />
Joint Remote<br />
Sensing <strong>Research</strong><br />
Centre<br />
2.4.1 AusCover TERN<br />
0.4 2007-ongoing 6 6 UQ, DERM, NSW OEH, Vic DSE<br />
This research facility within the Terrestrial Ecosystem <strong>Research</strong> Network (TERN) involves direct<br />
collaboration between CSIRO and ten other research organisations around <strong>Australia</strong>. AusCover will produce<br />
and deliver free and open access to nationally consistent land-surface biophysical map products that are<br />
validated <strong>for</strong> <strong>Australia</strong>n conditions. These will be derived from long-time series <strong>of</strong> satellite and airborne<br />
datasets and next generation remote sensing research data.<br />
2.4.2 BLUELink<br />
This collaborative project between CSIRO, BoM and the <strong>Australia</strong>n Navy is an operational oceanography<br />
system that can deliver ocean <strong>for</strong>ecasts <strong>for</strong> coastal and marine industries. These <strong>for</strong>ecasts provide day-to-
CONtEXt Of CEODA-R&D SURvEy<br />
day variations in coastal and ocean currents and eddies, and surface and subsurface ocean properties, that<br />
impact and are linked to maritime and commercial operations, defence applications, safety-at-sea, ecological<br />
sustainability, regional and global climate. BLUELink models are anticipated to generate a long-term, oceanbased<br />
climate monitoring system <strong>for</strong> primary producers.<br />
2.4.3 IMOS<br />
The Integrated Marine Observing System is an NCRIS facility that coordinates ocean observations across<br />
<strong>Australia</strong>, with EO comprising the largest dataset. It assembles and delivers free and open access to national<br />
datasets <strong>for</strong> physical, chemical and biological variables relevant to marine and climate science through its<br />
IMOS Ocean Portal. The sub-facilities within the IMOS Remote Sensing Facility include Ocean Temperature,<br />
Ocean Colour, tOPEX/Jason Microwave Radiometer (tMR/JMR) Radar Altimetry, and data cataloguing.<br />
2.4.4 Joint Remote Sensing <strong>Research</strong> Centre<br />
This Centre involves collaboration between the University <strong>of</strong> Queensland Centre <strong>for</strong> Spatial Environmental<br />
<strong>Research</strong>, Queensland Department <strong>of</strong> Environment and Resource Management, NSW Office <strong>of</strong><br />
Environment and Heritage, and Victorian Department <strong>of</strong> Sustainability and Environment. It provides<br />
specialised training that supports research activities aimed at understanding the impacts that humans and<br />
climate have on the natural environment, and addresses research problems and long-term monitoring<br />
problems faced by the Queensland, NSW and Victorian governments in using satellite remote sensing <strong>for</strong><br />
legislated activities.<br />
2.4.5 Numerical Weather Prediction<br />
BoM has recently implemented a new computer <strong>for</strong>ecasting program (ACCESS) that relies on a wide<br />
range <strong>of</strong> EO data sources to provide improved weather <strong>for</strong>ecasting over the <strong>Australia</strong>n region. Satellite<br />
data from 30 to 50 satellite instruments are received in near real-time and used to develop, test and deliver<br />
methods <strong>for</strong> determining current and future atmospheric and the surface state <strong>for</strong> weather and climate<br />
monitoring and prediction, numerical weather prediction and a large number <strong>of</strong> other applications <strong>of</strong> use to<br />
governments, NGOs and private industry.<br />
2.4.6 Other Meteorological <strong>Research</strong><br />
BoM also conducts research that is not directly related to numerical weather prediction, including<br />
monitoring short and long term condition <strong>of</strong> the atmosphere, oceans and vegetation. These include<br />
improved <strong>for</strong>ecasting and nowcasting using additional in<strong>for</strong>mation such as convective cloud development,<br />
rainfall measurement, cyclone positioning, and monitoring dust, drought, floods, fog, volcanic ash, short term<br />
<strong>for</strong>ecasting <strong>of</strong> high impact weather, and grass curing status.<br />
<strong>Continuity</strong> <strong>of</strong> <strong>Earth</strong> <strong>Observation</strong> <strong>Data</strong> <strong>for</strong> <strong>Australia</strong>: R&D • January 2012 31
2.5 Summary<br />
The CEODA-R&D survey has collated detailed in<strong>for</strong>mation describing 56 EO-related research projects<br />
currently being conducted in <strong>Australia</strong>. The surveyed projects comprise a representative subset <strong>of</strong> the<br />
broader research activities in this area and include the major areas <strong>of</strong> EO-related R&D in this country.<br />
These projects represent a total annual budget <strong>of</strong> nearly $35 million and employment <strong>of</strong> over 190 full time<br />
equivalents in both civil and defence organisations. (Note that the 13 large and significant projects listed in<br />
Table 2-13 collectively contribute nearly two thirds <strong>of</strong> this total annual budget and employ over half the staff<br />
numbers mentioned.) The 56 projects involved in the CEODA-R&D survey comprise less than a quarter <strong>of</strong><br />
the current EO-related R&D projects in <strong>Australia</strong>.<br />
Many more EO-related activities which are just outside the scope <strong>of</strong> this R&D-focused study are also<br />
underway, and some <strong>of</strong> these are documented in other studies such as CEODA-Ops (Geoscience <strong>Australia</strong>,<br />
2011). The surveyed projects, nonetheless, make significant input to a range <strong>of</strong> operational programs in<br />
<strong>Australia</strong>, with over 70% citing direct support to or from the 91 programs identified in CEODA-Ops. This<br />
research services several areas <strong>of</strong> national importance, in particular those relating to environmental and<br />
resource monitoring and reporting.<br />
32 <strong>Continuity</strong> <strong>of</strong> <strong>Earth</strong> <strong>Observation</strong> <strong>Data</strong> <strong>for</strong> <strong>Australia</strong>: R&D • January 2012
3 EO DATA REQUIREMENTS: CURRENT<br />
EO DATA REQUIREMENTS: CURRENT<br />
Based on the 56 sample projects described in Section 2, the following sub-sections detail the type,<br />
resolution, extent and volume <strong>of</strong> EO data that is currently being used in <strong>Australia</strong>n research (Section<br />
3.1) and consider the supply channels through which these data are delivered (Section 3.2). Based on<br />
the current usage and supply in<strong>for</strong>mation, nine Priority <strong>Data</strong> Types are identified and further discussed in<br />
Section 3.3.<br />
3.1 Usage<br />
This section gives an overview <strong>of</strong> the usage <strong>of</strong> EO data in support <strong>of</strong> the R&D projects that have been<br />
surveyed. Usage is analysed both in overall terms, and by data type based on the 18 instrument definitions<br />
identified in the CEOS Handbook (see Table 2-2).<br />
3.1.1 All Projects<br />
Using the survey ratings described in Section 2.1.3, the overall importance <strong>of</strong> EO data usage to the sample<br />
set <strong>of</strong> projects is summarised in Table 3-1. Over 85% <strong>of</strong> the surveyed projects depend on some <strong>for</strong>m <strong>of</strong> EO<br />
data from satellite sources, while nearly 40% require airborne EO data to conduct their research activities.<br />
EO <strong>Data</strong> Source<br />
Table 3-1 EO <strong>Data</strong> Importance<br />
Entries indicate the number <strong>of</strong> projects<br />
Essential Advantageous<br />
EO <strong>Data</strong> Importance Rating<br />
Essential +<br />
Advantageous<br />
Opportunistic Promising<br />
Satellite 48 5 53 2 0<br />
Airborne 21 11 32 7 1<br />
Another six projects that rated Airborne EO data as essential considered Satellite sources to be either<br />
advantageous or opportunistic <strong>for</strong> their research, and a further 11 projects that rated Satellite EO data as<br />
essential, considered Airborne sources as advantageous.<br />
The results <strong>for</strong> these ratings <strong>for</strong> usage <strong>of</strong> individual data types are shown in Table 3-2 and Table 3-3 <strong>for</strong><br />
satellite and airborne sources respectively. These numbers differ from those in Table 3-1 in that they indicate<br />
which specific EO data types are, or could be, relevant to the sample projects.<br />
With reference to Table 3-2, Low Resolution Optical data was rated as the most important EOS data type,<br />
being used by just over half <strong>of</strong> the survey projects (essential + advantageous). Medium Resolution Optical<br />
data is also needed in nearly half <strong>of</strong> the projects, and High Resolution Optical imagery in nearly one third.<br />
Passive microwave and Synthetic Aperture Radar (SAR) data types were also essential <strong>for</strong> several projects,<br />
and considered both advantageous and/or promising to others. Hyperspectral, Lidar and Radar Altimeter<br />
instruments were among the most ‘promising’ prospects <strong>for</strong> future research from satellite sources.<br />
<strong>Continuity</strong> <strong>of</strong> <strong>Earth</strong> <strong>Observation</strong> <strong>Data</strong> <strong>for</strong> <strong>Australia</strong>: R&D • January 2012 33
EO <strong>Data</strong> Type<br />
Table 3-2 Satellite EO <strong>Data</strong> Importance<br />
Entries indicate the number <strong>of</strong> projects<br />
Essential Advantageous<br />
34 <strong>Continuity</strong> <strong>of</strong> <strong>Earth</strong> <strong>Observation</strong> <strong>Data</strong> <strong>for</strong> <strong>Australia</strong>: R&D • January 2012<br />
EO <strong>Data</strong> Importance Rating<br />
Essential +<br />
Advantageous<br />
Opportunistic Promising<br />
Optical – Low Resolution 27 2 30 1 1<br />
Optical – Medium<br />
Resolution<br />
23 5 28 1 0<br />
Optical – High Resolution 10 7 17 4 2<br />
Passive Microwave<br />
Radiometry<br />
7 3 10 2 4<br />
Radar Altimetry 8 0 8 0 4<br />
Synthetic Aperture Radar<br />
– C band<br />
2 6 8 3 3<br />
Ocean Colour 6 1 7 0 3<br />
Lidar 5 2 7 0 8<br />
Synthetic Aperture Radar<br />
– L band<br />
5 2 7 2 5<br />
Hyperspectral Imagery 4 3 7 1 6<br />
Multiple Direction/<br />
Polarisation<br />
3 4 7 0 4<br />
Atmospheric Chemistry 2 5 7 0 3<br />
Synthetic Aperture Radar<br />
– X band<br />
Cloud Pr<strong>of</strong>ile and Rain<br />
Radar<br />
Atmospheric Temperature<br />
and Humidity Sounding<br />
Gravity, Magnetic Field and<br />
Geodynamic<br />
2 5 7 2 2<br />
3 3 6 1 1<br />
3 2 5 1 2<br />
3 2 5 1 3<br />
Scatterometry 2 3 5 1 1<br />
<strong>Earth</strong> Radiation Budget<br />
Radiometry<br />
2 1 3 2 3<br />
TOTAL 117 56 174 22 55<br />
With reference to Table 3-3, Hyperspectral and Lidar were rated as the most desirable data types from<br />
airborne sources, each being essential to over 10% <strong>of</strong> projects. These results support those from Table 3-2,<br />
which imply that satellite sources <strong>for</strong> these datasets would be well utilised if they were more widely available.<br />
Passive microwave, SAR and geomagnetic data from airborne sources were also considered essential or<br />
advantageous <strong>for</strong> several projects.
EO <strong>Data</strong> Type<br />
Table 3-3 Airborne EO <strong>Data</strong> Importance<br />
Entries indicate the number <strong>of</strong> projects<br />
Essential Advantageous<br />
EO <strong>Data</strong> Importance Rating<br />
Essential +<br />
Advantageous<br />
EO DATA REQUIREMENTS: CURRENT<br />
Opportunistic Promising<br />
Hyperspectral Imagery 8 5 13 3 3<br />
Lidar 6 6 12 3 6<br />
Optical – High Resolution 8 2 10 1 1<br />
Gravity, Magnetic Field and<br />
Geodynamic<br />
Synthetic Aperture Radar<br />
– L band<br />
Passive Microwave<br />
Radiometry<br />
2 1 3 0 0<br />
3 0 3 0 0<br />
2 0 2 0 0<br />
Optical – Low Resolution 0 3 3 0 0<br />
Scatterometry 0 2 2 0 0<br />
Atmospheric Chemistry 1 0 1 0 0<br />
Radar Altimetry 0 1 1 0 1<br />
Synthetic Aperture Radar<br />
– X band<br />
1 0 1 0 0<br />
TOTAL 31 20 51 7 11<br />
In addition to the CEOS Instrument list, respondents were asked to rate their usage <strong>of</strong> in situ and other<br />
types <strong>of</strong> satellite data. Results <strong>for</strong> usage <strong>of</strong> these data types are summarised in Table 3-4, showing that over<br />
half the projects need ground-based data to calibrate or validate their EO data analyses.<br />
The rating frequencies in Tables 3-2 and 3-3 can be considered one measure <strong>of</strong> ‘criticality’ <strong>for</strong> these data<br />
types in current EO-related research activities in <strong>Australia</strong>. Within the subset <strong>of</strong> projects which rated any<br />
individual data type as ‘essential’, Table 3-5 separates data usage by project budget, showing that the most<br />
widely used data types, optical and SAR, are essential to projects from all budget ranges, and are especially<br />
popular in the smaller budget projects. Instruments specifically designed <strong>for</strong> atmospheric studies are mostly<br />
used <strong>for</strong> medium and large budget projects, as are the newer instrument types such as Hyperspectral<br />
imagers, Lidars and Radar Altimeters.<br />
EO <strong>Data</strong> Type<br />
Table 3-4 In Situ and Other EO <strong>Data</strong> Importance<br />
Entries indicate the number <strong>of</strong> projects<br />
Essential Advantageous<br />
EO <strong>Data</strong> Importance Rating<br />
Essential +<br />
Advantageous<br />
Opportunistic Promising<br />
In Situ 29 9 38 1 2<br />
Other 5 1 6 1 0<br />
<strong>Continuity</strong> <strong>of</strong> <strong>Earth</strong> <strong>Observation</strong> <strong>Data</strong> <strong>for</strong> <strong>Australia</strong>: R&D • January 2012 35
EO <strong>Data</strong> Type<br />
Table 3-5 Project Annual Budget <strong>for</strong> ‘Essential’ Satellite EO <strong>Data</strong> Types<br />
up to $100,000<br />
Entries indicate the number <strong>of</strong> projects<br />
$100,000 to<br />
$500,000<br />
Annual Budget<br />
36 <strong>Continuity</strong> <strong>of</strong> <strong>Earth</strong> <strong>Observation</strong> <strong>Data</strong> <strong>for</strong> <strong>Australia</strong>: R&D • January 2012<br />
$500,000 to<br />
$1,000,000<br />
$1,000,000+<br />
Atmospheric Chemistry 0 0 0 2 2<br />
Atmospheric<br />
Temperature and<br />
Humidity Sounding<br />
Cloud Pr<strong>of</strong>ile and Rain<br />
Radar<br />
<strong>Earth</strong> Radiation Budget<br />
Radiometry<br />
Gravity, Magnetic Field<br />
and Geodynamic<br />
TOTAL<br />
0 1 0 2 3<br />
0 1 0 2 3<br />
0 1 0 1 2<br />
1 2 0 0 3<br />
Hyperspectral Imagery 0 1 2 1 4<br />
Passive Microwave<br />
Radiometry<br />
0 4 0 3 7<br />
Lidar 0 3 0 2 5<br />
Multiple Direction/<br />
Polarisation<br />
0 1 0 2 3<br />
Ocean Colour 0 1 3 2 6<br />
Optical – High<br />
Resolution<br />
Optical – Low<br />
Resolution<br />
Optical – Medium<br />
Resolution<br />
3 4 2 1 10<br />
5 9 5 8 27<br />
4 10 4 5 23<br />
Radar Altimetry 1 1 0 6 8<br />
Synthetic Aperture<br />
Radar – C band<br />
Synthetic Aperture<br />
Radar – L band<br />
Synthetic Aperture<br />
Radar – X band<br />
1 0 0 1 2<br />
2 1 0 2 5<br />
0 0 1 1 2<br />
Scatterometry 0 0 0 2 2<br />
TOTAL 17 40 17 43 117<br />
Similarly, an analysis <strong>of</strong> data usage in terms <strong>of</strong> the four types <strong>of</strong> research establishment is presented in Table<br />
3-6. The results in Table 3-6 suggest that most Federal and State agencies rely on optical sensors to support<br />
their EO-related R&D activities, whereas research and academic institutions use a wider range <strong>of</strong> data types.
EO <strong>Data</strong> Type<br />
Optical – Low<br />
Resolution<br />
Optical – Medium<br />
Resolution<br />
Optical – High<br />
Resolution<br />
Table 3-6 <strong>Research</strong> Establishments Using ‘Essential’ Satellite EO <strong>Data</strong> Types<br />
Academic<br />
Institution<br />
Entries indicate the number <strong>of</strong> projects<br />
<strong>Research</strong> Establishment<br />
<strong>Research</strong><br />
Organisation<br />
EO DATA REQUIREMENTS: CURRENT<br />
State Agency Federal Agency<br />
TOTAL<br />
7 10 4 6 27<br />
5 6 8 4 23<br />
2 4 3 1 10<br />
Radar Altimetry 2 5 0 1 8<br />
Passive Microwave<br />
Radiometry<br />
4 3 0 0 7<br />
Ocean Colour 1 5 0 0 6<br />
Lidar 1 3 1 0 5<br />
Synthetic Aperture<br />
Radar – L band<br />
3 1 1 0 5<br />
Hyperspectral Imagery 1 3 0 0 4<br />
Atmospheric<br />
Temperature and<br />
Humidity Sounding<br />
Cloud Pr<strong>of</strong>ile and Rain<br />
Radar<br />
Gravity, Magnetic Field<br />
and Geodynamic<br />
Multiple Direction/<br />
Polarisation<br />
1 2 0 0 3<br />
0 3 0 0 3<br />
2 0 0 1 3<br />
0 3 0 0 3<br />
Atmospheric Chemistry 0 2 0 0 2<br />
<strong>Earth</strong> Radiation Budget<br />
Radiometry<br />
Synthetic Aperture<br />
Radar – C band<br />
Synthetic Aperture<br />
Radar – X band<br />
1 1 0 0 2<br />
1 0 0 1 2<br />
1 0 0 1 2<br />
Scatterometry 0 2 0 0 2<br />
TOTAL 32 53 17 15 117<br />
3.1.2 Major Projects<br />
The EO data usage within the CEODA-R&D Major Projects (defined in Section 2.4) requires special<br />
consideration. The importance <strong>of</strong> these Major Projects in terms <strong>of</strong> national outcomes was detailed in<br />
Sections 2.3.2 and 2.4. A summary <strong>of</strong> those data types rated as essential by each Major Project is presented<br />
in Table 3-7. <strong>Data</strong> usage in these projects confirms Low Resolution Optical data type as the highest single<br />
Priority <strong>Data</strong> Type <strong>for</strong> <strong>Australia</strong>n EO-related R&D activities.<br />
<strong>Continuity</strong> <strong>of</strong> <strong>Earth</strong> <strong>Observation</strong> <strong>Data</strong> <strong>for</strong> <strong>Australia</strong>: R&D • January 2012 37
EO <strong>Data</strong> Type<br />
Optical – Low<br />
Resolution<br />
Atmospheric<br />
Temperature and<br />
Humidity Sounding<br />
Table 3-7 Major Projects using ‘Essential’ <strong>Data</strong> Types<br />
Entries indicate the number <strong>of</strong> different sensors cited<br />
CEODA-R&D Major Projects<br />
AusCover BLUELink IMOS JRSRC NWP Other Met.<br />
38 <strong>Continuity</strong> <strong>of</strong> <strong>Earth</strong> <strong>Observation</strong> <strong>Data</strong> <strong>for</strong> <strong>Australia</strong>: R&D • January 2012<br />
TOTAL<br />
2 1 2 1 10 10 26<br />
0 0 0 0 11 11 22<br />
Radar Altimeters 0 3 1 0 5 5 14<br />
Atmospheric Chemistry 0 0 0 0 6 6 12<br />
Passive Microwave<br />
Radiometry<br />
Cloud Pr<strong>of</strong>ile and Rain<br />
Radars<br />
Optical – High<br />
Resolution<br />
0 0 1 1 5 5 12<br />
0 0 0 0 3 3 6<br />
3 0 0 2 0 0 5<br />
Lidar (airborne) 0 0 (airborne) 2 2 4<br />
Scatterometry 0 0 0 0 2 2 4<br />
Multiple Direction/<br />
Polarisation<br />
Optical – Medium<br />
Resolution<br />
Gravity, Magnetic Field<br />
and Geodynamic<br />
0 0 0 1 1 1 3<br />
1 0 0 2 0 0 3<br />
0 0 0 0 1 1 2<br />
Ocean Colour* 0 0 0 0 1 1 2<br />
Synthetic Aperture<br />
Radar – L band<br />
<strong>Earth</strong> Radiation Budget<br />
Radiometry<br />
Hyperspectral Imagers<br />
Synthetic Aperture<br />
Radar – C band<br />
Synthetic Aperture<br />
Radar – X band<br />
1 0 0 1 0 0 2<br />
0 0 1 0 0 0 1<br />
1<br />
(+ airborne)<br />
0 0 (airborne) 0 0 1<br />
0 0 0 0 0 0 0<br />
0 0 0 0 0 0 0<br />
In Situ Yes Yes Yes Yes Yes Yes All yes<br />
Other 0 0 0 2 (ground) 3 3 6<br />
TOTAL<br />
(excluding airborne, in<br />
situ, and ground)<br />
8 4 5 8 50 50 125<br />
* Some key instruments that contribute to Ocean Colour are categorised under Optical – Low Resolution<br />
Both data volume and sensor range are particularly large <strong>for</strong> the Major Projects being conducted by<br />
CAWCR, with many <strong>of</strong> the sensors cited only being used by these projects (see Section 3.2). Many <strong>of</strong><br />
these products are widely used in the university research community as well as within projects that are not<br />
explicitly EO and so are not captured in this survey. While some <strong>of</strong> these Major Projects appear to involve<br />
a small number <strong>of</strong> sensors, they use large volumes <strong>of</strong> EO data. IMOS, <strong>for</strong> example, acquires 4 TB <strong>of</strong> Low<br />
Resolution Optical data annually and maintains an archive <strong>of</strong> 45 TB. Similarly, the Low Resolution Optical<br />
data archive <strong>for</strong> AusCover currently comprises 62 TB, with large, ongoing annual acquisitions.
3.2 Supply<br />
EO DATA REQUIREMENTS: CURRENT<br />
The EOS data supply arrangements currently being used in the surveyed projects involve 59 unique data<br />
sources and are listed by data type in Table 3-8. The 17 instruments (nearly 30%) that are used exclusively<br />
by CAWCR <strong>for</strong> weather <strong>for</strong>ecasting are differentiated in this table. Instruments that were identified by<br />
survey respondents as important but which have not yet been launched have not been included in this<br />
table.<br />
EO <strong>Data</strong> Type<br />
Optical – Low<br />
Resolution<br />
Atmospheric<br />
Temperature and<br />
Humidity Sounding<br />
Optical – High<br />
Resolution<br />
Atmospheric Chemistry<br />
Optical – Medium<br />
Resolution<br />
Passive Microwave<br />
Radiometry<br />
Table 3-8 Supply Sources <strong>for</strong> ‘Essential’ Satellite EO <strong>Data</strong> Types<br />
Instruments exclusively used<br />
by CAWCR/BoM<br />
Imager (GOES),<br />
Sounder (GEOS),<br />
SEVIRI (Meteosat),<br />
IVISSR (FY-2),<br />
MI (COMS)<br />
AMSU-A (Aqua, NOAA,<br />
MetOp-A), AMSU-B (NOAA),<br />
MHS (NOAA, MetOp-A),<br />
SSM/IS (DMSP),<br />
Sounder (GOES)<br />
-<br />
SCIAMACHY (Envisat),<br />
OMI (Aura),<br />
GOMOS (Envisat)<br />
-<br />
Aquarius (SAC-D/Aquarius),<br />
SSM/I (DMSP F-15)<br />
Radar Altimetry -<br />
Multiple Direction/<br />
Polarisation<br />
Cloud Pr<strong>of</strong>ile and Rain<br />
Radar<br />
Gravity, Magnetic Field<br />
and Geodynamic<br />
Hyperspectral Imagers -<br />
Ocean Colour* -<br />
Synthetic Aperture<br />
Radar – C band<br />
-<br />
<strong>Data</strong> Sources TOTAL INSTRUMENTS<br />
Instruments used by all<br />
CEODA-R&D projects<br />
(including CAWCR/BoM)<br />
MODIS (Aqua, Terra),<br />
MERIS (Envisat),<br />
Imager (MTSAT),<br />
AVHRR (NOAA,<br />
MetOp-A), AATSR (Envisat)<br />
AIRS (Aqua),<br />
HIRS/3 (NOAA),<br />
HIRS/4 (NOAA, MetOp-A),<br />
IASI (MetOp-A)<br />
MS and PAN (Ikonos-2),<br />
MSI (RapidEye),<br />
World View,<br />
Digital Globe,<br />
HRVIR (SPOT-4),<br />
HRS and HRG (SPOT-5),<br />
ASTER (Terra)<br />
TANSO-FTS (GOSAT),<br />
AIRS (Aqua),<br />
IASI (MetOp-A)<br />
HRVIR (SPOT-4),<br />
HRG (SPOT-5),<br />
ASTER (Terra),<br />
MSS (Landsat-5),<br />
TM (Landsat-5),<br />
ETM+ (Landsat-7)<br />
JMR (Jason-1),<br />
MIRAS (SMOS),<br />
TMI (TRMM)<br />
POSEiDON-2 (Jason-1),<br />
POSEiDON-3 (Jason-2),<br />
SIRAL (CryoSat-2), ALT<br />
(HY-2A)<br />
MISR (Terra),<br />
POLDER-P (PARASOL),<br />
AATSR (Envisat)<br />
CAWCR/BoM<br />
only<br />
Other<br />
Projects<br />
All<br />
Projects<br />
5 5 10<br />
5 4 9<br />
0 7 7<br />
3 3 6<br />
0 6 6<br />
2 3 5<br />
0 4 4<br />
0 3 3<br />
PR (TRMM) CPR (CloudSat) 1 1 2<br />
- GRACE, CHAMP 0 2 2<br />
-<br />
Hyperion (NPM EO-1),<br />
HICO (ISS)<br />
OCM (OCEANSAT-2),<br />
GOCI (COMS)<br />
ASAR (Envisat),<br />
SAR (Radarsat)<br />
0 2 2<br />
0 2 2<br />
0 2 2<br />
<strong>Continuity</strong> <strong>of</strong> <strong>Earth</strong> <strong>Observation</strong> <strong>Data</strong> <strong>for</strong> <strong>Australia</strong>: R&D • January 2012 39
EO <strong>Data</strong> Type<br />
Synthetic Aperture<br />
Radar – X band<br />
Scatterometry<br />
<strong>Earth</strong> Radiation Budget<br />
Radiometry<br />
Instruments exclusively used<br />
by CAWCR/BoM<br />
Table 3-8 (continued)<br />
40 <strong>Continuity</strong> <strong>of</strong> <strong>Earth</strong> <strong>Observation</strong> <strong>Data</strong> <strong>for</strong> <strong>Australia</strong>: R&D • January 2012<br />
-<br />
ASCAT (MetOp-A),<br />
Scatterometer<br />
(OCEANSAT2)<br />
-<br />
<strong>Data</strong> Sources TOTAL INSTRUMENTS<br />
Instruments used by all<br />
CEODA-R&D projects<br />
(including CAWCR/BoM)<br />
SAR 2000 (COSMO-<br />
SkyMED), X-Band SAR<br />
(terraSAR-X)<br />
CAWCR/BoM<br />
only<br />
Other<br />
Projects<br />
All<br />
Projects<br />
0 2 2<br />
- 2 0 2<br />
CERES (TRMM, Terra,<br />
Aqua)<br />
0 1 1<br />
Lidar - CALIOP (CALIPSO) 0 1 1<br />
Synthetic Aperture<br />
Radar – L band<br />
- - 0 0 0<br />
TOTAL 18 48 66<br />
# Unique Instruments 17 42 59<br />
* Some key instruments that contribute to Ocean Colour are categorised under Optical – Low Resolution<br />
For each essential data type, respondents were asked to select the agreement type that governed data<br />
supply and the physical supply route used <strong>for</strong> data delivery (please refer to Appendix C-6 <strong>for</strong> details <strong>of</strong><br />
supply categories). The vast majority <strong>of</strong> EO data used <strong>for</strong> R&D activities in <strong>Australia</strong> are available under<br />
public good agreements and are accessed via ftp/Internet arrangements, either from Geoscience <strong>Australia</strong>, or<br />
(<strong>of</strong>ten) directly from data servers operated by international agencies (e.g. NASA, USGS, ESA). This imposes<br />
significant loads on current Internet links to the USA and Europe. Some sources <strong>of</strong> meteorological data are<br />
covered by WMO Resolution 40, and a small number <strong>of</strong> researchers have enhanced access privileges based<br />
on either Primary Investigator status, data reception agreements or public good (research agreements).<br />
While most respondents did not report current infrastructure obstacles, several commented in relation<br />
to overall data supply and download capacity. Some state governments impose extremely high download<br />
charges, which are avoided by consortia which include academic institutions. Bandwidth is a problem in<br />
more remote locations, such as Townsville, resulting in slow data transfer rates. For some data types, data<br />
access was compounded by ‘data packaging’ by the supplier. For example, AATSR data is only available via<br />
web access, without the facility to download sub-global coverages. The daily volume <strong>of</strong> data acquired over<br />
<strong>Australia</strong> by other sensors, such as CALIOP (CALIPSO), is too large to download in a single day. Some<br />
research projects currently lack the facilities and manpower to download ongoing data, so are concentrating<br />
on analysis <strong>of</strong> historical data. Certain key EO datasets in <strong>Australia</strong> are currently acquired and supplied largely<br />
on a ‘good will’ basis by selected research establishments, and these supply conditions were reported to<br />
contribute to unpredictable delays in data delivery.<br />
The current data volumes being managed by seven <strong>of</strong> the 56 surveyed projects are listed in Table 3-9.<br />
Each <strong>of</strong> these projects involve storage, processing and ongoing acquisition <strong>of</strong> relatively large data volumes.<br />
The infrastructure implications <strong>of</strong> downloading these growing volumes <strong>of</strong> EO data, <strong>of</strong>ten from international<br />
sources, underline the importance <strong>of</strong> efficient data access and archiving facilities <strong>for</strong> <strong>Australia</strong>n researchers,<br />
and the need <strong>for</strong> strategic infrastructure plans.
Table 3-9 Current <strong>Data</strong> Volumes <strong>for</strong> Selected Projects<br />
EO DATA REQUIREMENTS: CURRENT<br />
CEODA-R&D Project Historical Archives (approx. TB) Annual Acquisitions (approx. TB)<br />
AusCover TERN (CSIRO) 50 2.5<br />
WIRADA (CSIRO) 50 4<br />
IMOS (CSIRO) 45 13<br />
Savanna Burning (CDU) 35 3.5<br />
FireWatch (Landgate) 30 3<br />
Cal/Val <strong>of</strong> VIIRS/GCOM-SGLI (UTS) 10 2.5<br />
Ground Cover Mapping (DERM) 15 0.5<br />
Total 235 29.0<br />
Respondents were also asked about the quality control procedures used <strong>for</strong> each data type. The majority<br />
<strong>of</strong> researchers were satisfied with the quality <strong>of</strong> their data as supplied by the data provider, but some data<br />
types needed additional quality control procedures as well as calibration/validation (Cal/Val) <strong>for</strong> project<br />
requirements. In general, satisfaction with data quality among respondents was inversely correlated with an<br />
awareness <strong>of</strong> potential and/or current data acquisition problems with particular sensors. Those concerned<br />
with ongoing supply <strong>of</strong> calibrated and validated datasets <strong>for</strong> <strong>Australia</strong> stressed the need <strong>for</strong> algorithms and<br />
processing tailored to local conditions.<br />
3.3 Priority <strong>Data</strong> Types<br />
EO data usage in current R&D activities in <strong>Australia</strong> is analysed in Section 3.1, and current supply<br />
arrangements are considered in Section 3.2. The significance <strong>of</strong> these data types in supporting national<br />
outcomes is discussed in Section 2.3.2. On the basis <strong>of</strong> these results, the following nine EO data types can<br />
be considered as the ‘Priority <strong>Data</strong> Types’ in <strong>Australia</strong>n research:<br />
• Low Resolution Optical;<br />
• Medium Resolution Optical;<br />
• High Resolution Optical;<br />
• SAR (C-, L- and X-band);<br />
• Passive Microwave Radiometry;<br />
• Radar Altimetry;<br />
• Hyperspectral Imagery;<br />
• Lidar; and<br />
• Ocean Colour.<br />
The proportion <strong>of</strong> projects rating each <strong>of</strong> these Priority <strong>Data</strong> Types as essential <strong>for</strong> current research is<br />
illustrated in Figure 3-1 (based on essential usage counts presented in Tables 3-2 and 3-3).<br />
<strong>Continuity</strong> <strong>of</strong> <strong>Earth</strong> <strong>Observation</strong> <strong>Data</strong> <strong>for</strong> <strong>Australia</strong>: R&D • January 2012 41
Figure 3-1 Usage <strong>of</strong> Priority <strong>Data</strong> Types by Surveyed Projects<br />
a. Satellite <strong>Data</strong> b. Airborne <strong>Data</strong><br />
As noted in Section 2-4, this ranking makes no attempt to suggest the importance <strong>of</strong> one research project<br />
over another. Nor does it give weight to the data volumes involved. It simply indicates the frequency and<br />
diversity <strong>of</strong> use across all <strong>Australia</strong>n research centres, and provides in<strong>for</strong>mation on the anticipated national<br />
outcomes and benefits from the different research projects. Atmospheric data types (e.g. from temperature<br />
and humidity sounders such as IASI and AIRS) would no doubt appear in the list were a more arbitrary<br />
weighting scheme employed which reflected data volumes or project size. Further, atmospheric data<br />
corrections are a feature <strong>of</strong> almost every application involving calibrated land and ocean observations. The<br />
deeper significance <strong>of</strong> these data (other than suggested by the scope <strong>of</strong> this study) will be the subject <strong>of</strong> a<br />
CEODA Report focused on meteorological data needs. Section 2-4 explains the characteristics <strong>of</strong> the 13<br />
‘major projects’ identified by the survey.<br />
Some <strong>of</strong> the coverage characteristics required <strong>for</strong> these Priority <strong>Data</strong> Types are summarised in Table 3-10.<br />
Table 3-10 Predominant Requirements <strong>of</strong> Priority <strong>Data</strong> Types<br />
Priority EO <strong>Data</strong> Type Spatial Resolution Spatial Coverage Temporal Coverage Latency<br />
Optical – Low Resolution Low National Daily Hours/Weeks<br />
Optical – Medium Resolution Medium National Various Days/Weeks<br />
Optical – High Resolution High Regional/Local<br />
42 <strong>Continuity</strong> <strong>of</strong> <strong>Earth</strong> <strong>Observation</strong> <strong>Data</strong> <strong>for</strong> <strong>Australia</strong>: R&D • January 2012<br />
Other<br />
(field work/<br />
irregular coverage)<br />
Days/Weeks/<br />
Not Important<br />
Synthetic Aperture Radar Medium Regional Annually Weeks<br />
Passive Microwave<br />
Radiometry<br />
Low Global Daily Hours<br />
Radar Altimetry Low Global Daily Hours<br />
Hyperspectral Imagery High Local Monthly Weeks<br />
Lidar High Local Annually Weeks<br />
Ocean Colour Low National Daily Hours
EO DATA REQUIREMENTS: CURRENT<br />
The coverage requirements listed in Table 3-10 highlight the different usage patterns that are associated<br />
with each <strong>of</strong> the Priority <strong>Data</strong> Types. As expected, those data types with higher spatial resolution tend to<br />
be preferred <strong>for</strong> smaller area studies, while lower spatial resolution data types are better suited to broader<br />
areas <strong>of</strong> coverage. The data types used <strong>for</strong> broad area coverage tend also to be required more <strong>of</strong>ten and<br />
more quickly.<br />
Over all Priority <strong>Data</strong> Types, 32% <strong>of</strong> projects require national coverage, with 19% and 21% needing regional<br />
and global coverage respectively. New data are required each day <strong>for</strong> 32% <strong>of</strong> projects (mostly involving<br />
MODIS imagery), with 15% and 14% <strong>of</strong> projects requesting data each month and year. For 25% <strong>of</strong> projects,<br />
it was necessary that image acquisition coincided with:<br />
• ground sampling;<br />
• acquisition <strong>of</strong> other imagery;<br />
• the time <strong>of</strong> maximum discrimination <strong>of</strong> a target feature; and/or<br />
• occurrence <strong>of</strong> an external event (such as flooding).<br />
The preferred latency—the delay between image capture and delivery—was surveyed as weekly <strong>for</strong> 35% <strong>of</strong><br />
projects (mostly <strong>for</strong> Medium Resolution Optical data) and hourly <strong>for</strong> 26% <strong>of</strong> projects (mostly low resolution<br />
data).<br />
For each <strong>of</strong> the Priority <strong>Data</strong> Types, usage and supply arrangements are detailed in Sections 3.3.1 to 3.3.9.<br />
3.3.1 Low Resolution Optical (>80m)<br />
Overview<br />
Low Resolution Optical sensors record reflectances in the visible and infrared (including thermal)<br />
wavelengths with geometric pixel sizes greater than 80 m. Their large swath widths result in a higher<br />
frequency <strong>of</strong> acquisition than Medium Resolution systems (see Table 2-2) and most are operated <strong>for</strong><br />
public good.<br />
Being low cost and high frequency, this ‘regional scale’ data is used by a wide range <strong>of</strong> operational programs<br />
in <strong>Australia</strong> including:<br />
• Disaster mitigation and management (bushfires, earthquakes, floods, and storms);<br />
• Monitoring land use, land cover, ecosystems, native vegetation, salinity, water resources, and wetlands;<br />
• Managing fisheries, reefs, floodplains, and environmental degradation;<br />
• International agreements;<br />
• Glaciology, oceanography, and climate studies; and<br />
• Carbon accounting (Geoscience <strong>Australia</strong>, 2011).<br />
Operational products currently being derived from Low Resolution Optical imagery include hotspot<br />
mapping <strong>of</strong> active bushfires, coastal water quality, ocean chlorophyll and temperature maps, land-surface<br />
temperature maps, regional landscape mapping, flood mapping, land use and land cover monitoring, and<br />
estimating greenhouse gas emissions.<br />
Low Resolution Optical data are essential to 27 <strong>of</strong> the surveyed projects (nearly 50% <strong>of</strong> the sample across<br />
17 different research groups). Of these 27 projects, 25 cited a total <strong>of</strong> 59 linkages to 32 different operational<br />
programs currently being conducted in <strong>Australia</strong>. The application areas being supported by this research are<br />
listed in Table 3-11. (Note that most projects support multiple application areas.)<br />
<strong>Continuity</strong> <strong>of</strong> <strong>Earth</strong> <strong>Observation</strong> <strong>Data</strong> <strong>for</strong> <strong>Australia</strong>: R&D • January 2012 43
Table 3-11 Projects Dependent on Low Resolution Optical <strong>Data</strong><br />
Application Area Number <strong>of</strong> Surveyed Projects<br />
Delivering national EO data products <strong>for</strong> terrestrial and marine studies 8<br />
Monitoring and modelling land cover and condition 8<br />
Locating active fires<br />
Mapping fuel moisture patterns and fire scars<br />
Estimating bushfire emissions<br />
Monitoring coastal and inland water quality, and coastal habitats 5<br />
Locating and monitoring groundwater sources, allocations and ecology 4<br />
Monitoring sea surface temperature/height, ocean colour and reef health 4<br />
Updating land use in<strong>for</strong>mation 3<br />
Mapping floods 2<br />
Modelling weather, climate and atmospheric characteristics 2<br />
Current Usage<br />
The Low Resolution Optical sensors being used in EO-related research in <strong>Australia</strong> are listed in Table 3-12.<br />
Clearly the two most popular data sources are MODIS, being used by 45% <strong>of</strong> all surveyed projects,<br />
and AVHRR, being used by 21% <strong>of</strong> projects, in part due to their wide-area coverage, high frequency <strong>of</strong><br />
acquisition, availability <strong>of</strong> standard derived products, and ease <strong>of</strong> access via Internet from the USA, or via<br />
several satellite ground stations operated by <strong>Australia</strong>n agencies such as GA, BoM and regional multi-agency<br />
consortia. A number <strong>of</strong> projects expressed interest in moving from Low Resolution Optical to Medium<br />
Resolution Optical data should such data be available more frequently in the future.<br />
Low Resolution<br />
Optical Sensor<br />
Table 3-12 Usage <strong>of</strong> Low Resolution Optical <strong>Data</strong><br />
Entries indicate the number <strong>of</strong> projects<br />
Essential Advantageous<br />
EO <strong>Data</strong> Importance Rating<br />
44 <strong>Continuity</strong> <strong>of</strong> <strong>Earth</strong> <strong>Observation</strong> <strong>Data</strong> <strong>for</strong> <strong>Australia</strong>: R&D • January 2012<br />
Essential +<br />
Advantageous<br />
6<br />
Opportunistic Promising<br />
MODIS 25 1 26 1 0<br />
AVHRR 12 0 12 1 0<br />
Imager (MTSAT) 4 0 4 0 0<br />
MERIS 4 0 4 0 0<br />
VIIRS* 3 0 3 0 0<br />
AATSR 2 1 3 0 0<br />
Imager (GOES) 2 0 2 0 0<br />
IVISSR (FY-2) 2 0 2 0 0<br />
MI (COMS) 2 0 2 0 0<br />
SEVIRI 2 0 2 0 0<br />
Sounder (GOES) 2 0 2 0 0<br />
TANSO-CAI 2 0 2 0 0<br />
TOTAL 62 2 64 2 0<br />
* VIIRS is not yet operational.
EO DATA REQUIREMENTS: CURRENT<br />
Table 3-12 includes both geostationary (over <strong>Australia</strong> and world-wide) and polar orbiting satellites, and is<br />
dominated by sensors that are provided in support <strong>of</strong> operational meteorological data needs. However, the<br />
priorities <strong>for</strong> meteorology and climate needs only would likely be rather different than that suggested by the<br />
table above. the imager on the MtSAt series <strong>of</strong> Japan, <strong>for</strong> example, is critical to BoM’s operations.<br />
Over half the projects using Low Resolution Optical data require daily, national coverage (<strong>of</strong>ten extending to<br />
continental shelf extents) without delay. These projects involve meteorological or coastal/marine applications,<br />
or the supply <strong>of</strong> data <strong>for</strong> disaster monitoring. Most <strong>of</strong> the other projects using Low Resolution Optical data<br />
are concerned with terrestrial monitoring applications at regional to national scale, and require updated<br />
in<strong>for</strong>mation less frequently (weekly to monthly). In these cases, periodicity has <strong>of</strong>ten been adapted to the<br />
current supply options, such as the MODIS composite products, or management issues associated with<br />
data volumes, rather than the preferred frequency <strong>of</strong> updated in<strong>for</strong>mation. Composite products, however,<br />
are also derived from daily acquisitions. A small number <strong>of</strong> projects use historical data to update land use/<br />
condition on an annual basis.<br />
Visible and near infrared (NIR) channels are essential to over half the projects, with short-wave infrared<br />
(SWIR) and thermal infrared (TIR) being important to about a third, and around a quarter <strong>of</strong> the projects<br />
requiring all four spectral regions. An intermittent problem with one <strong>of</strong> the MODIS SWIR bands requires<br />
occasional correction by data supply agencies. Most <strong>of</strong> these projects involve calibration and/or validation <strong>of</strong><br />
EO data with ground-based in<strong>for</strong>mation. This is required both to calibrate EO instrument radiance counts<br />
with a standard measurement scale, and also to check and compensate <strong>for</strong> any inconsistencies within the<br />
instrument counts over time. For example, the solar reflectance channels on the NOAA AVHRR instrument<br />
have no on-board calibration source and are known to drift in sensitivity following launch. The CSIRO<br />
CalWatch project determined appropriate methods <strong>for</strong> post-launch calibration <strong>of</strong> these channels.<br />
While coordination <strong>of</strong> imagery with fieldwork and/or in situ sensor observations was important <strong>for</strong> many<br />
<strong>of</strong> these projects, the regular acquisition cycle <strong>of</strong> Low Resolution Optical imagery already caters <strong>for</strong> this<br />
requirement. Some researchers felt that MODIS-derived products were not appropriate <strong>for</strong> <strong>Australia</strong>n<br />
conditions, and that locally derived atmospheric correction methods yielded superior products, especially<br />
<strong>for</strong> coastal waters. These concerns underpin the impetus to develop and deliver nationally consistent and<br />
calibrated EO-based data coverages <strong>for</strong> <strong>Australia</strong>.<br />
Eleven <strong>of</strong> the 25 projects relying on MODIS data currently maintain their own archives <strong>of</strong> more than 30<br />
TB and acquire over 1 TB per year, <strong>of</strong>ten <strong>of</strong> duplicate datasets. Four <strong>of</strong> the 12 projects using AVHRR store<br />
more than 10TB <strong>of</strong> historical imagery and also acquire over 1 TB annually. Direct access to time series data<br />
is becoming increasingly valuable <strong>for</strong> many projects, both to gain an historical perspective on environmental<br />
change, and to detect and identify specific patterns and drivers, such as during disaster conditions. CSIRO<br />
has compiled the master time series <strong>of</strong> raw data <strong>for</strong> the AVHRR series <strong>of</strong> instruments in the Australasian<br />
region, and AusCover TERN will be placing several AVHRR-derived land cover datasets onto its open-access<br />
portal by 2013.<br />
Should the current sources <strong>of</strong> Low Resolution Optical data became unavailable, most respondents thought<br />
that substitute data sources could be used if necessary, or would become available in the near future. While<br />
AVHRR may be used as a substitute supply source <strong>for</strong> MODIS imagery where spatial resolution is not<br />
critical, it is not suitable <strong>for</strong> some projects, such as flood mapping, which require SWIR data. MERIS (Envisat)<br />
and OLCI (Sentinel-3) were cited as the most likely replacement data sources <strong>for</strong> MODIS, assuming that<br />
the data will be freely available and easy to download directly into <strong>Australia</strong>n ground stations or from ESA<br />
archive server systems. Other possible alternate sources <strong>for</strong> MODIS and AVHRR include VIIRS (on NPP and<br />
JPSS series, nominally the <strong>of</strong>ficial replacement <strong>for</strong> both MODiS and AvHRR), vEGEtAtiON (on SPOt-4 and<br />
SPOT-5) and imaging sensors on geostationary satellites like MTSAT.<br />
<strong>Continuity</strong> <strong>of</strong> <strong>Earth</strong> <strong>Observation</strong> <strong>Data</strong> <strong>for</strong> <strong>Australia</strong>: R&D • January 2012 45
Supply Arrangements<br />
The 25 projects accessing MODIS data currently use a variety <strong>of</strong> channels <strong>for</strong> supply. The majority access the<br />
data independently via Internet from the relevant USA government on-line archives (e.g. the Land Products<br />
Distributed Active Archive Centre, LPDAAC, run by USGS). The data is supplied on a public good basis<br />
without charge, and there are no <strong>for</strong>mal agreements in place governing the availability or supply <strong>of</strong> the data.<br />
Eight <strong>of</strong> the projects surveyed, including several heavy users <strong>of</strong> this data class, receive MODIS data from the<br />
direct broadcast signal <strong>of</strong> the satellite. <strong>Australia</strong> has eight MODIS/AVHRR reception stations in six locations<br />
around the country (Perth, Darwin, Melbourne, Townsville, Alice Springs, Hobart) together with network<br />
infrastructure (like the <strong>Australia</strong>n Academic and <strong>Research</strong> Network, AARNet) and processing capability<br />
to merge data (e.g. CSIRO High Per<strong>for</strong>mance Scientific Computing facility, HPSC). In a collaborative ef<strong>for</strong>t<br />
between IMOS, AusCover TERN, GA, BoM and the National Computing Infrastructure (NCI), a national<br />
satellite processing facility <strong>for</strong> MODIS/AVHRR/VIIRS data is being configured at the High Per<strong>for</strong>mance<br />
Computing and Communications Centre (HPCCC; a collaborative facility supporting the BoM and CSIRO)<br />
and the NCI (hosted by the <strong>Australia</strong>n National University, ANU). Many <strong>of</strong> the <strong>Australia</strong>n downlink facilities<br />
transfer their data directly to the HPSC where it is initially managed and processed <strong>for</strong> use in climate and<br />
weather monitoring. Some <strong>of</strong> this functionality may be transferred to the NCI at a later date. The access link<br />
to Canberra is being upgraded in the near future, which will halve the current data transfer time (<strong>of</strong> three<br />
hours) following image acquisition.<br />
About half <strong>of</strong> <strong>Australia</strong>’s research users receive AVHRR data via direct broadcast signal from the host<br />
satellites. The remainder obtain the data by Internet download. BoM/CAWCR and AIMS are also able<br />
to make use <strong>of</strong> the WMO’s Global Telecommunication System (GTS) <strong>for</strong> supply <strong>of</strong> AVHRR and MODIS<br />
data. Many <strong>of</strong> the current data acquisition and archiving tasks appear to have been inherited by individual<br />
researchers, rather than <strong>for</strong>mally assumed as responsibilities by research organisations. As such, delivery<br />
<strong>of</strong> data updates can be affected by the workload <strong>of</strong> those individuals, rather than guaranteed to follow a<br />
reliable timetable.<br />
Technical failures early in 2011 have limited the direct-to-user broadcast capability <strong>of</strong> the Metop-A satellite.<br />
This capability has been a key feature <strong>of</strong> NOAA’a AVHRR data distribution system, which impacts near realtime<br />
reception <strong>of</strong> the data in <strong>Australia</strong>.<br />
The main research users <strong>of</strong> MERIS data in <strong>Australia</strong> (CSIRO Land and Water) are Principal Investigators and<br />
have access to an ftp data feed courtesy <strong>of</strong> that agreement (although data is only available several days after<br />
image acquisition). In recent years ESA has relaxed the restrictions on access to MERIS data (in line with<br />
their overall trend to a free and open data policy) and data is available on-line via the MERIS Catalogue and<br />
Inventory (MERCI).<br />
The multitude <strong>of</strong> other instruments utilised by BoM and CAWCR are acquired through a variety <strong>of</strong> means,<br />
including operational data systems, the WMO GTS, and on-line archives.<br />
46 <strong>Continuity</strong> <strong>of</strong> <strong>Earth</strong> <strong>Observation</strong> <strong>Data</strong> <strong>for</strong> <strong>Australia</strong>: R&D • January 2012
3.3.2 Medium Resolution Optical (10–80m)<br />
Overview<br />
EO DATA REQUIREMENTS: CURRENT<br />
Medium Resolution Optical sensors record reflectance in the visible and infrared (including thermal)<br />
wavelengths with geometric pixel sizes greater than 10m and less than or equal to 80m (see Table 2-2).<br />
Medium resolution optical sensors have traditionally been operated <strong>for</strong> public good, but an increasing<br />
number <strong>of</strong> commercial sensors have also become available.<br />
This ‘paddock scale’ or ‘management scale’ data is used by a wide range <strong>of</strong> operational programs in <strong>Australia</strong><br />
including:<br />
• Emergency management (bushfires, earthquakes, floods, and storms);<br />
• Mapping and monitoring land use and degradation, natural resources and vegetation dynamics;<br />
• Water usage and quality,<br />
• Drought;<br />
• Pollution; and<br />
• Minerals.<br />
Medium resolution optical data products are being used to:<br />
• Manage <strong>for</strong>ests, rivers, fisheries, catchments and agriculture;<br />
• Develop national inventories <strong>of</strong> <strong>for</strong>ests, greenhouse gases, endangered species, maritime boundaries,<br />
land cover, topography, and carbon sinks; and<br />
• Verify residential housing development applications, rural taxation valuations and environmental<br />
compliance (Geoscience <strong>Australia</strong>, 2011).<br />
Supporting these operational programs, the R&D community uses Medium Resolution Optical data as an<br />
essential input to 23 <strong>of</strong> the surveyed projects (41% <strong>of</strong> the sample across 17 different research groups). Of<br />
these 23 projects, 19 cited linkages to 48 current operational programs in <strong>Australia</strong>. The application areas<br />
being supported by this research are listed in Table 3-13.<br />
Table 3-13 Projects Dependent on Medium Resolution Optical <strong>Data</strong><br />
Application Area Number <strong>of</strong> Surveyed Projects<br />
Monitoring vegetation, biomass, ground cover, <strong>for</strong>ests and <strong>for</strong>est carbon 7<br />
Delivering national EO-based products <strong>for</strong> terrestrial and marine studies 5<br />
Mapping floods and wetlands 4<br />
Managing precision agriculture and irrigation 2<br />
Mapping fires, fire scars and estimating bushfire emissions 2<br />
Monitoring inland water quality and coastal habitats 2<br />
Updating land use in<strong>for</strong>mation 1<br />
Validating future sensors 1<br />
Current Usage<br />
The Medium Resolution Optical sensors being used in EO-related research in <strong>Australia</strong> are listed in Table<br />
3-14. The most popular single data source is Landsat-5/7 TM/ETM+, being used by nearly 40% <strong>of</strong> all<br />
surveyed projects.<br />
<strong>Continuity</strong> <strong>of</strong> <strong>Earth</strong> <strong>Observation</strong> <strong>Data</strong> <strong>for</strong> <strong>Australia</strong>: R&D • January 2012 47
Medium Resolution<br />
Optical Sensor<br />
Table 3-14 Usage <strong>of</strong> Medium Resolution Optical <strong>Data</strong><br />
Entries indicate the number <strong>of</strong> projects<br />
Essential Advantageous<br />
EO <strong>Data</strong> Importance Rating<br />
Essential +<br />
Advantageous<br />
48 <strong>Continuity</strong> <strong>of</strong> <strong>Earth</strong> <strong>Observation</strong> <strong>Data</strong> <strong>for</strong> <strong>Australia</strong>: R&D • January 2012<br />
Opportunistic Promising<br />
Landsat TM/ETM+ 22 4 26 2 0<br />
AVNIR 4 0 4 0 0<br />
SPOT 3 1 4 0 0<br />
ASTER 3 0 3 2 0<br />
TOTAL 32 5 37 4 0<br />
About half the projects requiring Medium Resolution Optical sensors use national scale data, with a<br />
smaller proportion needing state or regional coverage. Desired frequency <strong>of</strong> coverage varies with the type<br />
<strong>of</strong> application. Current expectations <strong>for</strong> coverage may be partially dictated by the availability <strong>of</strong> Landsat<br />
imagery, with some projects requesting a <strong>for</strong>tnightly update cycle and others only needing updated<br />
in<strong>for</strong>mation each month, quarter, or year, or to coincide with specific events or conditions. Most projects can<br />
accept several weeks delay in data delivery, but a few require new data within days <strong>of</strong> acquisition.<br />
The most commonly specified spectral requirements were <strong>for</strong> visible channels and NIR, although SWIR was<br />
also necessary <strong>for</strong> woody vegetation mapping and water detection in about a quarter <strong>of</strong> these projects. TIR<br />
was required <strong>for</strong> evapotranspiration studies. Some researchers would prefer access to a Medium Resolution<br />
Optical data source with a greater number <strong>of</strong> channels to achieve improved discrimination <strong>of</strong> herbaceous<br />
versus woody vegetation, water features, better atmospheric and other corrections, and increased accuracy<br />
<strong>of</strong> measurements.<br />
Between 2000 and 2010, 100 TB <strong>of</strong> raw telemetry Landsat data over <strong>Australia</strong> have been archived by GA.<br />
Other projects are maintaining archives <strong>of</strong> up to 15 TB <strong>of</strong> Landsat data, with annual acquisitions <strong>of</strong> up to 1<br />
TB. Smaller volumes <strong>of</strong> AVNIR, SPOT and ASTER imagery are also being acquired and stored to support<br />
current <strong>Australia</strong>n EO-related research.<br />
Possible substitute data sources <strong>for</strong> Landsat imagery included airborne imagery and a number <strong>of</strong> different<br />
satellite series including SPOT, CBERS, RESOURCESAT, DMC, THEOS, Kompsat, Formosat-3, and RapidEye.<br />
Most researchers stressed that use <strong>of</strong> these substitutes would involve a considerable amount <strong>of</strong> ef<strong>for</strong>t to<br />
modify algorithms and processing procedures, and that the vast majority <strong>of</strong> alternate sources do not <strong>of</strong>fer<br />
the resolution, number and position <strong>of</strong> spectral bands or the reliability <strong>of</strong> the Landsat series.<br />
Supply Arrangements<br />
Landsat imagery is currently only available from the Landsat-7 satellite. This sensor is decades past its design<br />
life and has had ongoing image striping problems since 2003, which reduces the utility <strong>of</strong> that data. Until<br />
November 2011, when imaging activities were suspended <strong>for</strong> 90 days due to major hardware problems,<br />
Landsat-5 had been the primary data source <strong>of</strong> Medium Resolution Optical data in <strong>Australia</strong> <strong>for</strong> over 20<br />
years, with decreasing reliability during the last decade. Since the LDCM will not be operational be<strong>for</strong>e June<br />
2013, and given the inadequate operation <strong>of</strong> Landsat-7, continuity <strong>of</strong> Medium Resolution Optical imagery is<br />
a major concern <strong>for</strong> all <strong>Australia</strong>n users.<br />
GA has a data reception agreement with NASA/USGS to routinely acquire and archive Landsat imagery<br />
<strong>for</strong> <strong>Australia</strong>. A range <strong>of</strong> corrected products has been developed <strong>for</strong> <strong>Australia</strong>n conditions, which are<br />
supplied on a commercial basis. Problems associated with ageing downlink infrastructure and data transfer<br />
arrangements between the reception site and the processing facility are being addressed.<br />
Since 2008, USGS has provided free on-line access (via the Global Visualisation Viewer, GLOVIS) to the
EO DATA REQUIREMENTS: CURRENT<br />
archive <strong>of</strong> Landsat imagery. While acquired imagery is available from this system within two weeks, some<br />
researchers would prefer a delay <strong>of</strong> less than one week.<br />
Most Landsat data being used in <strong>Australia</strong>n R&D is now accessed as public good (no agreement) via ftp/<br />
Internet download from USGS. Geoscience <strong>Australia</strong> researchers gain access to Landsat via their data<br />
reception agreement or local archives. One research project in this survey uses the Landsat-derived NCAS<br />
product archive.<br />
Some researchers felt that quality control procedures were largely unnecessary with this data source and<br />
simply use the data as supplied, but others prefer to undertake their own geometric and atmospheric<br />
correction processing. A small number <strong>of</strong> geometric errors (placement) have been observed with USGSsupplied<br />
imagery. Several researchers also collaborate with NASA/USGS to calibrate and validate <strong>Australia</strong>n<br />
Landsat data.<br />
Historical imagery from AVNIR-2 (Advanced Visible and Near Infrared Radiometer type 2) onboard ALOS<br />
is currently used by four projects via the original research agreement. A small volume <strong>of</strong> SPOT imagery is<br />
acquired commercially by three projects. <strong>Research</strong> agreements enable three other projects to access the 10year<br />
ASTER archive.<br />
3.3.3 High Resolution Optical (
Table 3-15 Projects Dependent on High Resolution Optical <strong>Data</strong><br />
Application Area Number <strong>of</strong> Surveyed Projects<br />
Monitoring inland water quality and coastal habitats 4<br />
Delivering national EO-based products <strong>for</strong> terrestrial and marine studies 3<br />
Mapping and monitoring weeds, <strong>for</strong>ests, and greenhouse gases 3<br />
Managing precision agriculture and viticulture 2<br />
Mapping geoscience resources and soils 2<br />
Developing and testing feature extraction methods 1<br />
Mapping vegetation type and land degradation 1<br />
Validating satellite sensors <strong>for</strong> Antarctica 1<br />
As well as the 17 projects that considered High Resolution Optical data as an essential input, nine others<br />
rated it as advantageous. These projects were focused on mapping fires or their impacts and other disasters,<br />
managing irrigation, detecting weeds, monitoring ground cover, and defence.<br />
In particular, two <strong>of</strong> the surveyed projects use Unmanned Aerial Vehicles (UAVs) routinely to collect<br />
Ultra-high Resolution (1–10 cm pixels) Multispectral and Hyperspectral imagery, Thermal Imagery and/or<br />
Topographic data. Compared with traditional airborne plat<strong>for</strong>ms, these vehicles <strong>of</strong>fer the advantages <strong>of</strong> low<br />
cost, frequent and flexible timing, ultra-high spatial resolution and integration <strong>of</strong> multiple sensors to address<br />
a wide range <strong>of</strong> niche applications. Field measurements can be made coincidentally and linked to aerial data<br />
<strong>for</strong> validation and calibration. Experimental datasets have been used to map:<br />
• Coastal erosion, landslides, stock piles and quarry faces<br />
• Moss bed health in Antarctica (as an indicator <strong>of</strong> climate change)<br />
• Vineyards, orchards, agricultural weeds, plant vigour and drought stress; and<br />
• Paddock scale terrain models.<br />
Current Usage<br />
For the purposes <strong>of</strong> this report, High Resolution Optical sensors being used in EO-related research in<br />
<strong>Australia</strong> are grouped into three source categories, namely commercial satellites, in-house airborne, and<br />
commercial airborne (see Table 3-16). The most popular category is commercial satellite imagery, being<br />
essential to 16% <strong>of</strong> all surveyed projects. Commercial satellite sources <strong>for</strong> High Resolution Optical imagery<br />
that were cited by respondents include Quickbird, Worldview, Ikonos, RapidEye, SPOT, Formosat and DMC.<br />
High Resolution<br />
Optical Sensor<br />
Table 3-16 Usage <strong>of</strong> High Resolution Optical <strong>Data</strong><br />
Entries indicate the number <strong>of</strong> projects<br />
Essential Advantageous<br />
EO <strong>Data</strong> Importance Rating<br />
Essential +<br />
Advantageous<br />
50 <strong>Continuity</strong> <strong>of</strong> <strong>Earth</strong> <strong>Observation</strong> <strong>Data</strong> <strong>for</strong> <strong>Australia</strong>: R&D • January 2012<br />
Opportunistic Promising<br />
Commercial satellites 9 5 14 3 0<br />
In-house airborne 6 2 8 1 1<br />
Commercial airborne 1 0 1 0 0<br />
TOTAL 16 7 23 4 1<br />
Half <strong>of</strong> the projects requiring High Resolution Optical data as an essential input need coverage <strong>of</strong> research<br />
sites only, and about a third need regional coverage. Two projects researching coastal and inland water<br />
quality need national coverage.
EO DATA REQUIREMENTS: CURRENT<br />
Frequent imagery was not paramount <strong>for</strong> most projects, with responses evenly spanning the full range<br />
<strong>of</strong> options. Several projects required image acquisition to be coordinated with field work, acquisition <strong>of</strong><br />
other imagery, or conditions which optimise target discrimination. Many projects only require imagery to<br />
be updated annually. High revisit frequency was valuable <strong>for</strong> coastal and inland water studies to maximise<br />
coordination with in situ sensors <strong>for</strong> calibration purposes, and <strong>for</strong> disaster mapping.<br />
Latency was less critical <strong>for</strong> this data type than <strong>for</strong> the lower resolution optical data, with most projects (but<br />
not all) being satisfied with delays <strong>of</strong> weeks or more.<br />
The most common single spectral requirement mentioned by respondents was NIR, with several projects<br />
also mentioning the need <strong>for</strong> visible, SWIR and TIR. Increased spectral resolution was particularly important<br />
<strong>for</strong> water and geoscience applications. SPOT imagery was deemed less suitable <strong>for</strong> water applications due to<br />
the absence <strong>of</strong> a blue channel.<br />
Accurate geolocation is important <strong>for</strong> most users <strong>of</strong> High Resolution Optical imagery. Spatial resolutions<br />
required from satellite sources ranged evenly between 0.5 m to 5 m pixels, whereas typical spatial<br />
resolutions <strong>for</strong> High Resolution Optical imagery from airborne sources were 1 cm to 50 cm. The lower<br />
spatial resolutions desired from satellite sources are not provided by all available High Resolution Optical<br />
sensors.<br />
About 40% <strong>of</strong> the projects relying on High Resolution Optical data involve calibration and/or validation with<br />
ground-based in<strong>for</strong>mation. In some projects, High Resolution Optical data is used as a <strong>for</strong>m <strong>of</strong> ground truth<br />
<strong>for</strong> other data types.<br />
Despite the higher spatial resolution, the reduced area <strong>of</strong> coverage means that smaller volumes <strong>of</strong> High<br />
Resolution Optical data are being archived by these projects compared with the lower spatial resolution<br />
optical data types. The volume <strong>of</strong> data associated with airborne imagery presents a data management<br />
problem <strong>for</strong> some researchers.<br />
Most respondents believed that a sufficient range <strong>of</strong> high resolution commercial sensors now exist to<br />
allow at least one substitute satellite-based data source to be used if necessary. In most cases, airborne<br />
imagery could also be used if funds permit. Acquiring High Resolution Optical imagery from custom<br />
airborne missions is expensive and some projects relied upon aerial photography from routine state-wide<br />
coverages instead.<br />
Supply Arrangements<br />
Most projects cited use <strong>of</strong> multiple sources <strong>of</strong> High Resolution Optical imagery from commercial sources:<br />
• Quickbird: 5 projects<br />
• Worldview-2: 4 projects<br />
• Ikonos: 4 projects<br />
• RapidEye: 2 projects<br />
• SPOT: 2 projects<br />
• Formosat: 1 project; and<br />
• DMC: 1 project.<br />
Most commercial imagery is generally distributed via physical media, <strong>of</strong>ten with a <strong>for</strong>tnight delay between<br />
order and delivery. The majority <strong>of</strong> researchers apply their own atmospheric and geometric corrections to<br />
the supplied data, with mosaicking being required <strong>for</strong> large area studies.<br />
While commercial imagery has typically been expensive relative to other EO data sources, some suppliers<br />
<strong>of</strong>fer discounts <strong>for</strong> combined orders from a consortium <strong>of</strong> users. These arrangements can significantly<br />
reduce the per image cost. Most vendors also allow purchased data to be jointly owned by up to five users,<br />
which further reduces the unit cost, although some levy a surcharge <strong>for</strong> each new owner.<br />
A continued supply is expected <strong>for</strong> these sensors, due to ongoing defence and civilian usage.<br />
<strong>Continuity</strong> <strong>of</strong> <strong>Earth</strong> <strong>Observation</strong> <strong>Data</strong> <strong>for</strong> <strong>Australia</strong>: R&D • January 2012 51
3.3.4 Synthetic Aperture Radar<br />
Overview<br />
Synthetic Aperture Radar (SAR) instruments transmit pulses <strong>of</strong> radio waves at a target and measure the<br />
returned echo wave<strong>for</strong>ms. These wavelengths have the ability to penetrate vegetation and sample surface<br />
roughness and dielectric properties, and are unaffected by cloud cover, weather conditions and solar<br />
illumination. Instruments are designed to measure different wavelengths and polarisations, either individually<br />
or in combination, to discern particular properties <strong>of</strong> the target.<br />
three frequencies are commonly used <strong>for</strong> satellite-based SAR sensors: C-band, L-band and X-band (see<br />
Table 2-2). The characteristics <strong>of</strong> these frequency ranges are detailed in Table 3-17.<br />
Table 3-17 Characteristics <strong>of</strong> SAR Frequencies<br />
Band Frequencies Wavelengths Applications Advantages<br />
L-band 1–2 GHz 15–30 cm<br />
C-band 4–8 GHz 3.8–7.5 cm<br />
X-band 8–12.5 GHz 2.4–3.8 cm<br />
Floods,<br />
Soil Moisture, Vegetation<br />
Ocean, Ice,<br />
Vegetation<br />
Defence,<br />
Land Surface,<br />
52 <strong>Continuity</strong> <strong>of</strong> <strong>Earth</strong> <strong>Observation</strong> <strong>Data</strong> <strong>for</strong> <strong>Australia</strong>: R&D • January 2012<br />
Less sensitive to surface textural changes;<br />
penetrates canopies <strong>for</strong> biomass estimation;<br />
also used <strong>for</strong> surface de<strong>for</strong>mation mapping<br />
Wavelengths suit ocean roughness to<br />
determine wind vectors and currents<br />
High resolution <strong>for</strong> feature detection<br />
SAR data is used by 14 operational programs in <strong>Australia</strong> to map and monitor natural disasters, land use,<br />
<strong>for</strong>est carbon, sea ice, marine borders, mineral resources, sea level, subsidence, woody vegetation and<br />
soil moisture (Geoscience <strong>Australia</strong>, 2011). Being relatively unaffected by solar illumination and weather<br />
conditions, SAR data is particularly useful <strong>for</strong> night time surveillance, and monitoring tropical areas in<br />
northern <strong>Australia</strong> and cloudy areas such as Tasmania.<br />
Various bands <strong>of</strong> SAR data, from airborne and space-borne sensors, are essential inputs to nine <strong>of</strong> the<br />
surveyed projects (16% <strong>of</strong> the sample across six different research groups). These projects collectively<br />
cited linkages to 12 operational programs in <strong>Australia</strong> (see Appendix B). The SAR frequencies considered<br />
as essential to this research are summarised in Table 3-18. X-band and C-band SAR were also rated as<br />
advantageous <strong>for</strong> mapping floods and soil moisture.<br />
Table 3-18 Projects Dependent on SAR <strong>Data</strong><br />
Project SAR Frequencies<br />
Mapping and monitoring Antarctic Fast Ice C-band<br />
AusCover TERN L-band<br />
Flood Dynamics in Semi-arid Wetlands L-band<br />
Mapping Vegetation Biomass L-band<br />
Soil Moisture L-band<br />
Defence X-band<br />
International Forest Carbon Initiative X-band, C-band, L-band<br />
Current Usage<br />
The SAR sensors being used in EO-related research in <strong>Australia</strong> are listed in Table 3-19. The most popular<br />
single data source is PALSAR, being used by five projects. This usage may be influenced by increasing data<br />
accessibility and free access via research agreements. A significant number <strong>of</strong> researchers considered the
EO DATA REQUIREMENTS: CURRENT<br />
various <strong>for</strong>ms <strong>of</strong> SAR data as ‘promising’ <strong>for</strong> future use, particularly L-band, provided that data costs are low<br />
and data is more widely accessible <strong>for</strong> routine use.<br />
X-band<br />
C-band<br />
L-Band<br />
SAR Sensor<br />
Table 3-19 Usage <strong>of</strong> SAR <strong>Data</strong><br />
Entries indicate the number <strong>of</strong> projects<br />
Essential Advantageous<br />
EO <strong>Data</strong> Importance Rating<br />
Essential +<br />
Advantageous<br />
Opportunistic Promising<br />
COSMO-SkyMED 1 2 3 1 0<br />
Airborne 1 0 1 0 0<br />
TerraSAR-X 0 1 1 0 0<br />
Total X-band (2) (3) (5) (1) (0)<br />
ASAR (Envisat) 2 1 3 0 1<br />
SAR (Radarsat) 1 3 4 0 1<br />
SAR (Sentinel-1)* 0 0 0 0 1<br />
Total C-band (3) (4) (7) (0) (3)<br />
PALSAR** 5 0 5 1 0<br />
Airborne (inhouse)<br />
2 0 2 0 0<br />
SMAP SAR* 1 0 1 0 0<br />
Total L-band (8) (0) (8) (1) (0)<br />
TOTAL <strong>for</strong> all bands 13 7 20 2 3<br />
* Not yet operational<br />
** Terminated operations in April 2011<br />
The scale <strong>of</strong> temporal and spatial coverage, spatial resolution, and latency required <strong>for</strong> all SAR data varied<br />
widely between research projects. Timing <strong>of</strong> acquisitions was important to enable several projects to coordinate<br />
with in situ measurements and/or optical data acquisition.<br />
Depending on the coverage required, acquisition, processing and archiving <strong>of</strong> C-band SAR (ASAR, Envisat,<br />
Radarsat) was reported to be time-consuming, and can generate up to 3-4 TB <strong>of</strong> data per year.<br />
Most respondents thought that substitute sensors were available <strong>for</strong> X-band and C-band SAR, but not <strong>for</strong><br />
L-band. The continuity risk <strong>for</strong> this data type is considerable. With the termination <strong>of</strong> PALSAR operations in<br />
April 2011, there is no current source <strong>of</strong> regular L-band SAR data from space.<br />
Supply Arrangements<br />
SAR sensors being used in <strong>Australia</strong> are either operated as research instruments or supplied by<br />
commercial enterprises.<br />
ALOS PALSAR (L-band) was supplied mainly as public good data (via research agreement with GA), which<br />
restricted operational usage <strong>of</strong> the data. However this source is no longer available, so future research will<br />
have to rely on historical data only. C-band data from Envisat ASAR is supplied as public good (third party or<br />
research agreement), or can be obtained via commercial arrangements from Radarsat. Airborne L-band data<br />
can also be acquired through facilities at Monash University.<br />
the X-band SAR data currently being used are either from commercial sources (COSMO-SkyMed)<br />
or acquired using in-house instruments. Flexibility <strong>of</strong> COSMO-SkyMed is an issue <strong>for</strong> some users or<br />
applications. In-house airborne acquisition is available to DSTO via the Ingara system.<br />
<strong>Continuity</strong> <strong>of</strong> <strong>Earth</strong> <strong>Observation</strong> <strong>Data</strong> <strong>for</strong> <strong>Australia</strong>: R&D • January 2012 53
3.3.5 Passive Microwave Radiometry<br />
Overview<br />
Passive Microwave Radiometers detect microwave radiation that is naturally emitted from the <strong>Earth</strong>’s land,<br />
seas and atmosphere as a result <strong>of</strong> thermal heating (see Table 2-2). The various temperatures measured<br />
by Passive Microwave Radiometers indicate physical properties and material states, and are unaffected by<br />
cloud cover, weather conditions and solar illumination. These passive instruments <strong>of</strong>fer accurate spectral<br />
measurements but poor spatial resolution. They are primarily used to map snow and ice, but can also infer<br />
soil moisture content and ocean salinity.<br />
Passive Microwave Radiometry is used by only four operational programs in <strong>Australia</strong>. These are involved<br />
with modelling ocean processes, refining geoid models, mapping soil moisture and groundwater hydrology,<br />
and monitoring Antarctic sea ice (GA, 2011).<br />
This data type is an essential input to seven <strong>of</strong> the surveyed projects (12.5% <strong>of</strong> the sample across five<br />
different research groups). Of these seven projects, five cited linkages to seven current operational programs<br />
in <strong>Australia</strong>. The application areas being supported by these research projects are listed in Table 3-20. This<br />
data type was also used to estimate soil moisture <strong>for</strong> correction <strong>of</strong> large area L-band SAR mosaics as part<br />
<strong>of</strong> a vegetation biomass mapping project.<br />
Table 3-20 Projects Dependent on Passive Microwave Radiometry<br />
Application Area Number <strong>of</strong> Surveyed Projects<br />
Monitoring soil moisture and groundwater 4<br />
Delivering national EO-based products <strong>for</strong> terrestrial and marine studies 3<br />
Monitoring sea surface temperature, height and salinity 3<br />
Precipitation and climate modelling and prediction 3<br />
Identification <strong>of</strong> water bodies 1<br />
Current Usage<br />
The Passive Microwave Radiometers being used in EO-related research in <strong>Australia</strong> are listed in Table 3-21.<br />
All ‘essential’ R&D usage <strong>of</strong> Passive Microwave Radiometry currently occurs in academic institutions or research<br />
organisations. The most popular single data source was AMSR-E, which was being used as an essential or<br />
advantageous input by nearly 9% <strong>of</strong> all surveyed projects. DMSP and AMSR-E are used operationally by BoM/<br />
CAWCR. AMSR-E terminated operations during the development <strong>of</strong> this report (October 2011).<br />
Passive Microwave<br />
Radiometer<br />
Table 3-21 Usage <strong>of</strong> Passive Microwave Radiometers<br />
Entries indicate the number <strong>of</strong> projects<br />
Essential Advantageous<br />
54 <strong>Continuity</strong> <strong>of</strong> <strong>Earth</strong> <strong>Observation</strong> <strong>Data</strong> <strong>for</strong> <strong>Australia</strong>: R&D • January 2012<br />
EO <strong>Data</strong> Importance Rating<br />
Essential +<br />
Advantageous<br />
Opportunistic Promising<br />
DMSP (SMMR and SMM/I) 4 1 5 0 0<br />
AMSR-E 3 2 5 1 1<br />
SMAP Radiometer* 3 0 3 0 0<br />
SMOS 3 0 3 0 2<br />
Aquarius 2 0 2 0 1<br />
JMR (Jason),<br />
TMR (TOPEX)<br />
1 0 1 0 0<br />
TMI (TRMM) 1 0 1 0 0<br />
Airborne (in-house) 1 0 1 0 0<br />
TOTAL 18 3 21 1 3<br />
*SMAP will not be operational until 2014
EO DATA REQUIREMENTS: CURRENT<br />
Most <strong>of</strong> the projects using Passive Microwave Radiometry as an essential input require daily, global<br />
scale datasets, with the WIRADA project needing national coverage eight times per day. Near real-time,<br />
continuous access is available from most sources, but tMR/JMR data has a longer repeat cycle (9.8 days)<br />
with final products not being available <strong>for</strong> 8-10 weeks after acquisition.<br />
Being passive remote sensing instruments, these sensors typically acquire measurements from large<br />
footprints (4-70km). Monash University acquires airborne Passive Microwave Radiometry with resolution<br />
varying between 50m and 1km depending on flying altitude.<br />
The WIRADA project utilises the TRMM Multi-satellite Precipitation Analysis (TMPA) product from NASA,<br />
which combines data from three sensors to create a three hourly, global precipitation dataset with 25 km<br />
resolution (analysis “3B-42RT”).<br />
Most <strong>Australia</strong>n R&D using Passive Microwave Radiometry incorporates ground-based in<strong>for</strong>mation, such as<br />
rain gauges, tide gauges, weather gauges and moisture probes. The IMOS project provides calibration and<br />
validation data <strong>for</strong> the tPM/JMR satellite dataset.<br />
Passive Microwave Radiometry has lower spatial resolution and a higher revisit frequency than most other<br />
EO data types. <strong>Australia</strong>n coverage from MIRAS (SMOS) currently amounts to 2 GB per day. The WIRADA<br />
archive <strong>of</strong> TMPA data comprises 1 TB.<br />
Substitute data sources suggested by respondents include airborne acquisition, GCOM-W (AMSR-2),<br />
SMOS, SMAP (from 2014), European Centre <strong>for</strong> Medium-Range Weather Forecasts (ECMWF) modelled<br />
fields (with a reduction in quality), and JPSS. While follow-on missions are not guaranteed <strong>for</strong> most research<br />
missions, continuity <strong>of</strong> datasets was at least partially expected by respondents. Future sensors are discussed<br />
in Section 5.<br />
Supply Arrangements<br />
Satellite-based Passive Microwave Radiometry is available to these projects as public good (no agreement),<br />
public good (research agreement) and/or via WMO resolution 40, and procured by ftp download. As part<br />
<strong>of</strong> research agreements, the iMOS project received restricted access to early data from tMR/JMR, and the<br />
MoistureMap project at Monash University has access to restricted data from MIRAS (SMOS) and SMAP<br />
Radiometer (SMAP).<br />
3.3.6 Radar Altimetry<br />
Overview<br />
Radar Altimeters are active sensors that measure the time it takes <strong>for</strong> radio waves to be transmitted,<br />
reflected and returned. These measurements can provide terrain, ice and sea level pr<strong>of</strong>iles with millimetre<br />
accuracy (see Table 2-2).<br />
Radar Altimetry is an essential input to eight <strong>of</strong> the surveyed projects (14% <strong>of</strong> the sample across seven<br />
different research groups). Collectively these eight projects cited linkages to nine current operational<br />
programs in <strong>Australia</strong>. The application areas being supported by this research are listed in Table 3-22. One<br />
project also used airborne Radar Altimetry data <strong>for</strong> geoscience research. This data source was rated as<br />
promising <strong>for</strong> mapping flood levels, and monitoring seagrass and ground cover in the future.<br />
<strong>Continuity</strong> <strong>of</strong> <strong>Earth</strong> <strong>Observation</strong> <strong>Data</strong> <strong>for</strong> <strong>Australia</strong>: R&D • January 2012 55
Table 3-22 Projects Dependent on Radar Altimeter <strong>Data</strong><br />
Application Area Number <strong>of</strong> Surveyed Projects<br />
Delivering national EO-based products <strong>for</strong> marine studies 2<br />
Modelling weather and climate 2<br />
Geoscience applications 2<br />
Validating sensors 2<br />
Current Usage<br />
The Radar Altimeters being used in EO-related research in <strong>Australia</strong> are listed in Table 3-23. The most<br />
popular data source is the Poseidon series <strong>of</strong> sensors carried on the Jason missions. there are no satellitebased<br />
substitutes <strong>for</strong> the sensors currently being used.<br />
Radar Altimeter Sensor<br />
Table 3-23 Usage <strong>of</strong> Radar Altimeters<br />
Entries indicate the number <strong>of</strong> projects<br />
Essential Advantageous<br />
56 <strong>Continuity</strong> <strong>of</strong> <strong>Earth</strong> <strong>Observation</strong> <strong>Data</strong> <strong>for</strong> <strong>Australia</strong>: R&D • January 2012<br />
EO <strong>Data</strong> Importance Rating<br />
Essential +<br />
Advantageous<br />
Opportunistic Promising<br />
Poseidon-2 (Jason-1) 5 0 5 0 0<br />
Poseidon-3 (Jason-2) 5 0 5 0 0<br />
Poseidon-1 (TOPEX) 4 0 4 0 0<br />
TBD RA (Jason-3)* 4 0 4 0 0<br />
RA2 (Envisat) 3 0 3 0 0<br />
Siral (CryoSat-2) 2 0 2 0 0<br />
AltiKa (SARAL)* 1 0 1 0 0<br />
ALT (HY-2A)** 1 0 1 0 0<br />
KaRIN (SWOT)* 1 0 1 0 0<br />
SRAL<br />
(Sentinel-3A/B)*<br />
1 0 1 0 0<br />
SRTM 1 0 1 0 0<br />
Airborne (in-house) 0 1 1 0 0<br />
IceSAT 0 0 0 0 1<br />
TOTAL 28 1 29 0 1<br />
* Not yet operational<br />
** Recently launched but data not yet seen<br />
Most researchers using Radar Altimetry require global data on a daily basis. Where possible, near real-time<br />
data was generally preferred by marine and atmospheric applications. Latency and temporal resolution are<br />
much less important <strong>for</strong> terrestrial applications, such as deriving Digital Elevation Models (DEM).<br />
Most satellite-based Radar Altimetry data has a relatively coarse spatial resolution, and higher resolution data<br />
would be welcomed <strong>for</strong> most research. Simultaneous acquisition <strong>of</strong> other datasets is important, especially <strong>for</strong><br />
sources with less frequent revisit times. Some <strong>of</strong> the sample projects are currently investigating the precision<br />
<strong>of</strong> available Radar Altimetry datasets.<br />
The data volumes currently associated with these projects do not present infrastructure problems.
Supply Arrangements<br />
EO DATA REQUIREMENTS: CURRENT<br />
All sources <strong>of</strong> Radar Altimeter data are available as public good. Two <strong>of</strong> the sample R&D projects have<br />
access to data from SIRAL (Cryosat-2) and AltiKa (SARAL–not yet launched) as part <strong>of</strong> research<br />
agreements. The majority <strong>of</strong> projects access Radar Altimetry datasets via ftp/Internet Download.<br />
3.3.7 Hyperspectral Imagery<br />
Overview<br />
Hyperspectral imagers (also known as ‘imaging spectrometers’) simultaneously acquire reflected radiance<br />
measurements in many narrow, contiguous spectral bands (see Table 2-2). Whereas Multispectral<br />
scanners measure radiance in a small number <strong>of</strong> relatively broad wavelength bands (typically less than ten),<br />
Hyperspectral imagers collect measurements in a much larger number <strong>of</strong> bands (up to hundreds) across the<br />
full imaging surface, focused on adjacent, narrowly defined spectral regions (typically less than 10 nm) in the<br />
visible and infrared spectrum.<br />
These highly resolved image radiance measurements allow continuous spectra to be derived <strong>for</strong> target<br />
features. Once the images are atmospherically corrected, the resulting spectra can then be compared<br />
with field and/or laboratory spectra to identify and map the location <strong>of</strong> surface materials. Hyperspectral<br />
imagery is particularly valuable <strong>for</strong> mapping minerals and soils, atmospheric gas concentrations, man-made<br />
materials, vegetation species, composition and health, shallow coastal and coral reef habitats and water<br />
quality. While it has been used in the defence, atmospheric chemistry and mineral exploration fields <strong>for</strong> over<br />
a decade, Hyperspectral imagery is a relatively new <strong>for</strong>m <strong>of</strong> EO data in most other fields and its utility is still<br />
being assessed in many application areas. It has the potential to allow greater understanding <strong>of</strong> vegetation<br />
dynamics and physiology, and better monitoring <strong>of</strong> greenhouse and other atmospheric gases, and will also<br />
help determine the most discriminating spectral bands <strong>for</strong> particular target materials and/or conditions. This<br />
in<strong>for</strong>mation is also valuable <strong>for</strong> designing future sensors, correcting atmospheric and illumination effects in<br />
other imagery, determining optimum timing (in the diurnal and/or seasonal cycle) <strong>for</strong> target discrimination,<br />
and/or calibrating data from other EO sensors.<br />
Ten <strong>of</strong> the R&D projects (18% <strong>of</strong> the surveyed projects across seven different research groups) deemed<br />
Hyperspectral imagery to be essential to their research. The applications areas relevant to this research are<br />
listed in Table 3-24. Eight <strong>of</strong> these ten projects collectively cited linkages to 12 current <strong>Australia</strong>n operational<br />
EO programs (see Appendix B).<br />
Table 3-24 Projects Dependent on Hyperspectral Imagery<br />
Application Area Number <strong>of</strong> Surveyed Projects<br />
Mapping minerals and soil types 3<br />
Delivering national EO-based products <strong>for</strong> terrestrial studies 2<br />
Mapping vegetation and greenhouse gas emissions 2<br />
Monitoring inland water quality, coastal habitats & coral reef bathymetry 2<br />
Defence 1<br />
Current Usage<br />
Most Hyperspectral imagery is currently acquired from airborne sources operated by <strong>Australia</strong>n private<br />
companies or university groups, and from NASA/USGS in the case <strong>of</strong> Hyperion satellite data. The actual<br />
sensors being used in the ten R&D projects, and their relative usage ratings, are summarised in Table 3-25.<br />
Two research projects are trialling the acquisition <strong>of</strong> Hyperspectral imagery using UAVs.<br />
<strong>Continuity</strong> <strong>of</strong> <strong>Earth</strong> <strong>Observation</strong> <strong>Data</strong> <strong>for</strong> <strong>Australia</strong>: R&D • January 2012 57
Hyperspectral Imager<br />
Table 3-25 Usage <strong>of</strong> Hyperspectral Imagery<br />
Entries indicate the number <strong>of</strong> projects<br />
Essential Advantageous<br />
58 <strong>Continuity</strong> <strong>of</strong> <strong>Earth</strong> <strong>Observation</strong> <strong>Data</strong> <strong>for</strong> <strong>Australia</strong>: R&D • January 2012<br />
EO <strong>Data</strong> Importance Rating<br />
Essential +<br />
Advantageous<br />
Opportunistic Promising<br />
Airborne (in-house) 5 3 8 0 0<br />
Hyperion 2 2 4 0 1<br />
Airborne (HyMap) 2 2 4 2 1<br />
Airborne (HyVista) 2 0 2 1 1<br />
Airborne<br />
(Other Commercial)<br />
1 0 1 0 0<br />
HICO (on ISS) 1 0 1 0 0<br />
HyspIRI* 1 0 1 0 0<br />
TOTAL 14 7 21 3 3<br />
* Not yet developed<br />
Hyperspectral imagery is typically used to acquire intensive measurements over research sites that are<br />
subsequently extrapolated to larger areas using other datasets. Some projects that are involved with geology<br />
or hydrology require state-wide or national coverage. Monthly, or less frequent, updates are satisfactory <strong>for</strong><br />
most research, with a delay <strong>of</strong> weeks between image capture and delivery being acceptable in most cases.<br />
Repeat imagery is <strong>of</strong>ten required to monitor changes.<br />
Timing <strong>of</strong> image acquisition is critical <strong>for</strong> many applications, to co-ordinate with in situ measurements and/or<br />
with periods <strong>of</strong> optimum discrimination <strong>of</strong> target features.<br />
For some application areas, the value <strong>of</strong> Hyperspectral imagery is focused on specific spectral regions, such<br />
as TIR <strong>for</strong> soil moisture research, visible to SWIR <strong>for</strong> vegetation mapping, MIR plus TIR <strong>for</strong> mapping minerals<br />
and soils, or visible to NIR <strong>for</strong> shallow coastal and coral reef bathymetry and benthic cover mapping. Spatial<br />
resolution requirements typically vary from 10 m pixel size (larger <strong>for</strong> TIR bands) down to sub-metre pixels<br />
from airborne plat<strong>for</strong>ms, while the satellite-borne Hyperion Hyperspectral imager acquires 30 m pixels.<br />
The intensive spectral sampling required <strong>for</strong> Hyperspectral imagery generates significant data volumes, but<br />
current <strong>Australia</strong>n archives are manageable.<br />
Supply Arrangements<br />
Most airborne Hyperspectral imagery is supplied commercially on physical media, while Hyperion data is<br />
downloaded via the Internet from the USGS server directly. The TERN AusCover facility is also making the<br />
full Level-1R historical Hyperion archive <strong>for</strong> <strong>Australia</strong> (approximately 3-4 TB) freely available. The use <strong>of</strong><br />
UAVs to acquire Hyperspectral imagery is being investigated in two <strong>of</strong> the surveyed projects.<br />
3.3.8 Lidar<br />
Overview<br />
Lidars are active sensors that use laser returns reflected from solid objects (dust, smoke, vegetation, terrain<br />
and underwater objects) and the timing <strong>of</strong> their return to generate a 3D rendition <strong>of</strong> the geometry <strong>of</strong> the<br />
illuminated objects or surfaces. The different types <strong>of</strong> EO Lidar instruments are summarised in Table 3-26.<br />
Additionally, ground-based hemispherical Lidar is used to model vegetation structure, and correlate with<br />
EOS Lidar data.
Table 3-26 Characteristics <strong>of</strong> Lidar Instruments<br />
EO DATA REQUIREMENTS: CURRENT<br />
Type Description Derived Parameters Sources<br />
Backscatter Lidar<br />
Differential Absorption<br />
Lidar<br />
Doppler Lidar<br />
Ranging and Altimeter Lidar<br />
Laser beam is backscattered,<br />
reflected or re-radiated by the target<br />
to give in<strong>for</strong>mation on scattering and<br />
extinction coefficients <strong>of</strong> atmospheric<br />
layers<br />
Returns from tuneable laser at<br />
different wavelengths are analysed<br />
to determine densities <strong>of</strong> specific<br />
atmospheric constituents<br />
Measures Doppler shift <strong>of</strong> the light<br />
backscattered from particles or<br />
molecules moving with the wind<br />
Provide accurate measurements <strong>of</strong><br />
the distance from a reference height<br />
to precise locations on the <strong>Earth</strong>’s<br />
surface<br />
Cloud and aerosol properties;<br />
atmospheric composition;<br />
volcanic ash<br />
Water vapour and temperature<br />
pr<strong>of</strong>iles<br />
CALIOP (CALIPSO);<br />
ATLID (<strong>Earth</strong>CARE)<br />
Airborne only<br />
Wind velocity pr<strong>of</strong>iles ALADIN (ADM-Aeolus)<br />
Surface topography;<br />
vegetation height and cover;<br />
aerosol height distribution; cloud<br />
height and<br />
vertical pr<strong>of</strong>ile<br />
Airborne only<br />
Lidar is a relatively new <strong>for</strong>m <strong>of</strong> EO data with potential in many application areas (see Table 3-26). It is<br />
considered as an essential input to ten <strong>of</strong> the sample R&D projects (that is, 18% <strong>of</strong> the surveyed projects<br />
over eight research groups). These ten projects collectively cited linkages to 18 current operational programs<br />
in <strong>Australia</strong>. The application areas being supported by this research are listed in Table 3-27. Lidar is also<br />
considered as a promising data source <strong>for</strong> mapping flood levels in the future. In addition, lidar pr<strong>of</strong>iling from<br />
CALIPSO is extremely important <strong>for</strong> vertically resolved observations <strong>of</strong> cloud systems and aerosol including<br />
dust and volcanic ash.<br />
Table 3-27 Projects Dependent on Lidar <strong>Data</strong><br />
Application Area Number <strong>of</strong> Surveyed Projects<br />
Deriving surface models <strong>for</strong> terrain, bathymetry, vegetation height or ice sheets 5<br />
Modelling atmospheric parameters 3<br />
Validating models, sensors and algorithms 3<br />
Delivering national EO-based products <strong>for</strong> terrestrial and marine studies 2<br />
Current Usage<br />
The four sources <strong>of</strong> Lidar data that are being used in EO-related research in <strong>Australia</strong> are listed in<br />
Table 3-28. It is most commonly acquired from airborne plat<strong>for</strong>ms, including UAVs.<br />
Lidar Sensor<br />
Airborne<br />
(in-house)<br />
Table 3-28 Usage <strong>of</strong> Lidar Sensors<br />
Entries indicate the number <strong>of</strong> projects<br />
Essential Advantageous<br />
EO <strong>Data</strong> Importance Rating<br />
Essential +<br />
Advantageous<br />
Opportunistic Promising<br />
5 3 8 3 1<br />
CALIOP (CALIPSO) 3 1 4 0 0<br />
Airborne<br />
(Commercial)<br />
2 0 2 0 1<br />
GLAS (IceSAT)* 1 0 1 0 0<br />
TOTAL 11 4 15 3 2<br />
* No longer operational<br />
<strong>Continuity</strong> <strong>of</strong> <strong>Earth</strong> <strong>Observation</strong> <strong>Data</strong> <strong>for</strong> <strong>Australia</strong>: R&D • January 2012 59
Projects focused on terrestrial applications require infrequent coverage <strong>of</strong> research sites only, while<br />
those involved with meteorological and marine applications need daily, national or regional coverage. It is<br />
important <strong>for</strong> many projects that the timing <strong>of</strong> Lidar data acquisition be co-ordinated with field work and/or<br />
acquisition <strong>of</strong> other EO datasets. For airborne data sources it is increasingly desirable that data from multiple<br />
EO data instruments be coincident and co-registered from a single mission.<br />
Spatial resolutions <strong>of</strong> less than one metre were typically expected from airborne Lidars.<br />
<strong>Data</strong> volumes <strong>for</strong> historical archives <strong>of</strong> CALIOP (CALIPSO) data currently comprise about 10 TB. While<br />
there are multiple suppliers <strong>for</strong> airborne Lidar, there are currently no substitute sources <strong>for</strong> the satelliteborne<br />
Lidar sensors currently being used.<br />
Supply Arrangements<br />
Most commercial airborne Lidar datasets are supplied on physical media. The restricted extent <strong>of</strong> this<br />
data means that it does not present data storage problems. However, the current packaging <strong>of</strong> CALIOP<br />
(CALIPSO) data by NASA into geographic regions around the globe means that daily coverage data <strong>for</strong> the<br />
<strong>Australia</strong>n region takes more than one day to download. Indeed, the large area and frequent revisit times<br />
result in significant data management issues <strong>for</strong> this data source.<br />
3.3.9 Ocean Colour<br />
Overview<br />
Ocean colour instruments are passive, Multispectral radiometers and imaging spectrometers designed to<br />
measure radiance from marine waters in visible and near infrared wavelengths (400–1000 nm), typically<br />
with high spectral resolution and low spatial resolution. Strictly speaking, they could be considered to fall<br />
within the low resolution optical instrument grouping, or indeed within hyperspectral imagers, since it is their<br />
narrow spectral per<strong>for</strong>mance within blue and green bands <strong>for</strong> ocean sensing that is <strong>of</strong> interest. However,<br />
per the classification in the CEOS database, which reflects the fact that ‘ocean colour’ is the subject <strong>of</strong> a<br />
recognised community, and the corresponding data is acquired and processed in a way which supports their<br />
applications, ocean colour is identified here as a valid data type in its own right.<br />
Ocean colour instruments are considered essential <strong>for</strong> six surveyed projects (over 10% <strong>of</strong> the total, in three<br />
research groups). Collectively, these projects cited linkages to nine operational programs. The application<br />
areas associated with these projects are summarised in Table 3-29.<br />
Table 3-29 Projects Dependent on Ocean Colour <strong>Data</strong><br />
Application Area Number <strong>of</strong> Surveyed Projects<br />
Monitoring continental shelf, coastal and inland water quality, and coastal habitats 3<br />
Monitoring and modelling weather and climate 2<br />
Delivering national EO-based products <strong>for</strong> terrestrial and marine studies 1<br />
Current Usage<br />
The Ocean Colour sensors currently being used in EO-related research in <strong>Australia</strong>, and their usage ratings,<br />
are listed in Table 3-30. MODIS and MERIS data are also used <strong>for</strong> Ocean Colour analyses by each <strong>of</strong> these<br />
projects, plus two others (IMOS and BLUELink). Since usage <strong>of</strong> these Low Resolution Optical sensors is<br />
discussed in Section 3.3.1, the numbers in Table 3-30 may underrate the real level <strong>of</strong> research interest in<br />
this data type in <strong>Australia</strong>.<br />
60 <strong>Continuity</strong> <strong>of</strong> <strong>Earth</strong> <strong>Observation</strong> <strong>Data</strong> <strong>for</strong> <strong>Australia</strong>: R&D • January 2012
Ocean Colour Sensor<br />
Table 3-30 Usage <strong>of</strong> Ocean Colour <strong>Data</strong><br />
Entries indicate the number <strong>of</strong> projects<br />
Essential Advantageous<br />
EO <strong>Data</strong> Importance Rating<br />
Essential +<br />
Advantageous<br />
EO DATA REQUIREMENTS: CURRENT<br />
Opportunistic Promising<br />
OCM-2 (Oceansat-2) 4 0 4 0 0<br />
SeaWiFS (OrbView-2) 3 1 4 0 0<br />
GOCI (COMS)* 3 0 3 0 0<br />
TOTAL 10 1 11 0 0<br />
* No coverage <strong>of</strong> <strong>Australia</strong> – covers Korea only<br />
All respondents considered that the currently available sensors <strong>of</strong>fered partial substitutes <strong>for</strong> each other, plus<br />
the (untested) possibility <strong>of</strong> using VIIRS data.<br />
Most projects desire daily, national coverage, with minimum delay. Geostationary sensors, such as GOCI,<br />
trade high temporal frequency (multiple images per day) <strong>for</strong> lower spatial resolution, compared to the<br />
polar-orbiting satellites, such as SeaWiFS and OCM-2, which have a global revisit time <strong>of</strong> two to three days.<br />
Less frequent revisit times introduce particular challenges <strong>for</strong> in situ calibration equipment carried by buoys<br />
and plat<strong>for</strong>ms, and research cruises.<br />
Typical spatial resolutions are currently 1 km pixels, with expectations <strong>for</strong> 300 to 700 m pixels in future<br />
sensors. For most oceanographic phenomena, increased spatial resolution is only valuable with increased<br />
temporal resolution to permit tracking <strong>of</strong> smaller features. Coastal applications, however, would benefit from<br />
higher spatial resolution.<br />
Supply Arrangements<br />
MERIS (Envisat) data is received via ftp/Internet download, though this introduces a delay <strong>of</strong> several days, so<br />
a direct broadcast is preferred. Direct downlink access to OCM-2 is currently being negotiated. Calibration<br />
problems, which reduce the quality <strong>of</strong> OCM-2 data, are also being addressed by NASA, so that a substitute<br />
data source would be available in case the supply <strong>of</strong> MODIS data were to be interrupted.<br />
SeaWiFS ceased operation in December, 2010, so current data usage relies on historical archives.<br />
3.4 Summary<br />
The CEODA-R&D projects are collectively using 59 instruments across 17 EO data types. Of these<br />
59 instruments, 17 are used exclusively by CAWCR/BoM.<br />
The coverage requirements <strong>for</strong> different EO data types vary with different application areas. These are<br />
summarised in Table 3-31 <strong>for</strong> the Priority <strong>Data</strong> Types. Time series data are becoming increasingly important<br />
in most application areas.<br />
The majority <strong>of</strong> researchers now acquire imagery via ftp download. The current EO data archives <strong>for</strong><br />
the surveyed projects are estimated to exceed 300 TB, with annual acquisitions growing rapidly. The<br />
infrastructure implications <strong>of</strong> current EO data supply and usage are discussed in Sections 4, 5 and 6.<br />
<strong>Continuity</strong> <strong>of</strong> <strong>Earth</strong> <strong>Observation</strong> <strong>Data</strong> <strong>for</strong> <strong>Australia</strong>: R&D • January 2012 61
Priority EO<br />
<strong>Data</strong> Type<br />
Optical<br />
– Low<br />
Resolution<br />
Optical –<br />
Medium<br />
Resolution<br />
Optical –<br />
High<br />
Resolution<br />
Synthetic<br />
Aperture<br />
Radar<br />
Passive<br />
Microwave<br />
Radiometry<br />
Radar<br />
Altimetry<br />
Hyper-<br />
spectral<br />
Imagery<br />
Lidar<br />
Ocean<br />
Colour<br />
Table 3-31 EO Coverage Requirements by Application Area<br />
Atmosphere Coasts Oceans Hydrology Geology Vegetation Disasters<br />
Delay Hours Hours Hours Hours - Hours Hours<br />
Repeat Daily Daily Daily Daily Annual Daily Daily<br />
Area Global National Global National National National National<br />
Delay - Hours - Hours - Days/ Weeks Hours<br />
Repeat - Daily - Daily Annual Various -<br />
Area - National - National National National National<br />
Delay - Weeks - Weeks - Days/ Weeks Hours<br />
Repeat - Months - Months Irregular<br />
62 <strong>Continuity</strong> <strong>of</strong> <strong>Earth</strong> <strong>Observation</strong> <strong>Data</strong> <strong>for</strong> <strong>Australia</strong>: R&D • January 2012<br />
Seasonal/<br />
Annual<br />
Irregular<br />
Area - National - National Regional Regional Local<br />
Delay - - Various - Hours<br />
Repeat - - Various - Annual Irregular<br />
Area - - Global National - Regional Local<br />
Delay Hours - Hours Hours - - -<br />
Repeat Daily - Daily Daily - - -<br />
Area Global - Global National - - -<br />
Delay Hours - Hours - - - Hours<br />
Repeat Daily - Daily - Annual + Annual Irregular<br />
Area Global - Global - National National Local<br />
Delay - - - - - Days/ Weeks Hours<br />
Repeat - Biannual - - Annual<br />
Seasonal/<br />
Annual<br />
Irregular<br />
Area - National - - National Local Local<br />
Delay Hours - - - - Days/ Weeks -<br />
Repeat Daily - - - Annual<br />
Seasonal/<br />
Annual<br />
Area Global - - - National Local -<br />
Delay - Hours Hours Hours - - -<br />
Repeat - Daily Daily Daily - - -<br />
Area - National Global National - - -<br />
In situ Ongoing Ongoing Ongoing<br />
Other<br />
GPS,<br />
Gravity, Atmospheric<br />
Chemistry, Atmospheric<br />
Temperature & Humidity,<br />
Cloud Pr<strong>of</strong>ile & Rain<br />
Radars,<br />
<strong>Earth</strong> Radiation Budget<br />
Radiometers, Multiple<br />
Direction/<br />
Polarisation, Scatterometry<br />
GPS GPS<br />
Ongoing/<br />
As required<br />
GPS, Gravity,<br />
<strong>Earth</strong><br />
Radiation<br />
Budget<br />
Radiometry<br />
Ongoing/<br />
As required<br />
GPS,<br />
Multiple<br />
Direction/<br />
Polar-<br />
isation,<br />
Gravity,<br />
Magnetic<br />
Field and<br />
Geo-<br />
dynamic<br />
Ongoing/<br />
As required<br />
-<br />
As<br />
required<br />
GPS GPS
4 EO DATA REQUIREMENTS: FUTURE<br />
EO DATA REQUIREMENTS: FUTURE<br />
Future expectations <strong>of</strong> EO data requirements and supply were identified <strong>for</strong> the 56 sample projects defined<br />
in Section 2. This section highlights significant trends in these results and discusses their implications. Some<br />
caution should be exercised when considering the trends that emerged, however, since researchers were<br />
<strong>of</strong>ten uncertain about their future requirements beyond more than two to three years.<br />
It should also be noted that EO data usage in <strong>Australia</strong>n R&D tends to be somewhat opportunistic,<br />
relying exclusively on data sources that are provided by other nations (frequently free <strong>of</strong> charge). EO data<br />
requirements tend to be framed in terms <strong>of</strong> the systems available, rather than in isolation, or with a view to<br />
specifying domestic needs <strong>for</strong> observing systems.<br />
Awareness <strong>of</strong> future EO satellite program plans also varies significantly among individual researchers, with<br />
some being extremely well in<strong>for</strong>med with regard to alternatives and contingencies (and active in building<br />
the necessary relationships), and others content to use the same data sources to which they have become<br />
accustomed (and unaware <strong>of</strong> the alternatives). Given this, there are fewer conclusions as to future priority<br />
missions <strong>for</strong> <strong>Australia</strong>n researchers than had been anticipated at the study outset. However, this study can<br />
provide a catalyst <strong>for</strong> discussion in the community regarding these priorities, and raise awareness <strong>of</strong> future<br />
EO data supply among researchers. Section 4.6 presents an opinion as to possible future priority missions,<br />
based on known <strong>Australia</strong>n observation priorities and known plans detailed in the CEOS database.<br />
4.1 Expected <strong>Data</strong> Requirements<br />
Using the importance ratings defined in Section 2.1.3, survey results <strong>for</strong> researchers’ expectations <strong>of</strong> future<br />
EO availability, in 2-year and 5-year time frames, are summarised in Tables 4-1 and 4-2 respectively. The<br />
2-year and 5-year change is calculated relative to Table 3-2.<br />
<strong>Continuity</strong> <strong>of</strong> <strong>Earth</strong> <strong>Observation</strong> <strong>Data</strong> <strong>for</strong> <strong>Australia</strong>: R&D • January 2012 63
EO <strong>Data</strong> Type<br />
Optical – Low<br />
Resolution<br />
Optical – Medium<br />
Resolution<br />
Optical – High<br />
Resolution<br />
Hyperspectral<br />
Imagery<br />
Table 4-1 EO <strong>Data</strong> Type Importance: 2-Year Self-Assessment by <strong>Research</strong>ers<br />
Essential Advantageous<br />
64 <strong>Continuity</strong> <strong>of</strong> <strong>Earth</strong> <strong>Observation</strong> <strong>Data</strong> <strong>for</strong> <strong>Australia</strong>: R&D • January 2012<br />
Future Requirements – 2-Year Expected to be Met<br />
Essential +<br />
Advantageous<br />
2-Year<br />
Change<br />
Opportunistic Promising Yes<br />
23 3 26 -3 1 0 23 5<br />
Partially<br />
+ No<br />
20 5 25 -3 1 0 17 10<br />
14 7 21 +4 1 0 18 4<br />
10 6 16 +9 0 0 8 8<br />
Lidar 10 1 11 +4 2 3 8 9<br />
Passive Microwave<br />
Radiometry<br />
Synthetic Aperture<br />
Radar – L band<br />
Atmospheric<br />
Chemistry<br />
7 3 10 0 1 0 4 7<br />
8 1 9 +2 1 0 0 10<br />
7 0 7 0 0 0 4 3<br />
Radar Altimetry 7 0 7 -1 1 0 5 3<br />
Synthetic Aperture<br />
Radar – C band<br />
Synthetic Aperture<br />
Radar – X band<br />
Cloud Pr<strong>of</strong>ile and<br />
Rain Radar<br />
<strong>Earth</strong> Radiation<br />
Budget<br />
Radiometry<br />
3 4 7 -1 1 1 4 4<br />
2 5 7 0 0 0 4 3<br />
3 3 6 0 1 0 1 6<br />
4 1 5 +2 2 0 6 1<br />
Ocean Colour 4 1 5 -2 0 0 1 4<br />
Multiple Direction/<br />
Polarisation<br />
Atmospheric<br />
Temperature and<br />
Humidity Sounding<br />
Gravity, Magnetic<br />
Field and<br />
Geodynamic<br />
3 1 4 -3 0 0 1 3<br />
3 0 3 -2 0 0 3 0<br />
2 1 3 -2 0 1 0 4<br />
Scatterometry 2 0 2 -3 1 0 1 2<br />
56% 44%
EO <strong>Data</strong> Type<br />
Optical – Low<br />
Resolution<br />
Optical –<br />
Medium<br />
Resolution<br />
Optical – High<br />
Resolution<br />
Hyperspectral<br />
Imagery<br />
Table 4-2 EO <strong>Data</strong> Type Importance: 5-Year Self-Assessment by <strong>Research</strong>ers<br />
Essential Advantageous<br />
EO DATA REQUIREMENTS: FUTURE<br />
Future Requirements – 5-Year Expected to be Met<br />
Essential +<br />
Advantageous<br />
5-Year<br />
Change<br />
Opportunistic Promising Yes<br />
22 2 24 -5 0 0 17 7<br />
20 4 24 -4 1 0 19 7<br />
10 10 20 +3 1 0 16 5<br />
9 5 14 +7 0 0 7 7<br />
Lidar 8 5 13 +6 0 2 6 9<br />
Passive<br />
Microwave<br />
Radiometry<br />
Synthetic<br />
Aperture<br />
Radar – L band<br />
Synthetic<br />
Aperture<br />
Radar – C band<br />
Atmospheric<br />
Chemistry<br />
Radar<br />
Altimetry<br />
Synthetic<br />
Aperture<br />
Radar – X band<br />
Cloud Pr<strong>of</strong>ile<br />
and Rain Radar<br />
7 3 10 0 0 0 4 6<br />
9 0 9 +2 0 0 7 2<br />
4 4 8 0 0 0 5 2<br />
6 0 6 -1 0 0 4 2<br />
6 0 6 -2 0 0 2 4<br />
3 3 6 -1 0 0 5 1<br />
3 2 5 -1 1 0 0 6<br />
Ocean Colour 4 0 4 -3 0 0 2 2<br />
Multiple<br />
Direction/<br />
Polarisation<br />
<strong>Earth</strong> Radiation<br />
Budget<br />
Radiometry<br />
Atmospheric<br />
Temperature<br />
and Humidity<br />
Sounding<br />
Gravity,<br />
Magnetic<br />
Field and<br />
Geodynamic<br />
3 0 3 -4 0 0 2 0<br />
2 1 3 0 2 0 4 1<br />
2 0 2 -3 0 0 2 0<br />
2 0 2 -3 0 0 0 2<br />
Scatterometry 2 0 2 -3 0 0 0 2<br />
Partially<br />
+ No<br />
61% 39%<br />
<strong>Continuity</strong> <strong>of</strong> <strong>Earth</strong> <strong>Observation</strong> <strong>Data</strong> <strong>for</strong> <strong>Australia</strong>: R&D • January 2012 65
Keeping in mind the caveats outlined at the beginning <strong>of</strong> Section 4, the following emerge through analysis <strong>of</strong><br />
the survey data:<br />
1. Across the <strong>Australia</strong>n research community, little change is <strong>for</strong>eseen in the Priority <strong>Data</strong> Types over<br />
the next five years – the Types are generally expected to be the same in 2016 as they are now,<br />
with some possible increased usage in Atmospheric Chemistry data anticipated (largely <strong>for</strong> the<br />
correction <strong>of</strong> other EO imagery). The other eight Priority <strong>Data</strong> Types are expected to remain as<br />
important in 2016 as they are now.<br />
2. <strong>Research</strong>ers have indicated an increasing interest in and need <strong>for</strong> Hyperspectral and Lidar data<br />
types, yet many <strong>of</strong> the same researchers do not expect their future requirements to be fully met by<br />
EOS data by 2016. Projections discussed in Sections 5.9 and 5.10 confirm the scarcity <strong>of</strong> suitable<br />
guaranteed satellite sources <strong>for</strong> these data types. It is there<strong>for</strong>e assumed that researchers expect<br />
their future requirements to be met primarily by airborne data sources. A number <strong>of</strong> space-based<br />
Hyperspectral imagers are anticipated within the next 3-5 years, and are generally expected to be<br />
available on commercial terms, once the customary small supply <strong>of</strong> free data <strong>for</strong> R&D purposes is<br />
exceeded.<br />
3. There is also a trend towards increased migration from lower to ever higher optical resolution –<br />
the need <strong>for</strong> High Resolution Optical data, together with that <strong>for</strong> Hyperspectral imagery, appears to<br />
correlate with a decrease in the need <strong>for</strong> Low and Medium Resolution Optical data. Nonetheless,<br />
the latter two data types are still expected to be the highest priorities in 2013 and 2016.<br />
4. SAR data remains a high priority across several projects, with usage <strong>of</strong> L-band data expected to<br />
increase in the future. Over the next two years, the L-band SAR community does not expect its<br />
requirements to be met by EOS data, which reflects the lack <strong>of</strong> imminent space-borne sensors <strong>for</strong><br />
this data type. Some satisfaction appears to be expected by 2016.<br />
5. Cloud Radar data users have the lowest expectation <strong>for</strong> EOS data requirements to be met in the<br />
next five years. While there is no supply scenario outlined in Section 5 (which focuses only on the<br />
Priority <strong>Data</strong> Types), the launch <strong>of</strong> the Global Precipitation Measurement (GPM) Core Observatory<br />
is noted as a possible valuable source <strong>of</strong> data. Since <strong>Australia</strong>n researchers currently enjoy access<br />
to CPR (Cloud Pr<strong>of</strong>iling Radar) data from CloudSat (NASA), this surveyed response is assumed to<br />
indicate that they do not anticipate the availability <strong>of</strong> data from suitable substitutes.<br />
4.2 Future Usage Trends<br />
4.2.1 Hyperspectral Imagery<br />
There is a gradual move from Multispectral to Hyperspectral imagery, as applications require increasing<br />
levels <strong>of</strong> measurement precision and sensor calibration <strong>for</strong> quantitative mapping (e.g. <strong>of</strong> pollutant<br />
concentrations in water). Several projects are eagerly anticipating the wider future availability <strong>of</strong> satellitebased<br />
Hyperspectral imagery <strong>for</strong> vegetation, coastal and geological applications beyond the currently<br />
available civilian demonstrator satellite instruments (Hyperion and CHRIS). The value <strong>of</strong> this data type was<br />
stressed by over a third <strong>of</strong> researchers surveyed. Current research is being developed using Hyperion<br />
archives (held by CSIRO and TERN) and airborne imagery. The fusion <strong>of</strong> Hyperspectral imagery with<br />
SAR or Lidar data is valued <strong>for</strong> defence applications, and <strong>for</strong> improving the separation <strong>of</strong> fractional cover<br />
components in evergreen vegetation.<br />
66 <strong>Continuity</strong> <strong>of</strong> <strong>Earth</strong> <strong>Observation</strong> <strong>Data</strong> <strong>for</strong> <strong>Australia</strong>: R&D • January 2012
4.2.2 Infrared Sensors<br />
EO DATA REQUIREMENTS: FUTURE<br />
Infrared data are essential <strong>for</strong> a large number <strong>of</strong> R&D projects, including those relating to vegetation,<br />
weather, agriculture, irrigation, groundwater, flood mapping, geology and resources exploration studies.<br />
However, concern was expressed over the reduction in IR capability <strong>for</strong> the next generation <strong>of</strong> USA land<br />
surface imaging missions, especially with respect to SWIR and TIR data acquisition.<br />
4.2.3 Multiple <strong>Data</strong> Sources – <strong>Data</strong> Assimilation<br />
There is a growing trend in the environmental area, including weather <strong>for</strong>ecasting and atmospheric analysis,<br />
land surface and ocean analysis, whereby data sources from many sensors are assimilated into a single<br />
analysis system using data assimilation and model-data fusion techniques. This produces consistent analyses<br />
where the weaknesses (e.g. signal noise) <strong>of</strong> some instruments are augmented by the independent and<br />
complementary observations <strong>of</strong> others, and where constraints on in<strong>for</strong>mation retrievals are imposed by<br />
other (non-EOS) observations.<br />
4.3 Expected <strong>Data</strong> Volumes and Access<br />
4.3.1 <strong>Data</strong> Volumes<br />
The CEODA-Ops Report projected the total data storage required <strong>for</strong> 91 <strong>Australia</strong>n operational programs<br />
to be 1.2 PB in 2015, a twentyfold increase on current requirements. Such an increase will impact the entire<br />
EOS supply chain and place significant pressure on supporting infrastructure, including satellite downlink<br />
capabilities and Internet access constraints. This pressure will be felt by both data providers and data users.<br />
While some researchers did not expect future data volumes to change significantly, due to usage <strong>of</strong><br />
historical archives, projected data gaps, or project focus, over 60% <strong>of</strong> surveyed researchers anticipated two<br />
to tenfold increases in EO data volumes in the next five years. These increases will be due to improved<br />
spectral and spatial resolution and revisit frequency, as well as the availability <strong>of</strong> a larger variety <strong>of</strong> high<br />
density data sources (such as Imaging Radar Altimetry, Hyperspectral sensors, and atmospheric pr<strong>of</strong>ilers<br />
with thousands <strong>of</strong> spectral bands). In some instances new plat<strong>for</strong>ms (e.g. Himawari-8, Japan) will be<br />
trans<strong>for</strong>ming capability.<br />
Many <strong>of</strong> these researchers are involved with projects that monitor natural resources and/or deliver<br />
nationally consistent datasets. Greatest increases are expected <strong>for</strong> users <strong>of</strong> Hyperspectral and High<br />
Resolution Optical imagery, though new satellite sources <strong>of</strong> higher-quality Hyperspectral imagery are<br />
not expected be<strong>for</strong>e 2014 at the earliest. As the value <strong>of</strong> time series datasets is becoming more widely<br />
appreciated, many researchers also prefer increased temporal resolution. Increased data frequency not only<br />
allows greater insight into the dynamics <strong>of</strong> an imaged target, but also <strong>of</strong>fers greater opportunity <strong>for</strong> optimal<br />
atmospheric conditions (such as the absence <strong>of</strong> cloud).<br />
The current data volumes being managed by seven <strong>of</strong> the 56 surveyed projects are listed in Table 4-3.<br />
Each <strong>of</strong> these projects involve storage, processing and ongoing acquisition <strong>of</strong> relatively large data volumes.<br />
Their combined expected annual data volumes in 2016 could be up to ten times the current figures, that<br />
is, nearly 300 TB per year. Efficient access to, and archiving <strong>of</strong>, such data volumes will be essential <strong>for</strong> all<br />
research projects.<br />
<strong>Continuity</strong> <strong>of</strong> <strong>Earth</strong> <strong>Observation</strong> <strong>Data</strong> <strong>for</strong> <strong>Australia</strong>: R&D • January 2012 67
CEODA-R&D Project<br />
Table 4-3 Current and Projected <strong>Data</strong> Volumes <strong>for</strong> Selected Projects<br />
Historical Archives<br />
(approx. TB)<br />
68 <strong>Continuity</strong> <strong>of</strong> <strong>Earth</strong> <strong>Observation</strong> <strong>Data</strong> <strong>for</strong> <strong>Australia</strong>: R&D • January 2012<br />
Annual Acquisitions<br />
(approx. TB)<br />
Projected Acquisition in<br />
2016 (TB)<br />
WIRADA (CSIRO) 50 4 40<br />
AusCover TERN (CSIRO) 50 2.5 25<br />
IMOS (CSIRO) 45 13 130<br />
Savanna Burning (CDU) 35 3.5 35<br />
FireWatch (Landgate) 30 3 30<br />
Cal/Val <strong>of</strong> VIIRS/GCOM-SGLI (UTS) 10 2.5 25<br />
Ground Cover Mapping (DERM) 15 0.5 5<br />
Total 235 29.0 58-290<br />
Rough estimates provided by BoM <strong>for</strong> their operational data usage <strong>of</strong> both polar and geostationary satellite<br />
data indicate that their anticipated usage is in the region <strong>of</strong> 60-70TB annually by 2016 (a tenfold increase<br />
from 2011). But only a fraction <strong>of</strong> this might be considered as being within scope <strong>of</strong> the R&D focus <strong>of</strong><br />
this study.<br />
High per<strong>for</strong>mance computing (HPC) requirements are expected to increase, both to cope with the<br />
increased data volume and also to support the implementation <strong>of</strong> new processing standards <strong>for</strong> image<br />
calibration and validation. Several surveyed projects are already utilising the capabilities <strong>of</strong> the NCI to<br />
process large and complex datasets. Computing requirements associated with the processing <strong>of</strong> high<br />
resolution EO data were considered to be the limiting factor in <strong>Australia</strong>n EO-related weather and<br />
climate research.<br />
Some pre-processing procedures that have been traditionally undertaken using in-house facilities will<br />
be expected to be per<strong>for</strong>med by data providers in the future. For example, SMAP plans to deliver a<br />
geo-referenced product that will significantly reduce the pre-processing required <strong>for</strong> current Imaging<br />
Microwave data sources. In such cases the quality <strong>of</strong> supplied data will still need to be validated locally<br />
be<strong>for</strong>e routine use.<br />
The physical storage <strong>of</strong> EO data can be accommodated with continually improving hardware solutions, but<br />
management and access to EO data archives present an ongoing challenge <strong>for</strong> both R&D and operational<br />
users. Current research is addressing the need <strong>for</strong> nested data structures, and consistent product calibration<br />
and validation. National co-ordination <strong>of</strong> EO data access and archives would minimise the potential <strong>for</strong><br />
duplication <strong>of</strong> ef<strong>for</strong>t and redundancy.<br />
For example, there is potential interest in SMOS <strong>for</strong> ocean salinity, and Scatterometers <strong>for</strong> sea-surface<br />
roughness (and there<strong>for</strong>e ocean winds) to be used in weather and climate <strong>for</strong>ecasting. A national facility,<br />
such as IMOS, would be well placed to negotiate national access to these kinds <strong>of</strong> datasets, in preference to<br />
having research groups engaging individually with relevant provider agencies. Such an arrangement would<br />
also help to streamline sharing <strong>of</strong> Cal/Val data.<br />
4.3.2 Infrastructure Efficiencies<br />
An increasing number <strong>of</strong> researchers are anticipating access to national, standardised datasets that are<br />
pre-processed <strong>for</strong> use in particular application areas (such as NDVI coverages <strong>for</strong> vegetation, climate and<br />
groundwater studies). Since many <strong>of</strong> these datasets need to be updated on a daily basis, efficient processing<br />
pathways are essential in ensuring near real-time data delivery.<br />
To minimise delays in accessing newly acquired data and/or data products, high speed Internet access will<br />
also be essential <strong>for</strong> the increasing number <strong>of</strong> EO data sources becoming available on-line. This is equally<br />
important <strong>for</strong> operational EO users, especially <strong>for</strong> applications requiring frequent and/or large area coverage.
EO DATA REQUIREMENTS: FUTURE<br />
For example, by 2013 approximately 200 TB <strong>of</strong> AusCover data products, including base data <strong>for</strong> the<br />
products, will be available on-line. It is expected that ten times this volume will be available by 2016,<br />
that is, up to 2 PB annually <strong>for</strong> new data and products. This increased volume will necessitate upgraded<br />
bandwidth at satellite receiving stations and increased bandwidth <strong>for</strong> data transfer networks, as well as high<br />
per<strong>for</strong>mance computing and storage infrastructure.<br />
It should be remembered that several <strong>of</strong> the most frequently used sensors, such as MODIS and Landsat, will<br />
be replaced with new, but different, data sources over the next few years. It will require a significant research<br />
ef<strong>for</strong>t to re-establish the legacy <strong>of</strong> experience that has been established with these sensors, and standardise<br />
existing archives to allow seamless access to valuable time series data.<br />
Survey results indicate that most <strong>Australia</strong>n researchers are currently acquiring EO data via multiple parallel<br />
access paths to on-line archives, principally from international suppliers. To reduce the overheads and costs<br />
associated with international Internet traffic, it would be worth evaluating the cost-effectiveness <strong>of</strong> an<br />
increased number <strong>of</strong> national archives <strong>for</strong> key datasets. These datasets could be downloaded once from the<br />
international supply agency and maintained and indexed in <strong>Australia</strong> <strong>for</strong> local users. Such an arrangement<br />
would introduce significant savings <strong>for</strong> future EO data access costs.<br />
4.3.3 Low Latency <strong>Data</strong><br />
In the <strong>for</strong>eseeable future, the most common supply channel <strong>for</strong> EO data used by <strong>Australia</strong>n researchers<br />
will continue to be the Internet. <strong>Research</strong>ers will typically utilise ftp servers maintained by supply agencies,<br />
or their data processing partners, to secure their routine data needs. Landsat-8 (LDCM) is believed to be<br />
moving towards a centralised data supply model, with less dependence on overseas ground stations, and<br />
with a central on-line repository at the <strong>Earth</strong> Resources <strong>Observation</strong> and Science (EROS) <strong>Data</strong> Centre.<br />
While the GMES Sentinel series data supply model is not fully defined, it is likely to be based on a similar<br />
arrangement. Further, the distributed ALOS <strong>Data</strong> Node concept that saw local downlink and processing in<br />
<strong>Australia</strong> (by Geoscience <strong>Australia</strong>) will not be repeated and JAXA is understood to be moving towards<br />
a centralised data distribution model. Imagery from the Himawari-8 and -9 missions will not be available<br />
through direct broadcast as with the current MTSAT missions, but will be distributed over the Internet.<br />
Together, these missions are likely to generate the majority <strong>of</strong> future EO data <strong>for</strong> <strong>Australia</strong>n researchers and<br />
a significant increase in future Internet traffic related to the supply and exchange <strong>of</strong> EO data. This will be<br />
compounded by the expected move to higher spatial and spectral resolution data, including High Resolution<br />
Optical, Hyperspectral and Lidar data types.<br />
A number <strong>of</strong> <strong>Australia</strong>n researchers with links to the operational meteorological community, via CAWCR/<br />
BoM or their overseas counterparts, have low latency access to essential EO data supply via the WMO<br />
In<strong>for</strong>mation System (including its Global Telecommunication System, GTS). It is assumed that these<br />
relationships will continue to support the ongoing flow <strong>of</strong> data and, indeed, the number and type <strong>of</strong><br />
instruments whose data is supplied in this way may increase as stronger ties between research space<br />
agencies (such as ESA and JAXA) and their operational counterparts (mainly NOAA and EUMEtSAt)<br />
are developed. Several <strong>of</strong> the research space agency missions are seen as being <strong>of</strong> high importance to<br />
the operational and research meteorology, oceanography and hydrology community, and this is increasing<br />
interest in using WMO distribution systems <strong>for</strong> low latency data distribution.<br />
There are many more researchers who utilise the free access to data available from the direct-broadcast<br />
capabilities <strong>of</strong> USA instruments such as MODIS and Landsat (the two most widely used instruments in<br />
<strong>Australia</strong>n research). Inclusion <strong>of</strong> direct-broadcast is in question <strong>for</strong> LDCM, but is expected to continue <strong>for</strong><br />
the viiRS instruments that continue MODiS heritage on the NPP and JPSS missions (although viiRS may not<br />
satisfy the technical needs <strong>of</strong> some projects currently using MODIS). However, direct broadcast capabilities<br />
are not included in the data architecture plans <strong>for</strong> either the ESA/EC Sentinel series or the <strong>for</strong>thcoming<br />
JAXA missions, which may become significant EO supply sources in future. in this case, the large number <strong>of</strong><br />
R&D projects and related operational activities that have been dependent on direct-broadcast capabilities<br />
will need to reassess data access options. It should be a matter <strong>of</strong> some urgency, there<strong>for</strong>e, to evaluate<br />
<strong>Continuity</strong> <strong>of</strong> <strong>Earth</strong> <strong>Observation</strong> <strong>Data</strong> <strong>for</strong> <strong>Australia</strong>: R&D • January 2012 69
the opportunities <strong>for</strong> low latency data access to the future missions <strong>of</strong> ESA/EC and JAXA with a view to<br />
securing continued access to data with a suitable latency <strong>for</strong> <strong>Australia</strong>n needs.<br />
For example, the systems <strong>for</strong> access to ESA/EC satellite data by <strong>Australia</strong>n researchers, and the policies<br />
that will govern the terms and conditions <strong>for</strong> that access, will affect seven <strong>of</strong> the nine Priority <strong>Data</strong> Types<br />
identified by this study. The same policies and systems can also be expected to be critical <strong>for</strong> operational<br />
programs in <strong>Australia</strong>. Four <strong>of</strong> the seven Priority <strong>Data</strong> Types <strong>for</strong> which ESA will be a key supplier have userdefined<br />
latency requirements <strong>of</strong> ‘hours’. It remains to be seen whether the ESA/EC GMES data architecture<br />
will support <strong>Australia</strong>n needs, unless special provision is planned <strong>for</strong> and negotiated in advance.<br />
The opportunity may exist <strong>for</strong> more coordinated national access to the operational meteorology<br />
distribution channels enjoyed by CAWCR/BoM, and any such opportunities should be investigated.<br />
4.4 Emerging Technology<br />
While consistency and reliability <strong>of</strong> EO data sources are essential in research projects with an operational<br />
emphasis, the nature <strong>of</strong> R&D is such that knowledge and consideration <strong>of</strong> future technologies is important.<br />
Apart from next generation Optical/Hyperspectral or Radar sensors, there are a number <strong>of</strong> new and nearfuture<br />
sensors and technologies that warrant future investigation by the EO R&D community, particularly<br />
with regard to augmenting current observations with additional EOS technologies, as well as ensuring the<br />
continuity <strong>of</strong> more conventional data types in support <strong>of</strong> R&D in<strong>for</strong>mation needs.<br />
4.4.1 New Sensors<br />
Full Wave-Form Lidar<br />
Several researchers expressed an interest in access to full wave-<strong>for</strong>m Lidar data. Multi-wavelength Lidar was<br />
considered to be useful <strong>for</strong> directly sensing the above-ground biomass <strong>for</strong> calibration/validation <strong>of</strong> satellite<br />
products. With only one or two airborne systems currently available in <strong>Australia</strong>, research over the next<br />
decade will evaluate its utility <strong>for</strong> improving estimates <strong>of</strong>, <strong>for</strong> example, biomass and Leaf Area Index.<br />
Frequency Modulated Continuous Wave (FMCW) Radar<br />
Frequency Modulated Continuous Wave radar is potentially interesting <strong>for</strong> Antarctic research. It was flown<br />
on a helicopter in 2007 (with mixed results due to the high-vibration environment) and is being flown on<br />
a fixed wing aircraft as a part <strong>of</strong> NASA’s IceBridge program. IceBridge is intended to bridge IceSat (which<br />
stopped collecting data in late 2009) and IceSat-2 (currently scheduled <strong>for</strong> launch in 2016), and flies a<br />
combination <strong>of</strong> sensors, including an IR laser, a range <strong>of</strong> radar sensors and, eventually, a green laser. These<br />
flights cover Antarctica quite extensively and underfly a number <strong>of</strong> satellite coverages.<br />
The <strong>Australia</strong>n Space <strong>Research</strong> Program (ASRP) has funded ($4.6 million) the Garada consortium led<br />
by UNSW to investigate technologies related to the development <strong>of</strong> a space-based L-band SAR system<br />
proposed primarily <strong>for</strong> disaster monitoring. Among the novel aspects <strong>of</strong> the proposed system is the radar<br />
signal and data collection model, which uses Continuous Wave (CW) radar to enable implementation <strong>of</strong><br />
low-peak-transmit-power signals.<br />
GRACE<br />
The GRACE Follow-on mission will duplicate NASA’s GRACE mission and will also include a laser<br />
meteorology system to complement the K-band inter-satellite measuring system. However, failure <strong>of</strong><br />
GRACE and/or delays in GRACE Follow-on will leave the scientific community without any sensor to<br />
“weigh” the continents, monitor melting <strong>of</strong> ice sheets or provide estimates <strong>of</strong> the hydrological changes at<br />
catchment scale.<br />
70 <strong>Continuity</strong> <strong>of</strong> <strong>Earth</strong> <strong>Observation</strong> <strong>Data</strong> <strong>for</strong> <strong>Australia</strong>: R&D • January 2012
Meteorological and Environmental Sensors<br />
EO DATA REQUIREMENTS: FUTURE<br />
Environmental <strong>for</strong>ecasting and analysis would benefit from access to additional data types, including<br />
Rain Radar (such as the Global Precipitation Measurement mission), Ultraspectral (0.3-14 µm) imagers,<br />
Ultraspectral sea surface temperature instruments, geostationary Microwave Sounders (global precipitation),<br />
GPS radio occultation, and Hyperspectral Sounders.<br />
Imaging Radar Altimeters<br />
When available, Imaging Radar Altimeters will provide higher spatial resolution and contiguous data sampling,<br />
which will be especially valuable <strong>for</strong> coastal regions, but also generate much higher data volumes.<br />
Ocean Colour Instruments<br />
ESA, JAXA and NASA are all planning next generation ocean colour instruments that should satisfy<br />
<strong>Australia</strong>n R&D needs. Korea plans to continue its supply <strong>of</strong> ocean colour data from geostationary orbit –<br />
which could potentially open new and significant capabilities if coverage <strong>of</strong> <strong>Australia</strong> could be negotiated.<br />
Higher Resolution Passive Microwave Radiometry <strong>Data</strong><br />
The technologies and wavelengths involved in Passive Microwave Radiometry naturally result in low spatial<br />
resolution data (with spatial resolution <strong>of</strong> tens <strong>of</strong> kilometres). Higher resolution or synthetically enhanced<br />
Passive Microwave Radiometry would be welcomed by several research communities currently using this<br />
data to generate sea-ice concentration products, monitor soil moisture and estimate ocean salinity.<br />
Multi-Sensor Integration<br />
The integration <strong>of</strong> multiple data sources will become increasingly important <strong>for</strong> many applications as the<br />
logistical issues <strong>of</strong> image registration become more streamlined and adequate processing power becomes<br />
commonly available. As noted above, there are many applications whereby multiple data streams are<br />
ingested into models using data assimilation and model fusion approaches to optimally produce analyses <strong>of</strong><br />
multiple variables.<br />
4.4.2 Plat<strong>for</strong>ms<br />
Airborne and Unmanned Aerial Vehicles<br />
Traditionally, many <strong>of</strong> the higher resolution or newer EOS sensor technologies have been tested by the R&D<br />
community from manned airborne plat<strong>for</strong>ms, which have served as important underpinning data sources,<br />
<strong>of</strong>ten as stepping-stones to development <strong>of</strong> new applications which can be applied to satellite-derived data.<br />
In addition, two <strong>of</strong> the surveyed projects are now trialling a range <strong>of</strong> compact EO sensors on unmanned<br />
aerial vehicles (UAV) <strong>for</strong> a diversity <strong>of</strong> applications. These plat<strong>for</strong>ms <strong>of</strong>fer significant advantages in terms<br />
<strong>of</strong> pre-flight programming, flexibility in the timing, location, orientation and scale <strong>of</strong> recorded data, and<br />
(relatively) low cost simultaneous and integrated data acquisition from multiple instruments. UAVs are also<br />
able to operate where piloted aircraft are not practical, such as over very remote or unsafe locations (e.g.<br />
Antarctic surveys or military conflict areas). Such features <strong>of</strong>fer enormous efficiency in tailoring instrument<br />
development to specific applications and to cross-compare the products from different sensors.<br />
While currently addressing issues related to hardware integration, researchers expect a dramatic increase<br />
in the use <strong>of</strong> UAV plat<strong>for</strong>ms <strong>for</strong> EO in the next few years. They also anticipate the emergence <strong>of</strong> several<br />
turnkey-style solutions, which will encourage more operational use. In relevant applications areas, UAV<br />
technology will potentially benefit from and mimic recent advances in precision GPS-guided devices.<br />
<strong>Continuity</strong> <strong>of</strong> <strong>Earth</strong> <strong>Observation</strong> <strong>Data</strong> <strong>for</strong> <strong>Australia</strong>: R&D • January 2012 71
Geostationary Sensors<br />
An increasing number <strong>of</strong> researchers are looking to geostationary satellites with higher spatial resolution<br />
(such as GOCI/COMS) and small satellite constellations to supply low latency data. The frequency <strong>of</strong><br />
geostationary image updates potentially reduces the impact <strong>of</strong> cloud cover and improves understanding<br />
<strong>of</strong> the diurnal cycle. The emergence <strong>of</strong> plat<strong>for</strong>m constellation configurations will improve effective revisit<br />
frequency <strong>for</strong> time-critical applications such as flood mapping. The most significant advance in this area<br />
will perhaps be the availability <strong>of</strong> the upgraded sensor suite on the Japan Meteorological Agency (JMA)<br />
geostationary weather satellites (from Himawari-8, available operationally from 2015). The improved spectral<br />
and temporal resolution will allow new and improved products to be developed and used by <strong>for</strong>ecasters,<br />
including a number <strong>of</strong> multi-band composites.<br />
4.5 <strong>Data</strong> Quality<br />
As an increasing number <strong>of</strong> applications use optical data (Multispectral and Hyperspectral) <strong>for</strong> quantitative<br />
measurement, the need <strong>for</strong> careful calibration and data corrections (e.g. <strong>for</strong> atmospheric effects, imaging<br />
directionality and topography) is becoming more critical. As a result, two-thirds <strong>of</strong> the surveyed projects<br />
involve ever-improving calibration and/or validation <strong>of</strong> EO data with ground-based in<strong>for</strong>mation.<br />
Currently the calibration and correction <strong>of</strong> EO data is not coordinated in <strong>Australia</strong> <strong>for</strong> all data types.<br />
For different EO data sources, the responsibility <strong>for</strong> data quality is currently assumed by data providers,<br />
researchers, and/or users, with some duplication <strong>of</strong> ef<strong>for</strong>t occurring between various organisations.<br />
The majority <strong>of</strong> survey respondents felt that EOS data quality in <strong>Australia</strong> should be the responsibility <strong>of</strong><br />
an adequately funded national body (whether it be one or more Government agencies, a national facility<br />
such as TERN, or a national technical group) which could rigorously test new sensors and also manage<br />
international contact with data providers.<br />
National infrastructure to support radiometric Cal/Val was also considered to be a fundamental factor<br />
in ensuring data stream quality. International links, such as involvement with global Cal/Val teams, helps to<br />
ensure the quality <strong>of</strong> relevant data products in <strong>Australia</strong>n conditions, especially in those cases when <strong>Australia</strong><br />
is the only contributor to such activities in the Southern Hemisphere. Most respondents from state agencies<br />
felt that this was a role <strong>for</strong> the Federal Government, and that the availability <strong>of</strong> calibrated, validated datasets<br />
would be welcomed.<br />
In order to begin to address this issue, a new National Satellite Calibration Working Group is currently being<br />
established and jointly coordinated by CSIRO and GA, in collaboration with BoM, DSTO, TERN, IMOS and<br />
several university teams, to better coordinate field calibration activities, ground-sensor inter-comparison,<br />
National Institute <strong>of</strong> Standards and Technology certification, and so on.<br />
While data quality can mean different things, with each user having potentially different thresholds <strong>for</strong><br />
‘acceptable’, the design purposes, and their limitations, need to be understood <strong>for</strong> competent usage <strong>of</strong> any<br />
dataset. An organisation <strong>for</strong>mally responsible <strong>for</strong> quantifying these attributes <strong>for</strong> all EO data types in <strong>Australia</strong><br />
would help to ensure appropriate use <strong>of</strong> these data.<br />
4.6 Significant Future Missions<br />
As noted above, awareness <strong>of</strong> future EO satellite program plans varies significantly among the research<br />
community surveyed. Accordingly, this report has focused on assessment <strong>of</strong> the continuity <strong>of</strong> the Priority<br />
<strong>Data</strong> Types <strong>for</strong> the next five years, in order to support short- to medium-term infrastructure planning.<br />
Less focus has been placed on far-future missions, and further consultation and consensus-building will<br />
be required to identify priority missions <strong>for</strong> the R&D community in the long-term. This will require the<br />
community to be better in<strong>for</strong>med as to future planned missions and their capabilities. However, knowing the<br />
current observational priorities <strong>for</strong> <strong>Australia</strong>, it is possible to suggest a set <strong>of</strong> future missions that will have a<br />
high national significance and might <strong>for</strong>m the basis <strong>of</strong> a provisional list <strong>of</strong> future priorities.<br />
72 <strong>Continuity</strong> <strong>of</strong> <strong>Earth</strong> <strong>Observation</strong> <strong>Data</strong> <strong>for</strong> <strong>Australia</strong>: R&D • January 2012
EO DATA REQUIREMENTS: FUTURE<br />
The eight key national challenges <strong>for</strong> <strong>Australia</strong> identified in the <strong>Australia</strong>n Strategic Plan <strong>for</strong> <strong>Earth</strong> <strong>Observation</strong>s<br />
from Space (ATSE, 2009), were:<br />
• Agriculture, <strong>for</strong>estry and ecosystems;<br />
• Climate change;<br />
• Water availability;<br />
• Natural disaster mitigation;<br />
• Safe and secure transport;<br />
• Energy and resources security;<br />
• Coasts and oceans; and<br />
• National security.<br />
Those indicated in bold were identified in Table 2-7 as being the most frequent sectors (or Societal Benefit<br />
Areas) <strong>for</strong> EO-related R&D in <strong>Australia</strong>.<br />
The CEOS database features hundreds <strong>of</strong> future missions with the potential to contribute to these areas –<br />
climate change in particular is extremely broad and could be associated with more than half the missions in<br />
the database in support <strong>of</strong> one or more <strong>of</strong> the over 50 Essential Climate Variables used to define climate<br />
in<strong>for</strong>mation needs. Section 5 focuses on continuity outlooks <strong>for</strong> the Priority <strong>Data</strong> Types <strong>for</strong> the next five<br />
years – with an emphasis on the missions which are well-known and assumed to <strong>for</strong>m the core <strong>of</strong> the<br />
data streams meeting <strong>Australia</strong>n researchers’ observation needs. Below, a number <strong>of</strong> missions have been<br />
identified which may bring novel capabilities and are highly anticipated internationally <strong>for</strong> their potential<br />
to deliver new types <strong>of</strong> in<strong>for</strong>mation and to enable new science, and in due course, new operational<br />
in<strong>for</strong>mation streams. The list is not exhaustive.<br />
Agriculture, Forestry and Ecosystems<br />
DESDynI (Status uncertain, NASA, no launch date): DESDynI is a science mission providing important<br />
observations <strong>for</strong> land surface change and hazards (surface de<strong>for</strong>mation), and climatic variables (terrestrial<br />
biomass and ecosystem structure and ice dynamics). The DESDynI spacecraft features an L-band SAR<br />
system with multiple polarizations. The mission uses polarimetric SAR <strong>for</strong> biomass estimation and spatial<br />
variability <strong>of</strong> ecosystem structure. The science community world-wide keenly anticipates the vegetation<br />
structure and biomass capabilities which DESDynI may provide. Earlier mission concepts included a lidar but<br />
this appears to have been removed.<br />
BIOMASS (Considered, ESA, no launch date): BIOMASS features a full polarimetric P-band SAR with<br />
interferometric capability. It aims to: improve current estimates <strong>of</strong> <strong>for</strong>est carbon stocks; reduce uncertainty<br />
in de<strong>for</strong>estation emissions to a level comparable to uncertainty in net ocean flux; and improve estimates <strong>of</strong><br />
terrestrial carbon sinks from regrowth and re<strong>for</strong>estation.<br />
HJ-1C (Approved, China, Dec 2012 launch): S-band SAR is a new data type, which will be first available<br />
from space from the Chinese HJ-1C mission in late 2012. S-band SAR is understood to support agricultural<br />
applications including classification <strong>of</strong> crop-type, mapping agricultural land, assessing crop condition and<br />
moisture content. It should also be able to provide land use classifications.<br />
Hyperspectral imagery is discussed in Section 5 but it is worth noting the EnMap (Approved, DLR, 2015<br />
launch), PRISMA (Approved, ASI, 2014), ALOS-3/HISUI (Planned, JAXA, 2014) and HyspIRI (Considered,<br />
NASA, 2020+) missions, given their potential to contribute to many different research projects in <strong>Australia</strong>.<br />
Climate Change<br />
Missions <strong>of</strong> special interest in relation to carbon observations and greenhouse gases:<br />
OCO-2 (Planned, NASA, 2013): OCO-2 is designed to provide space-based global measurements <strong>of</strong><br />
atmospheric carbon dioxide (CO 2 ) with the precision and resolution needed to identify and characterize<br />
<strong>Continuity</strong> <strong>of</strong> <strong>Earth</strong> <strong>Observation</strong> <strong>Data</strong> <strong>for</strong> <strong>Australia</strong>: R&D • January 2012 73
the processes that regulate this important greenhouse gas. With its three high-resolution grating<br />
spectrometers, data collected by OCO-2 could be combined with meteorological observations and groundbased<br />
CO 2 measurement to help characterize CO 2 sources and sinks on regional scales at monthly intervals<br />
<strong>for</strong> 2 years.<br />
MERLIN (Planned, DLR/CNES, 2016): Lidar measurements <strong>of</strong> atmospheric methane globally over a three<br />
year period.<br />
Water Availability<br />
GRACE Follow-on Mission (Approved, NASA/DLR, 2016 launch): GRACE Follow-on will continue the<br />
observations pioneered by the GRACE mission, which has been in operation since 2002 and will extend<br />
operations through 2013 if fuel allows. GRACE measures the change in all <strong>of</strong> the water stored on land after<br />
precipitation has been stored as snow, infiltrated into the ground, evaporated, or left the basin as streamflow<br />
- accounting <strong>for</strong> these inflows, outflows and storage changes is called water balance. GRACE is able to track<br />
water storage in large river basins.<br />
GPM (Approved, NASA/JAXA/others, 2013 launch): the Global Precipitation Measurement mission aims to<br />
provide precipitation measurements on a global basis with sufficient quality, <strong>Earth</strong> coverage and sampling to<br />
improve prediction <strong>of</strong> the weather, climate and specific components <strong>of</strong> the global water cycle. GPM aims to<br />
ensure a repeat observation cycle <strong>of</strong> approximately three hours.<br />
SWOT (Considered, NASA/CNES, 2020 launch): The Surface Water Ocean Topography mission will make<br />
the first global survey <strong>of</strong> <strong>Earth</strong>’s surface water, observe the fine details <strong>of</strong> the ocean’s surface topography,<br />
and measure how water bodies change over time. Given our basic need <strong>for</strong> fresh water, hydrologic<br />
observations <strong>of</strong> the temporal and spatial variations in water volumes stored in rivers, lakes, and wetlands are<br />
extremely important. Un<strong>for</strong>tunately, our knowledge <strong>of</strong> the global dynamics <strong>of</strong> terrestrial surface waters and<br />
their interactions with coastal oceans in estuaries is very limited. By measuring water storage changes in all<br />
wetlands, lakes, and reservoirs and making it possible to estimate discharge in rivers more accurately, SWOT<br />
will contribute to a fundamental understanding <strong>of</strong> the terrestrial branch <strong>of</strong> the global water cycle. SWOT<br />
will also map wetlands and non-channelized flow.<br />
Section 5 contains a discussion <strong>of</strong> upcoming soil moisture missions, which have multiple critical research<br />
and operational applications in <strong>Australia</strong> (our geography being ideal <strong>for</strong> such applications). These include<br />
GCOM-W, Aquarius, and SMAP.<br />
Natural Disaster Mitigation<br />
Overall, several sensors on upcoming geostationary and polar orbiting satellites should provide several<br />
options <strong>for</strong> continuity across disaster monitoring and mapping programs that monitor tropical cyclones,<br />
storms, bushfires and floods. In the case <strong>of</strong> bushfires, <strong>for</strong> example, the following missions would be <strong>of</strong><br />
interest.<br />
TET-1 (ready <strong>for</strong> launch – DLR). This new, dedicated thermal infrared sensing mini-satellite is a follow-up<br />
<strong>of</strong> the BIRD satellite, developed by DLR (Germany) in the late 90’s, and which provided unprecedented<br />
bushfire detection qualities, in terms <strong>of</strong> spatial resolution (about 300 m) and radiometric quality, to measure<br />
radiant heat output by fire fronts with good accuracy. TET-1 is designed to be the first <strong>of</strong> a constellation <strong>of</strong><br />
such satellites, which would <strong>of</strong>fer much higher repeat pass capabilities and <strong>of</strong>f-nadir pointing to track the<br />
progression bushfires on a close to near real-time basis. DLR is currently looking <strong>for</strong> other countries to<br />
contribute towards the other satellites in the constellation.<br />
VIIRS (launched – NASA/NOAA). Somewhat <strong>of</strong> a hybrid between AVHRR and MODIS, VIIRS is expected<br />
to provide the same thermal detection capabilities and spatial resolution as MODIS and AVHRR, with similar<br />
dynamic range and sensitivity as MODIS. There<strong>for</strong>e the continuity <strong>of</strong> programs such as Sentinel Hotspots<br />
(operated by Geoscience <strong>Australia</strong>), Firewatch (Landgate WA), and NAFIS (NT) are expected to have only<br />
minimal disruption upon stoppage <strong>of</strong> MODIS.<br />
74 <strong>Continuity</strong> <strong>of</strong> <strong>Earth</strong> <strong>Observation</strong> <strong>Data</strong> <strong>for</strong> <strong>Australia</strong>: R&D • January 2012
EO DATA REQUIREMENTS: FUTURE<br />
SLSTR (Sentinel-3 series <strong>of</strong> GMES, ESA). A follow-on <strong>of</strong> the ATSR and Advanced ATSR sensors with 1 km<br />
resolution in the TIR, this sensor should provide sufficient data in addition to VIIRS, as well as guaranteed<br />
follow-on spacecraft, provided that data or derived fire-detection products from these spacecraft can be<br />
transferred to <strong>Australia</strong>’s operational fire detection and tracking systems with sufficiently low latency.<br />
It should be stressed that the above sample <strong>of</strong> missions are suggested as possible national priorities – and<br />
have not been indicated as such by the study survey process. Of this small set, it is interesting to note that,<br />
although NASA may not feature prominently as a future supplier <strong>of</strong> data <strong>for</strong> Priority <strong>Data</strong> Types <strong>of</strong> interest<br />
to <strong>Australia</strong>n R&D (Section 5), they continue to pioneer a range <strong>of</strong> important scientific EO satellite missions<br />
which will be <strong>of</strong> interest and value to <strong>Australia</strong>n researchers.<br />
Similar analyses, not undertaken here, <strong>for</strong> missions <strong>of</strong> potential interest can also be undertaken <strong>for</strong> other<br />
applications including flood mapping, cyclone trajectory, rainfall and wind-speed tracking, and storm or<br />
tsunami/high-tide monitoring purposes.<br />
4.7 Summary<br />
The survey indicated that, across the community, <strong>Australia</strong>n researchers expected little change in<br />
their Priority <strong>Data</strong> Types over the next five years. <strong>Research</strong>ers have indicated an increasing need <strong>for</strong><br />
Hyperspectral and Lidar data types, yet many <strong>of</strong> these researchers do not expect their future requirements<br />
to be fully met by 2014-2016. Since it is likely that there will be few or no satellite missions acquiring these<br />
data types on terms suitable to <strong>Australia</strong>n researchers be<strong>for</strong>e 2014-2016 (see Sections 5.9 and 5.10),<br />
it is assumed that researchers expect these requirements to continue to be met primarily by airborne<br />
data sources.<br />
There is also a growing need <strong>for</strong> High Resolution Optical data. The increased requirements <strong>for</strong> High<br />
Resolution Optical and Hyperspectral imagery appear to correspond with a decrease in the need <strong>for</strong> Low<br />
and Medium Resolution Optical data. The latter two data types are still expected to be the highest priorities<br />
in 2013 and 2016.<br />
SAR data remains a high priority, with an expected increase in L-band data usage. This requirement is unlikely<br />
to be met by EOS data, however, given the lack <strong>of</strong> imminent space-borne sensors <strong>for</strong> this data type.<br />
Future data volumes and the variety <strong>of</strong> data sources are anticipated to rise several-fold in coming years,<br />
although the data volumes associated with most R&D projects are not as large as those identified <strong>for</strong><br />
operational programs (and detailed in the CEODA-Ops Report).<br />
A number <strong>of</strong> infrastructure issues have been identified that merit further analysis:<br />
• The establishment <strong>of</strong> an increasing number <strong>of</strong> national archives <strong>for</strong> key datasets (which are<br />
downloaded once from the international supplier, and stored and distributed locally) would save<br />
significantly on the overhead and cost <strong>of</strong> international Internet traffic related to future EO data<br />
supply.<br />
• The majority <strong>of</strong> researchers support the establishment <strong>of</strong> a mandated national coordination<br />
group or body to take responsibility <strong>for</strong> EO data quality <strong>of</strong> existing and new sensors, including<br />
coordination <strong>of</strong> national Cal/Val activities and delivery <strong>of</strong> calibrated and validated datasets.<br />
• Given the possible reduction in direct-broadcast capable satellites and the loss <strong>of</strong> low latency data<br />
<strong>for</strong> many critical applications, negotiations with NASA, ESA/EC, JAXA and other key space agencies<br />
are required to define access conditions that would ensure data supply <strong>for</strong> <strong>Australia</strong>’s future<br />
research needs.<br />
• Maintaining technical capability and capacity to meet increasing societal demand <strong>for</strong> outputs from<br />
EO is also likely to be an issue, as discussed further in Section 6.2.5.<br />
<strong>Continuity</strong> <strong>of</strong> <strong>Earth</strong> <strong>Observation</strong> <strong>Data</strong> <strong>for</strong> <strong>Australia</strong>: R&D • January 2012 75
The <strong>Australia</strong>n EO R&D sector has discovered efficient ways to access key EO datasets, <strong>of</strong>ten via strategic<br />
relationships established by individuals with overseas science collaborators or space agencies. To increase<br />
access to, and adoption <strong>of</strong>, more advanced, new generation EO data streams, however, it would be<br />
advisable that stronger inter-institutional data agreements with key data providers be established at the<br />
Federal Government level, as well guaranteed access to bandwidth, and time-allocation <strong>for</strong> use <strong>of</strong> current<br />
satellite downlink infrastructure <strong>for</strong> these science missions. The need <strong>for</strong> a national negotiating position<br />
may be exacerbated in future if the main EO data supply agencies continue their trend towards centralised<br />
Internet-based data distribution systems that may not meet <strong>Australia</strong>n latency requirements.<br />
76 <strong>Continuity</strong> <strong>of</strong> <strong>Earth</strong> <strong>Observation</strong> <strong>Data</strong> <strong>for</strong> <strong>Australia</strong>: R&D • January 2012
5 EO DATA AVAILABILITY<br />
EO DATA AVAILABILITY<br />
Future data supply scenarios <strong>for</strong> each <strong>of</strong> the Priority <strong>Data</strong> Types are explored in this section. Characteristics<br />
<strong>of</strong> the global supply <strong>of</strong> EO satellite data required in support <strong>of</strong> <strong>Australia</strong>n research activities, and issues and<br />
trends that may impact that supply, are discussed in Section 5.1. Section 5.2 summarises the supply outlook<br />
<strong>for</strong> each <strong>of</strong> the Priority <strong>Data</strong> Types.<br />
The risk <strong>of</strong> EO data gaps are high <strong>for</strong> several Priority <strong>Data</strong> Types, namely Medium Resolution Optical,<br />
L-band SAR, Hyperspectral and Lidar. From this group, the recent malfunction <strong>of</strong> Landsat-5 and the current<br />
gap in L-band SAR data both warrant close attention. In addition, the widespread reliance on the ageing<br />
MODIS sensor, and uncertainty on the utility <strong>of</strong> VIIRS <strong>for</strong> certain applications, merits further consideration.<br />
Section 5.2 also outlines the implications <strong>of</strong> Landsat, MODIS and L-band SAR data continuity risks on<br />
current EO-related R&D in <strong>Australia</strong>, in terms <strong>of</strong> the:<br />
• National significance <strong>of</strong> the EO data type;<br />
• Likelihood <strong>of</strong> the EO data gap;<br />
• Availability, suitability and cost <strong>of</strong> alternative data sources; and<br />
• Impact <strong>of</strong> using alternative data sources—or having no data—on research and operational<br />
outcomes.<br />
Appendix D presents in<strong>for</strong>mation tables <strong>for</strong> those instruments cited in the supply outlooks. Appendix E<br />
contains some additional detail and timelines <strong>for</strong> the supply outlook <strong>for</strong> each <strong>of</strong> the Priority <strong>Data</strong> Types.<br />
Airborne data sources are not considered in this section due to the ad hoc nature <strong>of</strong> image acquisition.<br />
5.1 Global supply context<br />
5.1.1 Overview<br />
As stated in the <strong>Australia</strong>n Strategic Plan <strong>for</strong> <strong>Earth</strong> <strong>Observation</strong>s from Space (ATSE, 2009), “EOS data<br />
are the single most important and richest source <strong>of</strong> environmental in<strong>for</strong>mation in <strong>Australia</strong>”. World-wide,<br />
EO is also the primary satellite-based application, with governments spending around USD $7 billion per<br />
year—about 20% <strong>of</strong> government non-classified investment in space (based on estimates in The Space<br />
Report (The Space Foundation, 2011) and by Euroconsult, 2008). While estimates <strong>of</strong> the total number<br />
<strong>of</strong> operational and planned EO satellites vary, the following sources agree that this is, and will remain, an<br />
extremely active sector:<br />
1. The 2011 survey <strong>of</strong> CEOS space agencies was completed in October 2011, and the CEOS<br />
database updated accordingly (CEOS, 2011). The database now features details <strong>of</strong> 256 civil <strong>Earth</strong><br />
observing satellite missions involving 769 instruments (399 distinct instruments and 370 duplicates),<br />
currently operating or planned <strong>for</strong> launch in the next 15 years. These missions are funded and<br />
operated by around 30 space agencies world-wide. About 85 <strong>of</strong> the planned missions have<br />
meteorology as a primary objective. The other 171 missions will be applied to a diverse range <strong>of</strong><br />
research, operational and commercial activities.<br />
2. Northern Sky <strong>Research</strong> (2009) <strong>for</strong>ecasts that the number <strong>of</strong> operational <strong>Earth</strong> observation<br />
satellites will increase from 180 satellites in 2009 to approximately 240 satellites by 2019. It is<br />
expected that 77% <strong>of</strong> these satellites will be used <strong>for</strong> civil government or military services, with<br />
North America, Europe, and Asia leading the growth.<br />
Lower cost satellites and the ability to address local issues have made EO the top priority space application<br />
<strong>for</strong> a number <strong>of</strong> countries, particularly emerging space programs in Asia. Growth in EO budgets is also<br />
being driven by society’s increasing need <strong>for</strong> in<strong>for</strong>mation on our planet, this being the essential foundation<br />
<strong>Continuity</strong> <strong>of</strong> <strong>Earth</strong> <strong>Observation</strong> <strong>Data</strong> <strong>for</strong> <strong>Australia</strong>: R&D • January 2012 77
<strong>for</strong> sustainable development policies aimed at ensuring our continued health and prosperity in the face <strong>of</strong><br />
population growth, environmental degradation and a changing climate.<br />
The CEOS database suggests that space agencies have already approved and will launch 18 new missions<br />
during 2012. By 2016 agencies in a total <strong>of</strong> 29 countries will have launched an EO satellite, compared to just<br />
17 in 2006. These numbers include both long-established EO programs, such as those managed by ESA and<br />
NASA, and emergent EO programs in Nigeria, Turkey, Thailand and Vietnam.<br />
The CEODA-R&D study process has highlighted the predominance <strong>of</strong> the <strong>Australia</strong>n R&D community using<br />
‘whatever free data are available’, provided it <strong>of</strong>fers suitable data quality, continuity, coverage and access<br />
arrangements. In practice, these conditions significantly reduce the supply options <strong>for</strong> <strong>Australia</strong>n R&D to<br />
those provided by very few agencies and sometimes only a handful <strong>of</strong> suitable missions.<br />
5.1.2 Government versus Commercial<br />
Only a few, typically very high resolution, EO satellites are funded and operated as truly commercial<br />
ventures. These include the US high-resolution optical data licenses held by DigitalGlobe and GeoEye.<br />
Both <strong>of</strong> these companies have benefitted significantly from the commercial markets driven by the Virtual<br />
Globes (like Google <strong>Earth</strong> and Micros<strong>of</strong>t). These Virtual Globes have already had a very large impact on the<br />
geographical in<strong>for</strong>mation/EO industry, and most companies involved in the sector are currently reassessing<br />
their strategy to adapt their product portfolios to the new market environment. The success <strong>of</strong> the first<br />
generation <strong>of</strong> high-resolution commercial satellites has paved the way <strong>for</strong> a second generation, <strong>for</strong> example<br />
WorldView-1 and WorldView-2 from DigitalGlobe and GeoEye-1. These satellites are partly funded<br />
through the US Government NextView and Enhanced View contracts to meet in<strong>for</strong>mation needs <strong>for</strong> national<br />
security purposes.<br />
Europe’s first commercially operated systems (other than the SPOT series) could be considered to be the<br />
public-private partnership (PPP)-funded terraSAR-X/tandem-X (Germany) and the RapidEye constellation<br />
(also Germany, now Canadian-owned). The launch <strong>of</strong> Radarsat-2 (Canada, 2008) and Deimos (Spain, 2009)<br />
added to the number <strong>of</strong> commercially underwritten missions <strong>for</strong> EO. Success <strong>of</strong> PPP-financed missions could<br />
pave the way <strong>for</strong> future programs. In addition to the commercial systems, a number <strong>of</strong> government satellite<br />
programs are looking to pr<strong>of</strong>it directly from their commercially viable data. Similar to the commercial<br />
operators’ focus on high-resolution data, governments operating similar resolution systems are likely to<br />
look to commercialisation. These include satellites from India and South Korea, as well as dual-use (civil and<br />
military) programs such as Pleiades (France) and COSMO-SkyMed (Italy).<br />
A trend towards higher resolution data is expected in future commercial systems, such as GeoEye-2 in 2013<br />
with 25 cm pixel resolution. US Government licensing regulations may, however, limit access to imagery at<br />
the full spatial resolution.<br />
<strong>Australia</strong>n R&D programs rely primarily on airborne data suppliers <strong>for</strong> high resolution imagery; relatively<br />
little commercial satellite data is supplied and used, due to the significant costs involved and uncertainty<br />
<strong>of</strong> data acquisition relative to coincident field measurement and calibration activities. <strong>Australia</strong> is almost<br />
entirely dependent on the continued supply <strong>of</strong> free data from governmental missions (both scientific and<br />
operational) that are provided as a global ‘public good’ resource and that have a supporting open data policy.<br />
There are both significant opportunities and significant risks associated with sustaining a position whereby<br />
<strong>Australia</strong> continues to exploit at virtually no cost the investments <strong>of</strong> other countries in EO data supply.<br />
5.1.3 <strong>Research</strong> versus Operational<br />
The international governmental EO sector on which <strong>Australia</strong> is reliant is typically organised along two lines:<br />
• ‘operational’—effectively covering meteorology missions but with an expanding sphere <strong>of</strong> influence<br />
into climate, water, security, and disaster monitoring; and<br />
• ‘research’—effectively covering everything other than meteorology.<br />
78 <strong>Continuity</strong> <strong>of</strong> <strong>Earth</strong> <strong>Observation</strong> <strong>Data</strong> <strong>for</strong> <strong>Australia</strong>: R&D • January 2012
EO DATA AVAILABILITY<br />
National agencies which operate satellites typically belong to one category or the other. In the USA, NOAA<br />
and USGS are the operational agencies handling meteorological and land-mapping satellites respectively, and<br />
NASA is the research agency handling non-meteorological satellites. In Europe, EUMETSAT is responsible<br />
<strong>for</strong> meteorological satellites and ESA, supplemented by scientific satellite missions from several individual<br />
countries (e.g. Germany, italy, france), <strong>for</strong> the non-meteorological satellites. in Japan, these roles are fulfilled<br />
by JMA and JAXA respectively. it should be noted, however, that in all cases the technical build <strong>of</strong> the<br />
spacecraft is <strong>of</strong>ten the responsibility (at least in part) <strong>of</strong> the research space agency, and NASA, ESA and<br />
JAXA are good examples <strong>of</strong> this in practice.<br />
The operational space agencies are heavily focused on the application <strong>of</strong> satellite data to weather<br />
<strong>for</strong>ecasting. They are well-organised internationally, <strong>for</strong> that purpose, under the auspices <strong>of</strong> the World<br />
Meteorological Organization (WMO), and specifically via the Coordination Group <strong>for</strong> Meteorological<br />
Satellites (CGMS). CGMS provides a <strong>for</strong>um <strong>for</strong> the exchange <strong>of</strong> technical in<strong>for</strong>mation on geostationary and<br />
polar-orbiting meteorological satellite systems and research & development missions. The key systems <strong>of</strong><br />
interest to <strong>Australia</strong>, in this context, are the geostationary satellites provided by Japan (as well as China and<br />
South Korea) and the polar orbiting satellites provided by the USA and Europe.<br />
CGMS membership is open to all operators <strong>of</strong> meteorological satellites, to prospective operators having a<br />
clear commitment to develop and operate such satellites, and to the WMO in recognition <strong>of</strong> its unique role<br />
as representative <strong>of</strong> the world meteorological data user community. Further, CGMS membership is open<br />
to space agencies operating R&D satellite systems that have the potential to contribute to the WMO and<br />
supported programs (e.g. ESA, NASA and JAXA attend meetings). Some 13 national agencies, as well as the<br />
WMO and GEOSS’ Initial Operating Capability (IOC), participate in CGMS <strong>for</strong> this purpose. These agencies<br />
collectively have responsibility <strong>for</strong> around one third <strong>of</strong> the international government-funded EO missions<br />
currently in operation or planning. The remaining two thirds (180 satellites over the next 15 years in CEOS<br />
agencies alone) are the responsibility <strong>of</strong> the research space agencies, with an increasing number <strong>of</strong> missions<br />
being provided by emerging space nations.<br />
It should also be noted that an increasing amount <strong>of</strong> data from the research space agencies (notably NASA,<br />
ESA, and JAXA) is supplied and shared world-wide through the WMO distribution channels, these data<br />
being <strong>of</strong> both operational and research interest to national weather and climate agencies in their numerical<br />
weather prediction activities. For this reason, most large meteorological agencies are strong participants in<br />
CEOS. <strong>Australia</strong>n researchers obtain a significant amount <strong>of</strong> their data through WMO channels, and <strong>for</strong> a<br />
wide range <strong>of</strong> purposes far beyond weather and climate applications, <strong>for</strong> applications such as the prediction<br />
and possible detection <strong>of</strong> coral bleaching.<br />
Accordingly, the nature <strong>of</strong> the arrangements between the research space agencies and the operational space<br />
agencies, and in particular the link between individual missions and the WMO In<strong>for</strong>mation System (including<br />
the GTS), is <strong>of</strong> great interest to <strong>Australia</strong>n researchers, as these connections have a significant bearing on<br />
the availability <strong>of</strong> relevant data sources. Through BoM, <strong>Australia</strong> has a long history <strong>of</strong> effective engagement in<br />
support <strong>of</strong> satellite data supply from the operational space agencies through the WMO system.<br />
There is a more ad hoc nature to <strong>Australia</strong>n relations with the research space agencies—NASA, ESA, JAXA<br />
and others—and this represents a significant risk to continued supply, as well as involving considerable<br />
inefficiencies through repeat and duplicated access to the same datasets by different research groups.<br />
5.1.4 Global Trends and <strong>Data</strong> Policies<br />
<strong>Data</strong> access policies are <strong>of</strong> critical importance to <strong>Australia</strong>n researchers, who tend to work with whatever<br />
data is available <strong>for</strong> free. This effectively allows trends in international data access policy to determine<br />
<strong>Australia</strong>’s capability to undertake EO-related research. A number <strong>of</strong> surveyed researchers consider that<br />
a high level <strong>of</strong> risk is associated with the expectation <strong>of</strong> ongoing goodwill from several EO data suppliers,<br />
given that many <strong>of</strong> the supply countries (e.g. Japan and the European states) are now experiencing more<br />
difficult financial circumstances than <strong>Australia</strong>. This issue could jeopardise <strong>Australia</strong>n access to the Sentinel<br />
series <strong>of</strong> satellites (Europe) and to future Japanese land imaging satellites (e.g. ALOS-2). The recent change<br />
<strong>Continuity</strong> <strong>of</strong> <strong>Earth</strong> <strong>Observation</strong> <strong>Data</strong> <strong>for</strong> <strong>Australia</strong>: R&D • January 2012 79
in Japan’s data supply policy, which ended the free supply <strong>of</strong> national land-mapping data to non-contributing<br />
operational agencies in 2010, has already resulted in the loss <strong>of</strong> <strong>Australia</strong>n access to ALOS data via<br />
Geoscience <strong>Australia</strong> (although a limited number <strong>of</strong> scenes may be granted to research organisations free <strong>of</strong><br />
cost, on request).<br />
the current situation and trends within <strong>Australia</strong>’s three main supply regions—USA, Europe and Japan—are<br />
further detailed in the following paragraphs.<br />
USA (NASA, NOAA, USGS)<br />
The remote sensing budgets <strong>of</strong> the main US suppliers <strong>of</strong> satellite data <strong>for</strong> <strong>Australia</strong>n research have been<br />
subject to major fluctuations in recent years.<br />
NASA’s EO satellites are launched under the <strong>Earth</strong> Systematic Missions (ESM) program, aimed at providing<br />
long-term environmental data, and the <strong>Earth</strong> System Science Pathfinder (ESSP) program, addressing specific<br />
requirements in earth science research. NASA has historically been the largest EO investor world-wide.<br />
However, budget reductions in the early 2000’s had a significant impact on data continuity <strong>of</strong> key EO<br />
missions, leading the US National <strong>Research</strong> Council <strong>of</strong> the National Academies (2007) to release a decadal<br />
survey articulating the US scientific community’s EOS priorities <strong>for</strong> the next ten years and beyond, to assist<br />
in continuity planning.<br />
NOAA’s next generation polar orbiting system, National Polar-orbiting Operational Environmental<br />
Satellite System (NPOESS), was originally conceived as a joint mission between NASA, NOAA and the<br />
US Department <strong>of</strong> Defense. Due to significant cost and time overruns, however, this program has been<br />
restructured to become the NOAA-operated JPSS (Joint Polar Satellite System), with science input from<br />
NASA. JPSS is expected to be operational from 2015 to 2026, though funding limitations may preclude the<br />
deployment <strong>of</strong> the full mission.<br />
USGS currently anticipates the launch <strong>of</strong> Landsat-8 (LDCM) in early 2013. Free and open data access will be<br />
<strong>of</strong>fered via the USGS LPDAAC, providing much-needed continuity to the Landsat series satellites.<br />
This recent trend in the USA towards a free and open data policy, using Internet-based distribution<br />
systems, is expected to continue into the future, and is becoming a model <strong>for</strong> other countries’ EOS<br />
programs. The opening in recent years <strong>of</strong> the on-line Landsat archive has seen an explosion in its use<br />
world-wide, including in <strong>Australia</strong>. In addition, the early decision by NASA and NOAA to provide MODIS<br />
and AVHRR data freely, both via an ftp service or via direct-broadcast, has further enabled many more<br />
R&D programs and associated operational programs to use this data. Furthermore, NASA’s decision to<br />
fund a comprehensive ground segment (nearly as costly as the space segment), with well-designed data<br />
management and distribution systems, as well as a suite <strong>of</strong> over 40 derived, standardised level-3 and -4<br />
products from the MODIS data streams, has opened the door to many non-expert users <strong>of</strong> EOS data<br />
across a wide range <strong>of</strong> climate and environmental monitoring domains.<br />
Europe (ESA/EC, EUMETSAT and National Agencies <strong>of</strong> Germany, France, Italy, etc)<br />
Together with several new ESA Science Explorer missions, the ESA/EC Global Monitoring <strong>for</strong> Environment<br />
and Security (GMES) program will be supported by five Sentinel satellite missions, and will provide a<br />
significant new source <strong>of</strong> EOS data <strong>for</strong> civil applications. The five missions, each based on a two-satellite<br />
constellation, are:<br />
• Sentinel 1: providing continuity <strong>of</strong> C-band SAR data <strong>for</strong> operational applications, notably marine<br />
services, land monitoring and emergency services;<br />
• Sentinel 2: supporting land and coastal monitoring-related services (10m optical imagery in four<br />
bands); this may be operational be<strong>for</strong>e LDCM;<br />
• Sentinel 3: supporting global land and ocean monitoring services (Ocean Colour sensor, radiometer,<br />
and altimeter);<br />
80 <strong>Continuity</strong> <strong>of</strong> <strong>Earth</strong> <strong>Observation</strong> <strong>Data</strong> <strong>for</strong> <strong>Australia</strong>: R&D • January 2012
EO DATA AVAILABILITY<br />
• Sentinel 4: geostationary atmospheric composition and trans-boundary pollution monitoring;<br />
• Sentinel 5: low <strong>Earth</strong> orbit atmospheric composition monitoring. The Sentinel 4 and 5 missions will<br />
be carried on meteorological satellites operated by EUMETSAT.<br />
It is intended that the Sentinel series—covering land surface, ocean, atmosphere, and operational<br />
meteorology—will operate with guaranteed continuity <strong>for</strong> 20 years, and with a free and open data policy <strong>for</strong><br />
all users.<br />
However, as <strong>of</strong> late 2011, the EC had not yet agreed to provide funding <strong>for</strong> GMES operations. While ESA<br />
management continues to lobby the EC and individual countries <strong>for</strong> a free and open data access policy<br />
as well as the required funding <strong>for</strong> GMES, the severe financial situation currently prevalent in many EC<br />
countries leaves the ultimate outcome uncertain at the present time.<br />
If, however, the data access policy and data delivery arrangements outside the EU membership, as well as<br />
European funding issues, are resolved favourably, the Sentinel series missions (particularly those that are<br />
polar orbiting and not stationary over Europe) may well become a high priority <strong>for</strong> <strong>Australia</strong>n researchers<br />
in the future. <strong>Australia</strong> does not currently have any existing agreements with ESA/EC regarding the direct<br />
reception and exploitation <strong>of</strong> data from ESA’s EO missions.<br />
Apart from Europe’s central space agency ESA, other European national EO programs may also become<br />
significant direct partners <strong>for</strong> <strong>Australia</strong>n researchers. For example, Germany’s aerospace agency, DLR, has<br />
launched the X-band radar system terraSAR-X/tanDEM-X, will soon launch the first satellite (tEt-1) <strong>of</strong><br />
the bushfire monitoring mission FireBIRD, and is building the EnMAP Hyperspectral satellite mission. All <strong>of</strong><br />
these are <strong>of</strong> considerable interest to agencies like CSIRO, where dedicated cooperative agreements (MoUs)<br />
are being established with DLR. Similarly, the French space agency CNES and the Italian space agency<br />
ASI are operating their own internal budgets <strong>for</strong> missions such as COSMO-SkyMed (Italy) and separate<br />
hyperspacetral programs. <strong>Data</strong> from these latter missions, however, may be provided to users other than the<br />
funding government on a commercial basis only. This is yet to be clarified.<br />
Japan (JAXA & JMA)<br />
the Japanese EO program has experienced several on-orbit system failures on key missions <strong>of</strong> interest<br />
to <strong>Australia</strong>, resulting in poor continuity <strong>of</strong> data supply. The most recent mission, ALOS, which terminated<br />
unexpectedly earlier in 2011, was well regarded internationally <strong>for</strong> its utility. Geoscience <strong>Australia</strong> was<br />
originally permitted to receive and archive ALOS data as a regional data node, but a change <strong>of</strong> government<br />
in Japan in 2009 resulted in adoption <strong>of</strong> a more commercial access policy <strong>for</strong> these data when they are to<br />
be used <strong>for</strong> other than relatively small R&D projects. The direction <strong>for</strong> data access policies <strong>for</strong> ALOS-2 and<br />
beyond is presently uncertain.<br />
in contrast, it is assumed that data associated with the JAXA EO satellite programs that are focused on<br />
climate observations (e.g. GCOM-W and GCOM-C series) will continue to be available free <strong>of</strong> charge. JMA<br />
(Japan Meteorological Agency) and JAXA coordinate ef<strong>for</strong>ts <strong>for</strong> the planning, development and launch <strong>of</strong><br />
satellites <strong>for</strong> operational meteorology. the JMA Meteorological Satellite Centre has operated the series <strong>of</strong><br />
geostationary plat<strong>for</strong>ms (1977-ongoing), located over 140°E, that provide the region with timely access to<br />
meteorological imagery. The current series <strong>of</strong> geostationary plat<strong>for</strong>ms is scheduled to operate through 2017.<br />
Official interaction between JMA and <strong>Australia</strong> is conducted through a Bilateral Agreement between JMA<br />
and BoM. BoM relies on the availability <strong>of</strong> JMA’s imagery <strong>for</strong> operational weather <strong>for</strong>ecasting and disaster<br />
mitigation. the continued requirement <strong>for</strong> data from JMA geostationary plat<strong>for</strong>ms will ensure that JMA<br />
remains a key provider <strong>of</strong> data <strong>for</strong> <strong>Australia</strong>.<br />
Others<br />
China and India are two emerging and significant suppliers, but neither has a history <strong>of</strong> EO satellite data<br />
sharing internationally <strong>for</strong> public good purposes, other than <strong>for</strong> meteorology. India has made recent changes<br />
in this regard through changes to data access policy, and participation in international bodies like CEOS.<br />
<strong>Continuity</strong> <strong>of</strong> <strong>Earth</strong> <strong>Observation</strong> <strong>Data</strong> <strong>for</strong> <strong>Australia</strong>: R&D • January 2012 81
Similar unknowns currently surround the increasing number <strong>of</strong> potentially interesting missions that comprise<br />
the Chinese EO program, where currently only a few direct collaborations exist between <strong>Australia</strong>n R&D<br />
groups and equivalents in China.<br />
Korea also now operates both geostationary and low-<strong>Earth</strong> orbiting observing satellites, and has<br />
indicated considerable interest in expanding bilateral agreements with <strong>Australia</strong> on, <strong>for</strong> example, joint<br />
Cal/Val opportunities.<br />
5.2 Priority <strong>Data</strong> Type Scenarios<br />
The supply scenarios in this report are derived primarily from the CEOS Missions Instruments<br />
Measurements (MIM) database (CEOS, 2011), recently updated by ESA. This is the only <strong>of</strong>ficial and<br />
consolidated statement <strong>of</strong> civil space agency EO programs in the world, and represents a reliable and<br />
current source <strong>of</strong> in<strong>for</strong>mation on the programs and plans <strong>of</strong> the many suppliers <strong>of</strong> data to <strong>Australia</strong>n<br />
researchers.<br />
Due to the programmatic and political reasons cited above, mission plans are always subject to change.<br />
Nonetheless, the most current in<strong>for</strong>mation available is used to make the following projections.<br />
The scenarios postulated below cover the following issues <strong>for</strong> each <strong>of</strong> the Priority <strong>Data</strong> Types:<br />
• Current data sources and their life expectancy;<br />
• Statistics from the CEOS database regarding individual data types and their outlook, together with<br />
risks and opportunities that have been identified; and<br />
• An overall assessment <strong>of</strong> whether <strong>Australia</strong>n R&D requirements will continue to be met, and how.<br />
Appendix D presents in<strong>for</strong>mation tables <strong>for</strong> those instruments cited in the supply outlook <strong>for</strong> each <strong>of</strong> the<br />
Priority <strong>Data</strong> Types identified. Some additional in<strong>for</strong>mation on data supply scenarios and timelines is also<br />
provided in Appendix E.<br />
5.2.1 Low Resolution Optical (>80m)<br />
This data type is essential to around 50% <strong>of</strong> the entire R&D activity surveyed and, as such, must be<br />
considered the highest priority. It requires sustained coverage, and consistency in spectral, geometric, and<br />
calibration quality, given the large areas being covered.<br />
Table 5-1 indicates the key sensors in terms <strong>of</strong> current data usage – with MODIS (on NASA’s Aqua and<br />
terra missions) being the most widely used. AvHRR (NOAA and Metop series), iMAGER (on the Japanese<br />
geostationary meteorological series) and MERIS (on ESA’s Envisat) are also important current sources.<br />
NASA, NOAA, ESA, EUMEtSAt and JAXA all have plans <strong>for</strong> future systems that should largely satisfy<br />
<strong>Australia</strong>n R&D project requirements.<br />
82 <strong>Continuity</strong> <strong>of</strong> <strong>Earth</strong> <strong>Observation</strong> <strong>Data</strong> <strong>for</strong> <strong>Australia</strong>: R&D • January 2012
Table 5-1 <strong>Data</strong> <strong>Continuity</strong> Options: Low Resolution Optical<br />
EO DATA AVAILABILITY<br />
Current Sensor Expected End <strong>of</strong> Life Possible Substitute Expected Availability Comments<br />
MODIS<br />
(Aqua, Terra)<br />
AVHRR<br />
(NOAA & Metop<br />
series)<br />
IMAGER<br />
(MTSAT series)<br />
MERIS<br />
(Envisat)<br />
Recently revised to end<br />
2013<br />
5 years life expected on<br />
NOAA orbiters. 10 years<br />
life expected on Metop<br />
series<br />
2017<br />
viiRS (NPP/JPSS)<br />
OLCI (Sentinel-3)<br />
SGLI (CGOM-C)<br />
viiRS (NPP/JPSS)<br />
MTSAT series presumed<br />
to be continued<br />
operationally<br />
Around late 2013 OLCI (Sentinel-3)<br />
viiRS (NPP/JPSS)<br />
Early 2012 – 2029<br />
(Oct 2011 launch)<br />
Jul 2013 – 2027<br />
(Apr 2013 launch)<br />
Jun 2014 – 2027<br />
(Feb 2014 launch)<br />
Early 2012 – 2029<br />
(Oct 2011 launch)<br />
TBD<br />
Jul 2013 – 2027<br />
(Apr 2013 launch)<br />
Early 2012 – 2029<br />
(Oct 2011 launch)<br />
Ocean colour sensors See Section 5.2.9<br />
Reduced spatial and<br />
spectral resolution.<br />
Reduced spatial<br />
resolution.<br />
Alternates might be<br />
Chinese or Korean<br />
GEO satellites<br />
MODIS is well past its design life but data continuity should be assured from the USA by the VIIRS sensor<br />
on the recently launched NPP satellite (NASA/NOAA), and follow-on viiRS instruments on the JPSS<br />
(NOAA) series in due course, with the launch <strong>of</strong> JPSS-1 scheduled <strong>for</strong> 2017 (earliest). there is, however,<br />
some concern amongst some in the R&D community (as noted by the US National <strong>Research</strong> Council,<br />
20011) that VIIRS characteristics, and ensuing global Level-3 and -4 products, will not satisfy many <strong>of</strong> their<br />
needs. VIIRS has a Ground Sampling Distance (GSD) <strong>of</strong> 400m – 1.6 km (compared to 250/500/1000 m<br />
GSD <strong>for</strong> MODIS) and 22 bands from 400 nm to 1250 nm, as opposed to the 36 bands <strong>of</strong> MODIS from<br />
400 nm to 1440 nm. Several researchers have indicated that the loss <strong>of</strong> spatial resolution and key MODIS<br />
bands will make VIIRS less capable or less suitable <strong>for</strong> their R&D. This is yet to be verified upon more<br />
thorough scientific analysis.<br />
AVHRR is currently operating on several active NOAA satellites (NOAA-15 through NOAA-19), as well<br />
as on EUMETSAT’s Metop-A. Both the NOAA and Metop satellites are operating nominally and many<br />
more years <strong>of</strong> continued operation are anticipated, with the VIIRS data streams potentially also adding<br />
further value.<br />
MERIS (on ESA’s Envisat) is operating beyond its design life, and operations are scheduled to terminate as<br />
the Sentinel satellites come on-line from 2013.<br />
In addition to VIIRS, key future Low Resolution Optical data continuity options are: the OLCI instrument on<br />
the Sentinel-3 series (from early 2013 with operational continuity <strong>for</strong> around 20 years, via three consecutive<br />
spacecraft); and the SGLI instrument on JAXA’s GCOM-C mission series. furthermore, in 2014, JMA will<br />
launch the next generation <strong>of</strong> geostationary meteorological satellites, named Himawari-8 and -9, which<br />
are expected to be operational by October 2015. Himawari-8 will have improved spectral and temporal<br />
resolution and will allow new and improved products to be developed and used by <strong>for</strong>ecasters, including<br />
a number <strong>of</strong> multi-band composites (airmass, dust, cloud microphysics and severe storm). Imagery from<br />
the Himawari-8 and -9 missions will not be available through direct broadcast as with the current MTSAT<br />
missions, but will be distributed over the Internet.<br />
NOAA is the main provider agency <strong>for</strong> the JPSS series that hosts the MODiS and AvHRR replacement,<br />
VIIRS. Metop A/B/C (AVHRR) data are provided by EUMETSAT. The generous provisions <strong>of</strong> the WMO<br />
framework, through which <strong>Australia</strong>n users can access the data free <strong>of</strong> charge (generally via BoM), cover<br />
both <strong>of</strong> these relationships. Likewise, the continuity <strong>of</strong> data from the Japanese geostationary weather satellite<br />
series is assumed to be guaranteed through WMO frameworks, with JMA being the key agency.<br />
<strong>Continuity</strong> <strong>of</strong> <strong>Earth</strong> <strong>Observation</strong> <strong>Data</strong> <strong>for</strong> <strong>Australia</strong>: R&D • January 2012 83
Low Resolution Optical <strong>Data</strong> Gap Risk Assessment: MODIS<br />
Sensor Status<br />
MODIS (MOderate Resolution Imaging Spectroradiometer) sensors are carried by the NASA Terra and<br />
Aqua satellites. Terra (launched in 1999) and Aqua (launched in 2002) are both operating well past their<br />
design life and are showing signs <strong>of</strong> senescence.<br />
National Significance<br />
MODIS is the single most widely used EO data source among the researchers consulted during the CEODA-<br />
R&D survey, being considered an essential research input to 45% <strong>of</strong> surveyed projects. <strong>Research</strong> which<br />
depends on this data source includes flood mapping, fire detection and <strong>for</strong>ecasting, land condition and<br />
cover monitoring, ocean colour and temperature studies, monitoring <strong>of</strong> coastal and inland water quality,<br />
evapotranspiration modelling, and weather and climate analyses.<br />
It is also currently used by 45% <strong>of</strong> the operational projects reported in the CEODA-Ops Report.<br />
Operational usage includes disaster mitigation and management, environmental and agricultural monitoring,<br />
oceanography and reef management, glaciology, and carbon accounting. A MODIS data gap would<br />
dramatically and rapidly demonstrate <strong>Australia</strong>’s current dependence on this data source.<br />
Alternative <strong>Data</strong> Sources<br />
The MODIS plat<strong>for</strong>ms have enabled most areas <strong>of</strong> the globe (and all regions <strong>of</strong> <strong>Australia</strong>) to be imaged two<br />
to four times per day <strong>for</strong> over a decade. MODIS records 36 spectral bands from blue to TIR with varying<br />
resolutions <strong>of</strong> 250 m, 500 m or 1000 m. An extensive range <strong>of</strong> MODIS data products has been developed<br />
and are routinely available from NASA at no cost. In particular, the global Fire and Thermal Anomalies<br />
(MOD14/MYD14) product relies on data from multiple MIR and TIR channels to highlight potential<br />
fire hotspots.<br />
Low resolution sensors that might be used in place <strong>of</strong> MODIS are detailed in Table 5-2.<br />
Current Sensors<br />
VIIRS<br />
(NPP/JPSS, USA)<br />
AVHRR<br />
(NOAA/Metop, USA/<br />
Europe)<br />
MERIS<br />
(Envisat, Europe)<br />
Future Missions<br />
OLCI<br />
(Sentinel-3, Europe)<br />
2013+<br />
SLSTR<br />
(Sentinel-3, Europe)<br />
2013+<br />
SGLI<br />
(GCOM-C, Japan)<br />
2014+<br />
Number<br />
<strong>of</strong> Bands<br />
Table 5-2 Possible Alternative Sensors <strong>for</strong> MODIS<br />
Spectral<br />
Range<br />
~ indicates approximate equivalence.<br />
84 <strong>Continuity</strong> <strong>of</strong> <strong>Earth</strong> <strong>Observation</strong> <strong>Data</strong> <strong>for</strong> <strong>Australia</strong>: R&D • January 2012<br />
Relative EO <strong>Data</strong> Characteristic Likely change<br />
Pixel<br />
Size<br />
Scene<br />
Size<br />
Revisit<br />
Interval<br />
Access<br />
in analytical<br />
accuracy<br />
↓ ~ ↑ ↑ ↑ Open ↓<br />
↓ ~ ↑ ↑ ~ Open ↓<br />
↓ ↓ ~ ↓ ↑ Open ↓<br />
↓ ↓ ↑ ↓ ↑ Open ?<br />
↓ ~ ~ ↓ ↑ Open ?<br />
↓ ~ ~ ↓ ↑ Constrained ?
EO DATA AVAILABILITY<br />
Although the recently launched VIIRS is the <strong>of</strong>ficial replacement sensor <strong>for</strong> MODIS, none <strong>of</strong> the current EO<br />
sensors match the spectral range, spatial resolution and revisit interval <strong>of</strong> MODIS. Only one VIIRS instrument<br />
is likely to be operational in the next five years, and it will have fewer and different spectral bands, lower<br />
spatial resolution and less frequent coverage than MODIS. The AVHRR sensor series has faithfully provided<br />
low resolution global imagery <strong>for</strong> decades and will continue to be used <strong>for</strong> oceanographic work, but <strong>of</strong>fers<br />
lower resolution than MODIS <strong>for</strong> many land applications. MERIS data is principally used <strong>for</strong> coastal and<br />
ocean applications but lacks TIR bands <strong>for</strong> land and sea surface temperature mapping applications.<br />
The planned Sentinel-3 sensor, OLCI, will not provide TIR data, and so will not be directly useful <strong>for</strong><br />
applications requiring surface temperature mapping; however, the SLSTR sensor (which builds on AATSR<br />
heritage) will. A further possible replacement <strong>for</strong> the MODIS sensor, SGLI, is not due <strong>for</strong> launch until 2014.<br />
Impact <strong>of</strong> Potential <strong>Data</strong> Gap <strong>for</strong> <strong>Australia</strong><br />
Many key EO-based land monitoring activities in <strong>Australia</strong> have grown from easy access to the frequent, high<br />
quality imagery provided by MODIS. While many <strong>of</strong> these activities will be transferable to other EO data<br />
sources, including the partial follow-on VIIRS, the process <strong>of</strong> source shifting will inevitably be experimental<br />
and costly. It is also likely to result in significant disruption to the many existing MODIS-dependent national<br />
archives and derived-product users that expect continuous access to standardised derived products (such<br />
as Leaf Area Index or aerosol products). If a MODIS data gap occurs be<strong>for</strong>e the future replacement options<br />
become available, or if production <strong>of</strong> key geophysical level 3-4 products is not continuring in a similar<br />
manner <strong>for</strong> the replacement data sources, the use <strong>of</strong> the currently available substitute data sources is likely<br />
to permanently undermine the continuity and reliability <strong>of</strong> these records, thus affecting the budgets <strong>of</strong> key<br />
national monitoring programs which rely on these data.<br />
While not designed as an ocean colour instrument, MODIS has been widely used <strong>for</strong> ocean colour<br />
applications. The VIIRS instrument was expected to replace MODIS in this capacity but according to the<br />
National <strong>Research</strong> Council (2011), “Many, if not most, users did not believe VIIRS could sustain the SeaWiFS/<br />
MODIS-Aqua time-series <strong>for</strong> quantitative observations”. Similarly, VIIRS is not expected to per<strong>for</strong>m as well <strong>for</strong><br />
flooding mapping or fire detection.<br />
One <strong>of</strong> the most critical <strong>Australia</strong>n applications that currently relies on MODIS imagery is bushfire detection<br />
and monitoring. The Sentinel Hotspots (operated by GA) and FireWatch (operated by Landgate) systems<br />
provide timely in<strong>for</strong>mation about fire locations to emergency service managers across <strong>Australia</strong>, and have<br />
particular value <strong>for</strong> less-populated regions. The working per<strong>for</strong>mance <strong>of</strong> VIIRS in fire detection remains to<br />
be evaluated and the revisit frequency would be considerably less than <strong>for</strong> the two MODIS sensors, given<br />
that only one VIIRS will be in orbit <strong>for</strong> the next five years. Alternative sensors, such as AVHRR, may be used<br />
to locate fire hotspots, but their spectral bands do not match the precision and reliability currently af<strong>for</strong>ded<br />
by MODIS data. Should a MODIS data gap eventuate be<strong>for</strong>e suitable replacement sensors are routinely<br />
acquiring comparable data, current users <strong>of</strong> these systems will have to lower their expectations and<br />
interpret results more judiciously.<br />
5.2.2 Medium Resolution Optical (10–80m)<br />
This data type is essential to more than 40% <strong>of</strong> the R&D activity surveyed, making this the second most<br />
essential data to <strong>Australia</strong>n researchers behind Low Resolution Optical data (primarily MODIS, VIIRS and<br />
AVHRR).<br />
Of these, the instruments on the Landsat series dominate (particularly TM and ETM+), being essential to all<br />
23 surveyed projects using this data type. Landsat-5 is well past its design life, having been launched in 1984,<br />
and is currently suspended after a significant technical failure. Landsat-7 was launched in 1999, with a 5-year<br />
design life. As a result <strong>of</strong> the launch failure <strong>of</strong> Landsat-6 and the failure <strong>of</strong> the Scan Line Corrector (SLC) in<br />
the Landsat-7 ETM+ instrument in 2003, however, approximately one quarter <strong>of</strong> the data in a Landsat-7<br />
scene is missing. Landsat-7 continues to acquire data in this mode, and data products are available with the<br />
<strong>Continuity</strong> <strong>of</strong> <strong>Earth</strong> <strong>Observation</strong> <strong>Data</strong> <strong>for</strong> <strong>Australia</strong>: R&D • January 2012 85
missing data optionally composited or filled in using other data from Landsat-7 or other satellites; however,<br />
this satisfies only a few applications (such as the Department <strong>of</strong> Climate Change and Energy efficiency’s<br />
annual <strong>for</strong>est-cover change mapping program <strong>for</strong> the National Carbon Accounting System).<br />
As is the case <strong>for</strong> Low Resolution Optical instruments, only the largest <strong>of</strong> the space agencies are typically<br />
capable <strong>of</strong> providing the kind <strong>of</strong> long-life and high-capacity system, with high data quality, that <strong>Australia</strong>n<br />
researchers require in support <strong>of</strong> their continued data requirements <strong>for</strong> the Medium Resolution Optical<br />
data. This data type requires sustained coverage and consistency in spectral, geometric, and calibration quality,<br />
given the large areas being covered.<br />
There is a short-term continuity risk <strong>for</strong> this data type as a result <strong>of</strong> the delay in launching the Landsat <strong>Data</strong><br />
<strong>Continuity</strong> Mission (LDCM/Landsat-8; launch currently scheduled <strong>for</strong> early 2013) and the Sentinel-2 series<br />
(scheduled <strong>for</strong> launch from 2013). The recent failure (and possible termination) <strong>of</strong> Landsat-5 makes this the<br />
most serious data continuity risk imminently facing many <strong>Australia</strong>n researchers, and would have serious<br />
consequences, given that <strong>Australia</strong> has invested heavily in the use <strong>of</strong> Landsat both operationally and <strong>for</strong><br />
several R&D programs <strong>of</strong> national significance.<br />
In the short term, there are no ideal candidates to replace Landsat data, and none that are free <strong>of</strong> charge.<br />
While SPOT (Spot Image), Resourcesat-2 (ISRO), RapidEye (Canada/Germany) and the DMC constellation<br />
data are available, all come at a significant cost to an R&D community which generally has low budgets<br />
<strong>for</strong> data procurement. In addition, these data sources do not always match the technical characteristics <strong>of</strong><br />
the Landsat data, particularly in the radiometric signal-to-noise, geometric accuracy, as well as key visible,<br />
NIR and SWIR bands, which several <strong>Australia</strong>n researchers have indicated are particularly important their<br />
specific projects.<br />
The medium term (from 2013), however, looks more promising, with planned availability <strong>of</strong> new generation<br />
systems from USGS and ESA (see Table 5-3).<br />
<strong>Data</strong> policy is not seen as a major risk <strong>for</strong> this data type, given the position being taken by both ESA<br />
and USGS.<br />
Both Sentinel-2 and LDCM are expected to operate on centralised, Internet-based data systems.<br />
The continuity <strong>of</strong> the world-wide network <strong>of</strong> Landsat ground stations is uncertain as <strong>of</strong> 2011 (although<br />
<strong>Australia</strong> is understood to be one <strong>of</strong> the favoured partners <strong>for</strong> a continued ground station partnership).<br />
This may have implications <strong>for</strong> supply channels to <strong>Australia</strong>n researchers, although most already use an ftp/<br />
Internet channel.<br />
USGS is the operational provider <strong>of</strong> the Landsat series data and maintains the free on-line archive. As such,<br />
USGS can be expected to remain the most important partner <strong>for</strong> <strong>Australia</strong>n researchers using this data<br />
type, in particular those who wish to use the full 30+ year time-series.<br />
86 <strong>Continuity</strong> <strong>of</strong> <strong>Earth</strong> <strong>Observation</strong> <strong>Data</strong> <strong>for</strong> <strong>Australia</strong>: R&D • January 2012
Table 5-3 <strong>Data</strong> <strong>Continuity</strong> Options: Medium Resolution Optical<br />
EO DATA AVAILABILITY<br />
Current Sensor Expected End <strong>of</strong> Life Possible Substitute Expected Availability Comments<br />
MSS, TM, ETM+<br />
(Landsat-5 & -7)<br />
HRVIR, HRG<br />
(SPOT-4 & -5<br />
series)<br />
ASTER<br />
(Terra)<br />
Imminent<br />
(Landsat-5 data<br />
acquisition was<br />
suspended on 18<br />
November 2011 <strong>for</strong> a<br />
period <strong>of</strong> 3 months)<br />
Operations expected<br />
through to 2013 and<br />
2014 respectively<br />
Sep 2013<br />
OLI, TIRS (LDCM) Early 2013 launch<br />
MSI (Sentinel-2)<br />
Sep 2013<br />
(May 2013 launch)<br />
SPOT-4 & -5 Current<br />
AWiFS & LISS-III<br />
(Resourcesat-2)<br />
iRS, MUX, Wfi-2<br />
(CBERS-3)<br />
UK DMC constellation;<br />
(Deimos, UK-2,<br />
NigeriaSat-2)<br />
Current<br />
Oct 2012 (Jun 2012<br />
launch)<br />
Current<br />
SPOT-6, -7 2012 launch<br />
MSI (Sentinel-2)<br />
No obvious<br />
replacement. ASTER<br />
optimised <strong>for</strong><br />
geological applications<br />
with 11 SWIR/TIR<br />
bands<br />
Sep 2013<br />
(May 2013 launch)<br />
Medium Resolution Optical <strong>Data</strong> Gap Risk Assessment: Landsat-5 TM<br />
Sensor Status<br />
Simulation data <strong>for</strong> VIS, SWIR<br />
and TIR bands is needed <strong>for</strong><br />
further evaluation.<br />
Simulation data <strong>for</strong> VIS-SWIR<br />
bands is needed <strong>for</strong> further<br />
evaluation. No TIR bands.<br />
Operational continuity <strong>for</strong><br />
20 years.<br />
No TIR bands. Commercial<br />
data policy<br />
No TIR bands.<br />
<strong>Data</strong> policy predominantly<br />
commercial<br />
<strong>Data</strong> capacity and<br />
architecture to be<br />
determined<br />
Simulation data <strong>for</strong> VIS-SWIR<br />
bands is needed <strong>for</strong> further<br />
evaluation. No TIR bands.<br />
Commercial data policy.<br />
Spatial resolution is higher<br />
(8m) but temporal and<br />
spatial coverage reduced.<br />
Simulation data <strong>for</strong> VIS-NIR<br />
bands is needed <strong>for</strong> further<br />
evaluation. Commercial data<br />
policy remains.<br />
Simulation data <strong>for</strong> VIS-SWIR<br />
bands is needed <strong>for</strong> further<br />
evaluation. Operational<br />
continuity <strong>for</strong> 20 years.<br />
Combined Multispectral and<br />
Hyperspectral missions (e.g.<br />
ALOS-3 or HyspIRI) would<br />
satisfy spectral requirements.<br />
The Landsat-5 satellite has been operating <strong>for</strong> over 27 years. On 18 November 2011, USGS reported<br />
major hardware problems with the Landsat-5 TM sensor which have necessitated suspension <strong>of</strong> its<br />
imaging activities <strong>for</strong> at least 90 days. These problems have substantially increased the likelihood <strong>of</strong> mission<br />
termination.<br />
National Significance<br />
The Landsat-5 TM sensor has supplied the vast majority <strong>of</strong> Medium Resolution Optical data used by the<br />
<strong>Australia</strong>n EO community, both <strong>for</strong> R&D and operational usage, since 1984. This imagery has been prized<br />
<strong>for</strong> its high quality, low cost, routine acquisition and outstanding reliability. It is considered an essential input<br />
<strong>Continuity</strong> <strong>of</strong> <strong>Earth</strong> <strong>Observation</strong> <strong>Data</strong> <strong>for</strong> <strong>Australia</strong>: R&D • January 2012 87
to over 40% <strong>of</strong> R&D projects in this survey, and is being used by over three-quarters <strong>of</strong> the operational<br />
programs detailed in the CEODA-Ops Report. The EO dependencies within these operational programs have<br />
been valued at more than $949 million (GA, 2010).<br />
Nearly one quarter <strong>of</strong> the R&D projects in this survey are totally reliant on Landsat-5 TM, with many more<br />
using this data type in combination with other EO data sources. <strong>Research</strong> areas covered by these projects<br />
include flood mapping, land use planning, ground cover mapping, <strong>for</strong>est carbon mapping, bushfire emission<br />
estimates, water usage and quality monitoring, <strong>for</strong>est monitoring, and evapotranspiration studies. Over a<br />
quarter <strong>of</strong> the operational projects cited in Geoscience <strong>Australia</strong> (2011), including the National Carbon<br />
Accounting System (NCAS), the International Forest Carbon Initiative (IFCI) and the National Forest<br />
Inventory, also rely heavily on this data source. These projects and programs (and others that have not been<br />
included in these surveys) will be directly affected by the recent Landsat-5 TM failure and resulting data gap.<br />
Alternative <strong>Data</strong> Sources<br />
Landsat-5 TM imaged all areas in <strong>Australia</strong> in 185 km strips every 16 days. This sensor recorded six spectral<br />
bands from blue to SWIR as 30 m pixels and one TIR band with 120 m pixels. Imagery was continuously<br />
acquired on a routine schedule and is now made available via the USGS <strong>Data</strong> Server without licensing<br />
restrictions.<br />
In Table 5-4, current and proposed sensors that could provide substitute datasets <strong>for</strong> Landsat-5 TM data<br />
are summarised in terms <strong>of</strong> their relative EO data characteristics. This list includes six currently available,<br />
medium resolution optical sensors, none <strong>of</strong> which <strong>of</strong>fer routine acquisition or open access (that is, images<br />
are only acquired on demand and are generally supplied with restricted licensing). Each <strong>of</strong> these sensors<br />
has data characteristics that could provide comparable (or better) analytical accuracy to Landsat-5 TM<br />
<strong>for</strong> some applications, but all would incur substantial data acquisition costs, as well as possible research on<br />
adapting current Landsat-specific processing methodologies and algorithms. Three future missions will <strong>of</strong>fer<br />
comparable (or higher) resolution data, but these data sources are not expected to be routinely available<br />
be<strong>for</strong>e 2013.<br />
<strong>Data</strong> costs in Table 5-4 should be compared with the free availability <strong>of</strong> Landsat-5 TM imagery <strong>of</strong>fered by<br />
the USGS GloVis website, or the standard price <strong>for</strong> new or archived Landsat-5 TM data from Geoscience<br />
<strong>Australia</strong> (GA) <strong>of</strong> 0.015 cents/km 2 . While it can be assumed that an economy <strong>of</strong> scale would reduce these<br />
costs <strong>for</strong> bulk ordering <strong>of</strong> data, the comparable data sources listed in Table 5-4 could cost from 133 to 4000<br />
times more than Landsat-5 TM imagery sourced from GA.<br />
The ASTER sensor is the only alternative to Landsat-5 TM that <strong>of</strong>fers an equivalent spectral range (blue to<br />
TIR), but records much smaller areas (60km cf. 185km). For large area studies, this would be a significant<br />
impediment to operational use.<br />
Usage <strong>of</strong> all other sensors would involve restrictions <strong>for</strong> some applications. All <strong>of</strong> these sensors record<br />
green, red and NIR wavelengths (that are relied upon <strong>for</strong> vegetation monitoring), and none record TIR<br />
wavelengths (that are used to study evapotranspiration and detect fires). Some sensors also do not record<br />
blue wavelengths (that are important <strong>for</strong> water quality studies), and/or SWIR (which is increasingly relied<br />
upon to differentiate woody land cover components in environmental monitoring applications).<br />
Given these restrictions, the most viable alternatives <strong>for</strong> Landsat-5 TM would be provided by the SPOT,<br />
RapidEye and Disaster Monitoring Constellation (DMC) satellites. While the LISS-III sensor <strong>of</strong>fers<br />
inexpensive imagery, past experience with image delivery has been problematic <strong>for</strong> several researchers<br />
surveyed, which suggests that this data source is unlikely to be sufficiently reliable <strong>for</strong> operational use.<br />
Two SPOT satellites, SPOT-4 and SPOT-5, are operated commercially by Spot Image and imagery is supplied<br />
with restricted licensing. These satellites currently only acquire imagery on demand but could be used<br />
in tandem to provide continental coverage (though at less frequent intervals than Landsat in northern<br />
<strong>Australia</strong>). While <strong>of</strong>fering higher resolution than Landsat, the RapidEye constellation <strong>of</strong> 5 spacecraft <strong>of</strong>fers<br />
at commercial rates Multispectral imagery at 6.5 m resolution and a revisit <strong>of</strong> 5.5 days at nadir. In <strong>Australia</strong>,<br />
RapidEye data is marketed by the AAM Group. The DMC comprises multiple satellites constructed by<br />
88 <strong>Continuity</strong> <strong>of</strong> <strong>Earth</strong> <strong>Observation</strong> <strong>Data</strong> <strong>for</strong> <strong>Australia</strong>: R&D • January 2012
EO DATA AVAILABILITY<br />
Surrey Satellite Technology Ltd (SSTL). Each satellite is independently owned and operated by different<br />
nations, including the UK (UK-DMC2), Spain (Deimos) and Nigeria (NigeriaSat-2). In <strong>Australia</strong>, data products<br />
from Deimos are marketed by Astrium, and have been used principally <strong>for</strong> agricultural applications. Imagery<br />
from UK-2 and NigeriaSat-2 are available without licensing restrictions via the Optical, Geospatial, Radar and<br />
Elevation panel (OGRE).<br />
Several operational programs in <strong>Australia</strong> that involve vegetation monitoring have already adapted to using<br />
SPOT data in place <strong>of</strong> Landsat-5 TM, but the absence <strong>of</strong> SWIR and TIR bands limits use <strong>of</strong> this data source<br />
in some application areas. Other data from the RapidEye and DMC constellations, as well as LISS, is not yet<br />
widely used, although this may change with the loss <strong>of</strong> Landsat-5 data. The DEIMOS sensor has been used<br />
<strong>for</strong> agricultural applications in <strong>Australia</strong>. Like the SPOT sensors, it does not record SWIR or TIR wavelengths,<br />
and also does not record blue wavelengths. Of the current sensors listed in Table 5-4, MRI (NigeriaSat-2)<br />
would be the most compatible with Landsat-5 TM. This new sensor <strong>of</strong>fers large scenes and records both<br />
blue and SWIR wavelengths.<br />
High resolution optical imagery could feasibly be used in place <strong>of</strong> Landsat-5 TM data. Usage <strong>of</strong> this data type,<br />
however, would involve significant increases in the cost <strong>of</strong> data acquisition, processing and storage. <strong>Data</strong><br />
costs <strong>for</strong> these commercial sources range from $1.50/km 2 to $30.00/km 2 —a very significant increase on<br />
the current GA cost <strong>for</strong> Landsat-5 TM imagery <strong>of</strong> 0.015 cents/km 2 . <strong>Data</strong> sharing would also be governed<br />
by restrictive licensing conditions. In some situations, low resolution optical data could be substituted <strong>for</strong><br />
Landsat-5 TM, but this substitution would result in significant reduction in the accuracy <strong>of</strong> analytical results.<br />
Current Sensors<br />
ASTER<br />
(Terra, Japan)<br />
HRVIR/HRG<br />
(SPOT, France)<br />
LISS-III<br />
(Resourcesat-1,<br />
India)<br />
MRI<br />
(NigeriaSat-2/DMC,<br />
Nigeria)<br />
RapidEye Imager<br />
(RapidEye, Germany)<br />
SLIM-6<br />
(Deimos/DMC,<br />
Spain)<br />
SLIM-6<br />
(UK-2/DMC, UK)<br />
Future Missions<br />
Number<br />
<strong>of</strong> Bands<br />
Table 5-4 Possible Alternative Sensors <strong>for</strong> Landsat-5 TM<br />
Spectral<br />
Range<br />
Pixel<br />
Size<br />
Relative EO <strong>Data</strong> Characteristic Likely<br />
Scene<br />
Size<br />
↑ ~ ↓ ↓<br />
↓ ↓ ↓ ↓<br />
Revisit<br />
Interval<br />
=<br />
(Flexible)<br />
↑<br />
(Flexible)<br />
Standard<br />
Cost<br />
(cents/km2)<br />
4-16<br />
70-106<br />
↓ ↓ ↓ ↓ ↑ 2<br />
↓ ↓ ~ ↑<br />
↑<br />
(Flexible)<br />
↓ ↓ ↓ ↓ ↑ NI<br />
↓ ↓ ~ ↑<br />
↓ ↓ ~ ↑<br />
↑<br />
(Flexible)<br />
↑<br />
(Flexible)<br />
NI<br />
NI<br />
14-36<br />
Availability<br />
and Access<br />
By request;<br />
licensing<br />
conditions<br />
By request;<br />
licensing<br />
conditions<br />
By request;<br />
licensing<br />
conditions<br />
By request;<br />
open licence<br />
<strong>of</strong>fered via<br />
OGRE<br />
By request;<br />
licensing<br />
conditions<br />
By request;<br />
licensing<br />
conditions<br />
By request;<br />
open licence<br />
<strong>of</strong>fered via<br />
OGRE<br />
change in<br />
analytical<br />
accuracy<br />
<strong>Continuity</strong> <strong>of</strong> <strong>Earth</strong> <strong>Observation</strong> <strong>Data</strong> <strong>for</strong> <strong>Australia</strong>: R&D • January 2012 89<br />
↑<br />
Depends on<br />
application<br />
Depends on<br />
application<br />
Depends on<br />
application<br />
Depends on<br />
application<br />
Depends on<br />
application<br />
Depends on<br />
application<br />
CBERS-2 (2012+) ↑ ~ ↑ ↑ ↓ NI Open ↑<br />
LDCM (2013+) ~ ~ ~ ~ ~ NI Open ↑<br />
Sentinel (2013+) ↑ ↓ ↑ ↑ ↓ NI Open<br />
~ indicates approximate equivalence. NI indicates no in<strong>for</strong>mation.<br />
Depends on<br />
application
Impact <strong>of</strong> Potential <strong>Data</strong> Gap <strong>for</strong> <strong>Australia</strong><br />
The economic impact to <strong>Australia</strong> <strong>of</strong> losing access to Landsat-5 TM data has been assessed as $100 million<br />
in the first year <strong>of</strong> a data gap, with a flow on effect in subsequent years <strong>for</strong> the duration <strong>of</strong> that gap (ACIL<br />
Tasman, 2010). Even when substitute data sources are suitable and af<strong>for</strong>dable, the process <strong>of</strong> source shifting<br />
will inevitably disrupt many monitoring applications and delay product delivery. If substitute data sources<br />
do not exist, or cannot be obtained under existing budgetary provisions, some research and operational<br />
activities will not be able to deliver their expected end-products.<br />
The most critical application areas affected by this data gap are land-use change and agriculture mapping,<br />
carbon accounting, water resource assessment (including monitoring <strong>of</strong> water quality, availability and usage)<br />
and bushfire warning and emissions abatement systems. These applications require regular, and <strong>of</strong>ten high<br />
frequency, Medium Resolution Optical data which have measured blue and/or SWIR/TIR wavelengths.<br />
Of the possible alternative sensors listed in Table 5-4, these wavelengths are only currently recorded by<br />
the ASTER sensor <strong>for</strong> pre-ordered imagery. It must be stressed that several <strong>of</strong> these applications areas<br />
now involve legislative monitoring (such as NCAS and the recent Carbon Farming Initiative) and further<br />
legislation is expected to be <strong>for</strong>thcoming <strong>for</strong> water resource monitoring.<br />
While Landsat-7 composite imagery can be used <strong>for</strong> some, but not all, <strong>of</strong> these applications, it must also be<br />
stressed that this satellite is operating well past its design life.<br />
In addition, several ongoing government monitoring activities have been nurtured by the ready availability<br />
<strong>of</strong> Landsat-5 TM, but may not be equipped with the resources to purchase commercial imagery and/or<br />
undertake source shifting. Such activities could include land use planning, compliance monitoring, native<br />
vegetation monitoring, and coastal, wetland and water resource management. Interruption to these activities<br />
will deprive resource managers from these, now customary, data inputs and will result in irreplaceable gaps<br />
in <strong>Australia</strong>’s environmental in<strong>for</strong>mation records.<br />
5.2.3 High Resolution Optical (
EO DATA AVAILABILITY<br />
continuity <strong>for</strong> two decades. Until a similar level <strong>of</strong> continuity <strong>for</strong> L-band SAR data is established, these<br />
C-band data sources would likely represent the favoured SAR data <strong>of</strong> choice <strong>for</strong> <strong>Australia</strong>n researchers and<br />
dominate future usage.<br />
L-band SAR<br />
L-band data is <strong>of</strong> great value in vegetation and <strong>for</strong>estry studies, and the termination <strong>of</strong> ALOS was a<br />
significant loss to research in support <strong>of</strong> programs such as the International Forest Carbon Initiative<br />
and other woody vegetation mapping studies. The best prospect <strong>for</strong> recommencement <strong>of</strong> the supply <strong>of</strong><br />
appropriate data is the SAOCOM 1A mission being planned by CONAE (Argentina) in 2014. ALOS-2<br />
PALSAR data will also be available from 2013, but it is anticipated that the data policy may still emphasise<br />
commercial distribution.<br />
X-band SAR<br />
the italian and German PPP X-band systems (TerraSAR-x/TanDEM-X and COSMO-SkyMed) will continue<br />
data provision with follow-on missions planned. Spain will join this group with the launch <strong>of</strong> the PAZ satellite<br />
in 2012. It can be assumed, given Spanish Government policy, that PAZ data will be fully commercial.<br />
Table 5-5 <strong>Data</strong> <strong>Continuity</strong> Options: SAR<br />
Current Sensor Expected End <strong>of</strong> Life Possible Substitute Expected Availability Comments<br />
C-Band<br />
ASAR<br />
(Envisat)<br />
&<br />
SAR (Radarsat series)<br />
L-Band<br />
None<br />
X-Band<br />
X-band SAR<br />
(TerraSAR-X series)<br />
&<br />
SAR 2000<br />
(COSMO-Skymed<br />
series)<br />
Envisat – 2013<br />
Radarsat-2 – 2015<br />
terraSAR-X – 2013<br />
tanDEM-X – 2015<br />
COSMO-SkyMed –<br />
2014 to 2017<br />
Sentinel-1 series<br />
RCM series<br />
SAOCOM 1A<br />
ALOS-2<br />
KOMPSAT-5 (Korea)<br />
terraSAR-X2<br />
COSMO 2nd Gen<br />
PAZ SAR-X (Spain)<br />
HY-3 series (China)<br />
Sentinel-1: Oct 2013<br />
(May 2013 launch)<br />
RCM C-1: Dec 2015<br />
(Aug 2015 launch)<br />
Apr 2015<br />
(Dec 2014 launch)<br />
May 2013<br />
(Jan 2013 launch)<br />
Early 2012<br />
(late 2011 launch)<br />
2015<br />
2015<br />
Early 2013<br />
(late 2012 launch)<br />
From 2012<br />
Sentinel-1 data policy<br />
expected to be free<br />
and open with 20 year<br />
continuity.<br />
RCM data policy TBD.<br />
SAOCOM data policy<br />
TBD. Indications are it<br />
may be open <strong>for</strong> <strong>for</strong>est<br />
carbon use.<br />
ALOS-2 data policy<br />
currently likely to be<br />
commercial but TBD.<br />
European missions are<br />
commercially operated.<br />
Chinese data availability<br />
is unconfirmed.<br />
China’s HJ series <strong>of</strong> satellites will include S-band SAR from 2012. the UK’s S-band NovaSAR (SStL) has<br />
been proposed <strong>for</strong> rapid implementation and has received some seed funding already. ESA’s BIOMASS<br />
mission (launch date to be determined) will <strong>of</strong>fer P-band SAR.<br />
Open access to the ESA/EC Sentinel series should significantly improve the continuity <strong>of</strong> C-band SAR data,<br />
and may result in increased <strong>Australia</strong>n R&D use <strong>of</strong> this data type. Relations with CONAE and JAXA will be<br />
very important if <strong>Australia</strong>n researchers are to secure access to L-band SAR data. The role <strong>of</strong> China as an<br />
X-, S- and C-band SAR data supplier is yet to be established.<br />
<strong>Continuity</strong> <strong>of</strong> <strong>Earth</strong> <strong>Observation</strong> <strong>Data</strong> <strong>for</strong> <strong>Australia</strong>: R&D • January 2012 91
SAR <strong>Data</strong> Gap Risk Assessment: L-band SAR<br />
National Significance and Sensor Status<br />
L-band SAR, when combined with a systematic global acquisition strategy like the one used by ALOS, is<br />
the most in<strong>for</strong>mation rich space-based SAR data source available to researchers studying vegetation cover<br />
change, vegetation classification and routine optical satellite mapping. In the case <strong>of</strong> <strong>for</strong>est monitoring, such<br />
applications are <strong>of</strong> vital importance to the viability <strong>of</strong> one <strong>of</strong> <strong>Australia</strong>’s main international climate policies<br />
and overseas development assistance programs – the use <strong>of</strong> space data in support <strong>of</strong> inclusion <strong>of</strong> <strong>for</strong>ests in<br />
a post-Kyoto climate agreement and in future carbon market mechanisms. Such capabilities have been the<br />
subject <strong>of</strong> considerable investment through the International Forest Carbon Initiative (IFCI), the GEO Forest<br />
Carbon Tracking (GEO-FCT) activity, and now the Global Forest <strong>Observation</strong>s Initiative (GFOI) – which<br />
<strong>Australia</strong> has been leading. <strong>Australia</strong> has been promoting the international adoption <strong>of</strong> its methodologies<br />
and systems <strong>for</strong> the use <strong>of</strong> satellite data as employed in the National Carbon Accounting System (NCAS),<br />
particularly in Indonesia.<br />
The sudden termination <strong>of</strong> the only spaceborne L-band sensor in April 2011 (PALSAR on the ALOS<br />
spacecraft) has left all <strong>of</strong> these ef<strong>for</strong>ts without their most productive data stream. JAXA had already signalled<br />
prior to the termination <strong>of</strong> ALOS that they were revising their national data policy to focus on commercial<br />
pricing <strong>of</strong> the PALSAR data, rather than generous supplies <strong>for</strong> public good.<br />
Alternative <strong>Data</strong> Sources<br />
There will be no L-band SAR satellite data sources until early 2013, with the launch <strong>of</strong> ALOS-2, or late 2014<br />
with the launch <strong>of</strong> SAOCOM-1A. ALOS-2 is likely to have a commercial data policy.<br />
Impact <strong>of</strong> Potential <strong>Data</strong> Gap <strong>for</strong> <strong>Australia</strong><br />
In the absence <strong>of</strong> L-band SAR, it remains to be determined whether the necessary coverage and<br />
in<strong>for</strong>mation extraction will be possible world-wide using other available SAR data (C-, S- and X-band), and<br />
combined with optical data, in order to meet the requirements <strong>of</strong> the GFOI. The L-Band SAR data would<br />
have been especially useful in support <strong>of</strong> coverage needs <strong>of</strong> regional neighbours such as Indonesia.<br />
Estimates <strong>of</strong> alternate data cost are somewhat academic (in the absence <strong>of</strong> an L-band SAR data source), but<br />
the current pricing by the Japanese distributor REStEC <strong>for</strong> a 30x70km polarimetric PALSAR archive scene<br />
is around AUD $675 – or around $0.3 per km 2 (Japanese EO data has never been priced at full commercial<br />
rates). A national scale dataset is not necessary <strong>for</strong> all applications but to give an indication <strong>of</strong> commercially<br />
equivalent data costs, the annual cost to provide national scale coverage twice a year (as needed in <strong>for</strong>est<br />
carbon reporting applications) <strong>of</strong> <strong>Australia</strong>n territory (which is 7.7 million km 2 ) would be approximately<br />
$4.6 M. <strong>for</strong> comparison, X-band SAR data pricing is around $1.6 per km 2 (i.e. more than five times as much,<br />
and considerably more expensive <strong>for</strong> fine resolution data). All <strong>of</strong> these price estimates assume data from<br />
the archive and not by satellite tasking – which can increase the cost by a factor <strong>of</strong> 10 or more – and do<br />
not take into account possible bulk purchase discount arrangements. Licenses <strong>for</strong> re-use <strong>of</strong> commercially<br />
provided data by multiple users can typically increase the data cost by 2-4 times.<br />
5.2.5 Passive Microwave Radiometry<br />
This data type is essential to seven <strong>of</strong> the 56 R&D projects covered by this survey. Table 5-6 summarises the<br />
key satellite supply sources <strong>for</strong> Passive Microwave Radiometry.<br />
The most immediate challenge in relation to this data type is finding a replacement <strong>for</strong> the AMSR-E<br />
instrument (aboard NASA’s Aqua plat<strong>for</strong>m), which failed in October 2011 after providing invaluable data <strong>for</strong><br />
nine years. The data was used in several <strong>Australia</strong>n research applications, most notably in the CAWCR/BoM<br />
and WiRADA projects reviewed in the context <strong>of</strong> the present survey. <strong>for</strong>tunately, JAXA plans to launch<br />
92 <strong>Continuity</strong> <strong>of</strong> <strong>Earth</strong> <strong>Observation</strong> <strong>Data</strong> <strong>for</strong> <strong>Australia</strong>: R&D • January 2012
EO DATA AVAILABILITY<br />
AMSR-2 on GCOM-W1 in february 2012. NOAA is supporting ef<strong>for</strong>ts by JAXA to have AMSR-2 data<br />
distributed via the WMO systems, and this should guarantee access to the data <strong>for</strong> <strong>Australia</strong>n researchers,<br />
on the timescales that they require. The microwave instruments (MWRI) aboard the Chinese polar orbiting<br />
weather satellite series (FY-3, currently operating and with planned replacements) could <strong>of</strong>fer a back-up<br />
alternative to the AMSR series in the event <strong>of</strong> unexpected data gaps, such as might occur in the lead-up to<br />
GCOM-W1 data availability.<br />
There is reasonable confidence that the US Department <strong>of</strong> Defense will assure continuity <strong>of</strong> the DMSP<br />
series missions, and <strong>of</strong> the SSM/I and SSM/IS instruments that are used by CAWCR/BoM, WIRADA and<br />
other researchers. the NASA/JAXA TRMM mission is close to completion, with the Global Precipitation<br />
Measuring (GPM) mission, a multi-national constellation <strong>of</strong> satellites, set to follow it from mid-2013.<br />
Table 5-6 <strong>Data</strong> <strong>Continuity</strong> Options: Passive Microwave Radiometers<br />
Current Sensor Expected End <strong>of</strong> Life Possible Substitute Expected Availability Comments<br />
AMSR-E<br />
(Aqua)<br />
SSM/I<br />
(DMSP series)<br />
TMI<br />
(TRMM)<br />
MIRAS<br />
(SMOS)<br />
Unexpectedly<br />
terminated Oct 2011<br />
Operational continuity<br />
guaranteed by US DoD<br />
AMSR-2 (GCOM-W1)<br />
Imminent GMI (GPM)<br />
Jun 2012<br />
(Feb 2012 launch)<br />
MWRI (FY-3 series) Current<br />
SSM/IS Ongoing<br />
MADRAS<br />
(Megha-Tropiques)<br />
Oct 2013<br />
(Jul 2013 launch)<br />
Late 2011<br />
(Oct 2011 launch)<br />
Late 2012 Aquarius (SAC-D) Current<br />
L-band Radiometer/<br />
Radar (SMAP)<br />
Late 2014<br />
SAR-L (RISAT-3) 2016<br />
Immediate data gap<br />
Access arrangements<br />
uncertain. <strong>Data</strong><br />
capacities uncertain.<br />
SSM/I instrument will<br />
evolve as SSM/IS on<br />
future DMSP satellites<br />
Operational continuity<br />
<strong>for</strong> 20 years<br />
<strong>Data</strong> access<br />
arrangements are TBA<br />
Considered, not<br />
confirmed<br />
The Megha-Tropiques (CNES/ISRO) satellite, launched on 12 October 2011, carries the MADRAS<br />
microwave imager, designed primarily <strong>for</strong> studying precipitation and cloud properties, and may be a source<br />
<strong>of</strong> data <strong>for</strong> <strong>Australia</strong>n R&D centres with an interest in water cycle issues.<br />
The SMOS mission <strong>of</strong> ESA (launched in 2009) is a new source <strong>of</strong> data <strong>for</strong> soil moisture measurements but<br />
it ends life in 2012. Soil moisture is a critical parameter <strong>for</strong> flood <strong>for</strong>ecasting, severe weather prediction, and<br />
agricultural and water management activities. The Argentina-USA mission SAC-D/Aquarius, launched in June<br />
2011, <strong>of</strong>fers a second source <strong>of</strong> this new data type <strong>for</strong> <strong>Australia</strong>n researchers. Still another will be available<br />
when NASA launches the SMAP (Soil Moisture Active Passive) mission in late 2014.<br />
the USA (DoD/NOAA) and Japan (JAXA) will be the providers <strong>of</strong> the main data sources from the DMSP<br />
and GCOM-W series. Rainfall data from GPM is also a predominantly USA-Japan contribution. China could<br />
emerge as a contributor using the FY-3 series, and the recent launch <strong>of</strong> Megha-Tropiques also brings India<br />
and France into this sector. Nonetheless, <strong>for</strong> the <strong>for</strong>eseeable future, soil moisture data will depend on ESA,<br />
NASA, and perhaps India.<br />
<strong>Continuity</strong> <strong>of</strong> <strong>Earth</strong> <strong>Observation</strong> <strong>Data</strong> <strong>for</strong> <strong>Australia</strong>: R&D • January 2012 93
5.2.6 Radar Altimetry<br />
Current <strong>Data</strong> Sources and Life Expectancy<br />
Radar Altimeters are an essential source <strong>of</strong> data <strong>for</strong> eight <strong>of</strong> the 56 projects included in the present survey.<br />
Key application areas <strong>for</strong> these projects include: global mean sea level climate data records, ocean current<br />
applications and geoscience applications. The key supply instruments are summarised in Table 5-7.<br />
Table 5-7 <strong>Data</strong> <strong>Continuity</strong> Options: Radar Altimeters<br />
Current Sensor Expected End <strong>of</strong> Life Possible Substitute Expected Availability Comments<br />
POSEIDON-2<br />
(Jason-1)<br />
POSEIDON-3<br />
(Jason-2)<br />
Sept 2013<br />
Dec 2013<br />
POSEIDON-3<br />
(Jason-2)<br />
POSEIDON-3B<br />
(Jason-3)<br />
94 <strong>Continuity</strong> <strong>of</strong> <strong>Earth</strong> <strong>Observation</strong> <strong>Data</strong> <strong>for</strong> <strong>Australia</strong>: R&D • January 2012<br />
Currently available<br />
June 2014<br />
(launch Apr 2014)<br />
ALT (HY-2A) Currently flying<br />
AltiKa<br />
SRAL (Sentinel-3)<br />
RA-2 (Envisat) Dec 2013 SRAL (Sentinel-3)<br />
SIRAL (CryoSat-2) Dec 2013 SRAL (Sentinel-3)<br />
June 2012<br />
(launch Apr 2012)<br />
Apr 2014<br />
(Launch Nov 2013)<br />
Apr 2014<br />
(Launch Nov 2013)<br />
Apr 2014<br />
(Launch Nov 2013)<br />
POSEIDON-2 well<br />
past 3-year design life<br />
POSEIDON-3 past<br />
3-year design life<br />
<strong>Data</strong> access and data<br />
quality uncertain<br />
CNES pushing ISRO<br />
<strong>for</strong> an open data policy,<br />
but uncertain<br />
Strong continuity<br />
option; free and open<br />
data policy expected<br />
Well past design life;<br />
recent orbit change<br />
has affected coverage<br />
Useful <strong>for</strong> operational<br />
continuity<br />
the key current supply instruments are the POSEiDON instruments on the tOPEX/Jason missions. Jason-1<br />
(launched 2001) and Jason-2 (launched 2008) are currently operational beyond their 3-year design life. Both<br />
are currently supported <strong>for</strong> extended operation through to late 2013.<br />
It is generally considered that the availability <strong>of</strong> a single altimeter instrument is sufficient to ensure continuity<br />
<strong>of</strong> global mean sea level observations, provided that there is six to nine months overlap—depending on<br />
the technology involved—between successive missions. However, some researchers have suggested that<br />
a minimum <strong>of</strong> three or four operational altimeters are needed to meet the requirements <strong>for</strong> R&D in<br />
support <strong>of</strong> operational activities like marine safety and defence operations. In order to meet these latter<br />
requirements, surveyed projects are using the two POSEIDON sensors currently flying, and the altimeters<br />
on Envisat (RA-2, launched 2002, well into extended operations), and CryoSat-2 (launched 2010, projected<br />
operation until end 2013). Ocean current and topography monitoring, and <strong>for</strong>ecasting (c.f. BLUELink, BoM),<br />
are the more demanding applications, requiring higher observational frequencies and latencies <strong>of</strong> just hours.<br />
There is some risk to the continuity <strong>of</strong> global sea level measurements, with a possible gap (or, at least, a<br />
possible lack <strong>of</strong> required cross-calibration overlap) in the Jason series, with Jason-2 ending in December<br />
2013 and Jason-3 scheduled <strong>for</strong> launch in April 2014. in practice, it is very possible that Jason-2 operations<br />
can be extended (Jason-1 has been flying <strong>for</strong> ten years) to close this gap. furthermore, Sentinel-3A is<br />
scheduled to launch in December 2013 and could mitigate a possible gap (although not in the same class as<br />
the Jason series, it does share some common heritage). Conversely, Jason-3 funding shortfalls continue in the<br />
provider agencies and there remains a risk <strong>of</strong> launch delay.<br />
There is also a very real risk that the minimum number <strong>of</strong> three to four operational altimeters required<br />
<strong>for</strong> near real-time monitoring and <strong>for</strong>ecasting applications may not be sustained. Operational continuity is<br />
a major topic <strong>of</strong> discussion in this user community, particularly in support <strong>of</strong> applications including defence,<br />
weather and marine safety.
EO DATA AVAILABILITY<br />
The POSEIDON series <strong>of</strong> instruments is the class-defining standard <strong>for</strong> Radar Altimeters. <strong>Continuity</strong> in this<br />
series, including the necessary temporal overlap in coverage, is an ongoing planning issue. Although tentative<br />
funding arrangements <strong>for</strong> the Jason-3 mission were confirmed in early 2011, the potential <strong>for</strong> funding<br />
shortfalls remains a reality and a launch delay is a genuine risk. Of the future non-Jason altimeter missions,<br />
SRAL, on the Sentinel-3 mission, appears to be the best continuity option. The Sentinel-3 series is initially<br />
funded <strong>for</strong> at least two missions, Sentinel-3A (November 2013–2021) and Sentinel-3B (December 2014–<br />
2022), with the expectation <strong>of</strong> continuity <strong>for</strong> decades to come.<br />
The CryoSat-2 mission was successfully launched in April 2010, following the failed launch <strong>of</strong> CryoSat<br />
in 2005. As data from the SIRAL altimeter becomes available, developers <strong>of</strong> operational applications are<br />
beginning to make use <strong>of</strong> it. CryoSat-2 is a nominal 3-year mission, scheduled to end in December 2013, but<br />
likely to operate <strong>for</strong> longer. The Chinese HY-2A mission was launched in August 2011, and carries the ALT<br />
altimeter. While the Chinese have indicated that they will make data from this instrument available, it has not<br />
yet started to flow. The launch <strong>of</strong> AltiKa (SARAL) is planned <strong>for</strong> April 2012. It appears that AltiKa will be a<br />
high quality instrument. The data access policy, however, has not been finalised, with ISRO resisting the CNES<br />
preference <strong>for</strong> open access.<br />
Europe (particularly France) has been the world leader in this data type <strong>for</strong> two decades, and has engaged<br />
in effective partnership with the USA to ensure Jason series continuity. the expected addition <strong>of</strong> SRAL on<br />
Sentinel-3 underscores the importance <strong>of</strong> European relationships in ensuring continuity <strong>of</strong> data access. The<br />
relationship with NOAA, on access to Jason data with low latency, also remains very important in this area.<br />
China and India may emerge as being important as alternative providers.<br />
5.2.7 Hyperspectral Imagery<br />
Current <strong>Data</strong> Sources and Life Expectancy<br />
Hyperspectral imagery (also called “imaging spectroscopy”) is considered by many <strong>of</strong> the surveyed<br />
groups as major step-change in optical remote sensing, as it is expected to <strong>of</strong>fer an unprecedented<br />
operational capacity to better distinguish (“fingerprint”) different terrestrial, atmospheric, man-made and<br />
aquatic chemicals and materials, as well as to provide physics-based quantitative measurement <strong>of</strong> their<br />
concentrations. There has long been interest and expertise in Hyperspectral imagery within the <strong>Australia</strong>n<br />
science community, notably, following the announcement <strong>of</strong> the ARIES-1 mission in 1996. The benefits <strong>of</strong> this<br />
data type in resource exploration and agricultural applications are well known. As such, <strong>Australia</strong>, perhaps<br />
more than any other country, is positioned to derive significant benefit from an accessible, high quality<br />
Hyperspectral satellite data source. <strong>Australia</strong>’s R&D community has benefitted greatly from access to one<br />
<strong>of</strong> the best airborne Hyperspectral imaging systems designed, built and operated in <strong>Australia</strong> (HyMap),<br />
as well as numerous other airborne Hyperspectral data providers operating overseas-built instruments.<br />
CSIRO scientists also have ongoing collaboration locally with DSTO and several mining companies, and<br />
internationally with Japan and Germany, and are members <strong>of</strong> the international science team <strong>for</strong> NASA’s<br />
planned HyspIRI mission.<br />
Hyperspectral imagery is deemed essential to ten <strong>of</strong> the 56 R&D projects covered by the present survey.<br />
The majority <strong>of</strong> these utilise commissioned aerial survey data from both <strong>Australia</strong>n and overseas companies<br />
or agencies, while some also make use <strong>of</strong> experimental satellite data from the Hyperion (NASA) and<br />
CHRIS (Compact High Resolution Imaging Spectrometer, ESA) spaceborne sensors, to develop novel<br />
applications. The Hyperion sensor (Hyperspectral, with hundreds <strong>of</strong> individual spectral bands) and CHRIS<br />
sensor (Multispectral, up to 63 spectral bands) are still in operation and providing research data despite<br />
being well past their design life. Hyperion has been authorised <strong>for</strong> operations by NASA through to<br />
September 2013. The International Space Station also hosts a Hyperspectral payload <strong>for</strong> Ocean Colour<br />
studies (HICO), and this has been in operation since 2009.<br />
There are a number <strong>of</strong> countries competing to provide the first new civilian Hyperspectral missions, with<br />
Hyperion (onboard EO-1) and CHRIS (onboard Proba) having been considered experimental, and without<br />
<strong>Continuity</strong> <strong>of</strong> <strong>Earth</strong> <strong>Observation</strong> <strong>Data</strong> <strong>for</strong> <strong>Australia</strong>: R&D • January 2012 95
the signal-to-noise ratio, spectral or operational characteristics that are optimal <strong>for</strong> many applications.<br />
These new systems include: Italy, with PRISMA (likely to have a commercial focus); Germany, with EnMAP,<br />
a research mission possibly with some commercial interest; and Japan, with HISUI (<strong>for</strong>merly Hyper-X)<br />
onboard ALOS-3 but with an unknown data access policy. The Italian PRISMA mission is scheduled to launch<br />
first (in 2014, see Table 5-8), followed by the launch <strong>of</strong> EnMAP (DLR) in 2015, which will provide a source<br />
<strong>of</strong> 30m resolution high-quality Hyperspectral imagery. ALOS-3 plans are uncertain and the project is yet to<br />
receive funding from either MEti or JAXA, although a provisional date <strong>of</strong> 2014 is set <strong>for</strong> its launch.<br />
HyspIRI (NASA) is the most ambitious <strong>of</strong> these missions, with an anticipated 19-day repeat cycle at<br />
50 m resolution over all terrestrial and coastal areas, and 1000m resolution over all oceans, producing an<br />
anticipated 5 TB <strong>of</strong> raw, uncompressed data per day. The mission is presently under consideration <strong>for</strong> US<br />
funding, and not planned <strong>for</strong> launch be<strong>for</strong>e 2018-2020.<br />
Table 5-8 <strong>Data</strong> <strong>Continuity</strong> Options: Hyperspectral Imagers<br />
Current Sensor Expected End <strong>of</strong> Life Possible Substitute Expected Availability Comments<br />
Hyperion<br />
(EO-1)<br />
Well past design life –<br />
operations authorised<br />
until Sep 2013<br />
HSI (EnMAP) 2015<br />
96 <strong>Continuity</strong> <strong>of</strong> <strong>Earth</strong> <strong>Observation</strong> <strong>Data</strong> <strong>for</strong> <strong>Australia</strong>: R&D • January 2012<br />
Late 2013 or early<br />
2014 launch<br />
HYC (PRISMA) 2014 Launch June 2014<br />
HISUI (ALOS-3) 2014 No firm launch date<br />
Unless more comprehensive coordination initiatives are developed around Hyperspectral data exploitation,<br />
the risk remains that all Hyperspectral imagery available in the next decade will only be available through<br />
limited research agreements or commercial arrangements. This has significantly limited the uptake <strong>of</strong> other<br />
EO data types, such as X-band SAR data, in <strong>Australia</strong> (and elsewhere) in the past, and may have the same<br />
impact on the usage <strong>of</strong> Hyperspectral imagery. Furthermore, some <strong>of</strong> the larger research programs aiming<br />
to exploit these data may not be ready to receive, archive or process the massive amounts <strong>of</strong> data which<br />
these systems will produce once operational.<br />
<strong>Australia</strong>’s science heritage with Hyperspectral data, availability <strong>of</strong> high-quality airborne data, and our<br />
resource-oriented economy potentially position us to make the most <strong>of</strong> the opportunity provided by<br />
these multiple new planned data sources. <strong>Australia</strong>n investment and/or participation (<strong>for</strong> example, through<br />
science team membership) in these missions would contribute to reducing the risk associated with ensuring<br />
<strong>Australia</strong>n access to this data.<br />
5.2.8 Lidar<br />
Satellite Lidar was identified as essential by five <strong>of</strong> the 56 projects surveyed, and airborne Lidar by six<br />
projects, with one <strong>of</strong> these projects using both sources. There are two main applications <strong>for</strong> Lidar—<br />
atmospheric measurements <strong>for</strong> the study <strong>of</strong> aerosols, winds and clouds, and land measurements <strong>for</strong><br />
topographic studies or vegetation and biomass estimation, such as canopy pr<strong>of</strong>iling in <strong>for</strong>estry. Amongst the<br />
projects surveyed <strong>for</strong> this study, most <strong>of</strong> the applications <strong>of</strong> Lidar were focused on land measurements, with<br />
the notable exception <strong>of</strong> CAWCR, which is involved in climate and weather modelling. Full-wave<strong>for</strong>m Lidar<br />
is considered to be the most advanced and rich source <strong>of</strong> Lidar data in the <strong>for</strong>estry, cropping and biomass<br />
assessment and R&D sectors, as it provides unprecedented levels <strong>of</strong> detail in terms <strong>of</strong> the 3-dimensional<br />
structure <strong>of</strong> the aboveground vegetation.<br />
At present there is only one Lidar satellite, NASA’s CALIPSO, which is focused on atmospheric studies,<br />
and is funded to continue until September 2013 (although now beyond mission design life). NASA’s ICESat<br />
mission did carry the GLAS Lidar instrument, which was only marginally suitable <strong>for</strong> land measurements due<br />
to its low spatial resolution. That mission, however, ended in August 2010. ICESat-II is being planned, and<br />
will carry a similar instrument, although it is not being considered <strong>for</strong> launch until 2016, and is still subject to<br />
programmatic approval.
EO DATA AVAILABILITY<br />
With reference to Table 5-9, space-borne Lidar data will continue to be available only on an experimental<br />
or ‘one-<strong>of</strong>f’ mission basis, rather than in any sustained fashion. The NASA ICESat and ICESat-II missions serve<br />
to illustrate the existing situation. Whereas the first ICESat mission carried an infrared laser, the ICESat-II<br />
mission will change technology and use a green laser. This will potentially require significant adjustment by<br />
researchers using the existing data stream, to re-tune and re-calibrate activities to make best use <strong>of</strong> the new<br />
data stream.<br />
Table 5-9 <strong>Data</strong> <strong>Continuity</strong> Options: Lidar<br />
Current Sensor Expected End <strong>of</strong> Life Possible Substitute Expected Availability Comments<br />
CALIOP (CALIPSO) Sept 2013 ALADIN (ADM-Aeolus) Nov 2013<br />
Should provide a good<br />
continuity option <strong>for</strong><br />
CAWCR<br />
ATLID (<strong>Earth</strong>CARE) Oct 2013 Significant schedule risk<br />
CO2 Lidar (ASCENDS) 2020+<br />
HSRL (ACE) 2020+<br />
HDWL (3D Winds) 2030+<br />
ICESat Ended Aug 2010 ICEBridge Currently available<br />
ICESat-II 2016<br />
Laser altimeter (LIST) 2030+<br />
Mission still under<br />
review, not yet approved<br />
Mission still under<br />
review, not yet approved<br />
Mission still under<br />
review, not yet approved<br />
NASA airborne<br />
campaign focused on<br />
providing continuity <strong>for</strong><br />
polar ice study users<br />
Mission still under<br />
review, not yet approved<br />
Mission still under<br />
review, not yet approved<br />
NASA does have a number <strong>of</strong> mission concepts under review—ASCENDS, ACE, 3D WINDS—directed<br />
toward the study <strong>of</strong> atmospheric winds, aerosols, CO 2 , etc., but these are scheduled <strong>for</strong> launch beyond 2020,<br />
at the earliest.<br />
The ESA ATLID sensor, planned <strong>for</strong> launch on the ESA-JAXA <strong>Earth</strong>CARE mission in October 2013, may<br />
provide a continuity option <strong>for</strong> the aerosol studies currently undertaken by CALIPSO.<br />
An apparent one-<strong>of</strong>f mission, the ALADIN instrument is approved to be flown on ADM-Aeolus (ESA) in<br />
November 2013. The mission will provide wind pr<strong>of</strong>ile measurements <strong>for</strong> global 3D wind field products<br />
used in the study <strong>of</strong> atmospheric dynamics, including global transport <strong>of</strong> energy, water, aerosols, and<br />
chemicals.<br />
ICESat, ICEBridge, and ICESat-II—ICESat is the most recent operational, satellite-based Lidar suited <strong>for</strong> land<br />
measurements. The mission, however, ended in August 2010. NASA has implemented an airborne program<br />
called ICEBridge, which is designed to continue critical ice sheet measurements in the period between active<br />
satellite missions. The ICESat-II mission is considered, but not yet approved.<br />
5.2.9 Ocean Colour<br />
Ocean Colour instruments were identified as essential to six <strong>of</strong> the 56 projects surveyed. While included<br />
earlier in this report in their more generic category <strong>of</strong> Low Resolution Optical sensors, several researchers<br />
noted that MODIS (Aqua and Terra) and MERIS (Envisat) have sufficient spectral in<strong>for</strong>mation <strong>for</strong> use in<br />
Ocean Colour applications. Ocean Colour in<strong>for</strong>mation is also available from the OCM instrument on the<br />
ISRO OCEANSAT-2 mission.<br />
<strong>Continuity</strong> <strong>of</strong> <strong>Earth</strong> <strong>Observation</strong> <strong>Data</strong> <strong>for</strong> <strong>Australia</strong>: R&D • January 2012 97
The most widely used current Ocean Colour instruments, MODIS and MERIS, are well beyond their design<br />
life times, but are expected to be continued in operation in the short-term, in order to provide crosscalibration<br />
opportunities <strong>for</strong> VIIRS and Sentinel-3 (see Table 5-9).<br />
MODIS heritage will be continued with the launch <strong>of</strong> VIIRS (see Section 5.2.1). There is concern amongst<br />
some <strong>of</strong> the surveyed users that VIIRS, which was launched on NPP in October 2011, may not fully satisfy<br />
the needs <strong>of</strong> the Ocean Colour community, although its increased spatial resolution <strong>of</strong> 750 m is welcomed.<br />
<strong>Continuity</strong> is expected, however, assuming no delays to JPSS-1.<br />
The Sentinel-3A mission is approved <strong>for</strong> launch in November 2013, with continuity assured by Sentinel-3B<br />
(2014) and beyond, although funding issues <strong>for</strong> the operation <strong>of</strong> the Sentinel missions is yet to be resolved.<br />
This makes the OLCI instrument a likely continuity option <strong>for</strong> MERIS. Prospects are good <strong>for</strong> a free and<br />
open data access policy by ESA/EC <strong>for</strong> this data type.<br />
OCM was launched on OCEANSAT-2 in 2009, and is expected to last until late 2014. <strong>Research</strong>ers<br />
contributing to the present survey indicated that while OCM was fundamentally a quality instrument,<br />
there were currently significant issues with calibration and validation <strong>of</strong> the data. Korea’s GOCI is currently<br />
operational, and producing good data but is focused on the Korean peninsula and does not currently cover<br />
<strong>Australia</strong>. The GCOM-C1 JAXA mission has been approved <strong>for</strong> launch in february 2014, with two followon<br />
missions planned—GCOM-C2 in 2018, and GCOM-C3 in 2022. This makes the SGLI instrument a<br />
strong continuity option. JAXA has a heritage in Ocean Colour instrumentation with OCtS and GLi.<br />
NOAA will be the USA’s long term provider <strong>of</strong> VIIRS data that will provide continuity in the SeaWiFS-<br />
MODiS data streams (although with a more limited spectral band set than MODiS). ESA and JAXA will<br />
be the providers <strong>of</strong> the two long-term and high-quality sources <strong>of</strong> Ocean Colour data, Sentinel-3 and<br />
GCOM-C respectively. ISRO continues to operate the OCEANSAT series and this has potential as a<br />
sustained data source, assuming data quality issues can be addressed.<br />
Table 5-10 <strong>Data</strong> <strong>Continuity</strong> Options: Ocean Colour<br />
Current Sensor Expected End <strong>of</strong> Life Possible Substitute Expected Availability Comments<br />
MODIS<br />
(Aqua & Terra)<br />
MERIS<br />
(Envisat)<br />
OCM<br />
(OCEANSAT-2)<br />
Sept 2013<br />
VIIRS<br />
(NPP & JPSS)<br />
Dec 2013 OLCI (Sentinel-3)<br />
Current<br />
98 <strong>Continuity</strong> <strong>of</strong> <strong>Earth</strong> <strong>Observation</strong> <strong>Data</strong> <strong>for</strong> <strong>Australia</strong>: R&D • January 2012<br />
Early 2012<br />
(Oct 2011 launch with<br />
follow-ons planned in<br />
2017 and 2023)<br />
SGLI (GCOM-C) Feb 2014<br />
OCM<br />
(Oceansat-3 & -3a)<br />
Early 2014<br />
(Nov 2013 launch)<br />
2014<br />
Some concern that<br />
the instrument<br />
does not have the<br />
technical capabilities<br />
to meet ocean colour<br />
community needs<br />
Follows on from<br />
ADEOS-II GLI<br />
Strong continuity and<br />
open data policy<br />
<strong>Continuity</strong> <strong>of</strong> this<br />
dataset is planned.<br />
<strong>Data</strong> access uncertain.
5.3 Summary<br />
EO DATA AVAILABILITY<br />
The continuity risk to the main EO satellite data supply sources utilised by researchers responding to<br />
this survey is summarised in Table 5-11 <strong>for</strong> each <strong>of</strong> the nine Priority <strong>Data</strong> Types. The table also briefly<br />
indicates the current and future key providers <strong>of</strong> each data type, based on known programs and plans. The<br />
predominant latency requirement <strong>for</strong> each data type based on survey results is also indicated.<br />
Priority EO <strong>Data</strong> Type<br />
Optical – Low<br />
Resolution<br />
Optical – Medium<br />
Resolution<br />
Optical – High<br />
Resolution<br />
Table 5-11 Priority <strong>Data</strong> Types: Satellite 5-Year Supply <strong>Continuity</strong> Risk and Key Providers<br />
5-year<br />
continuity<br />
risk<br />
Low<br />
Current key providers<br />
(and missions)<br />
NASA (MODIS)<br />
NOAA/EUMETSAT (AVHRR)<br />
JMA (MtSAt series)<br />
High USGS (Landsat-5/-7)<br />
Low<br />
SAR – C-band Low<br />
SAR – L-band<br />
No current<br />
supply<br />
SAR – X-band Low<br />
Passive Microwave<br />
Radiometry<br />
Medium<br />
Radar Altimetry Medium<br />
Hyperspectral<br />
Imagery<br />
USA commercial providers<br />
(Worldview, GeoEye)<br />
Airborne operators<br />
ESA (Envisat)<br />
CSA (Radarsat)<br />
-<br />
ASI (COSMO-SkyMed)<br />
DLR (terraSAR-X)<br />
NASA (Aqua – just concluded)<br />
NOAA/DoD (DMSP series)<br />
JAXA/NASA (tRMM)<br />
ESA (SMOS)<br />
EUMEtSAt-NOAA (Jason series)<br />
ESA (Envisat)<br />
High NASA (EO-1)<br />
Future key providers<br />
(and missions)<br />
ESA/EC (Sentinel-3 series)<br />
NOAA (NPP/JPSS series)<br />
JAXA (GCOM-C series)<br />
JMA (MtSAt series)<br />
USGS (LDCM)<br />
ESA/EC (Sentinel-2 series)<br />
USA & European commercial<br />
providers<br />
(Worldview, GeoEye, Pleiades)<br />
Airborne operators<br />
ESA/EC (Sentinel-1 series)<br />
CSA (Radarsat & RCM)<br />
CONAE-ASI (SAOCOM-1A)<br />
JAXA (ALOS-2)<br />
ASI (COSMO-SkyMed series)<br />
DLR (terraSAR-X series)<br />
JAXA/NASA (GCOM-W series)<br />
NASA (GPM, Aquarius, SMAP)<br />
NOAA/DoD (DMSP series)<br />
ESA (SMOS)<br />
ISRO (Megha-Tropiques,<br />
RISAT-3)<br />
EUMEtSAt-NOAA (Jason series)<br />
ESA/EC (Sentinel-3 series)<br />
DLR (EnMAP)<br />
ASI (PRISMA)<br />
MEti/JAXA (ALOS-3)<br />
Predominant<br />
Latency<br />
Requirement<br />
Hours/Weeks<br />
Days/Weeks<br />
Days/Weeks<br />
Weeks<br />
Weeks<br />
Weeks<br />
Hours<br />
Hours<br />
Weeks<br />
Lidar High NASA (CALIPSO) ESA/JAXA (<strong>Earth</strong>CARE) Weeks<br />
Ocean Colour Low<br />
ESA (MERIS)<br />
NASA (MODIS)<br />
ISRO (OCEANSAT)<br />
ESA/EC (Sentinel-3 series)<br />
JAXA (GCOM-C series)<br />
ISRO (OCEANSAT)<br />
NOAA (NPP/JPSS series)<br />
The following summary conclusions are noted from Table 5.11 and the underlying in<strong>for</strong>mation in<br />
this section:<br />
1. Traditionally, <strong>Australia</strong> has a high dependence on US satellite data. Most <strong>of</strong> the anticipated gaps in<br />
the Priority <strong>Data</strong> Types identified will result from the retirement <strong>of</strong> ageing US satellites.<br />
2. USGS, although mentioned only in the context <strong>of</strong> the Landsat series and management <strong>of</strong> several<br />
civilian US EO data archives, will continue to be regarded as a key provider, given the importance <strong>of</strong><br />
that data in <strong>Australia</strong>n R&D (although other Medium Resolution Optical data sources are likely to<br />
exist in future). Landsat-5 data acquisitions have been suspended as <strong>of</strong> November 2011 as USGS<br />
attempts to address a significant technical problem, increasing the likelihood <strong>of</strong> an imminent data<br />
gap <strong>for</strong> Medium Resolution Optical data.<br />
Hours<br />
<strong>Continuity</strong> <strong>of</strong> <strong>Earth</strong> <strong>Observation</strong> <strong>Data</strong> <strong>for</strong> <strong>Australia</strong>: R&D • January 2012 99
3. NASA has long been the most important supplier <strong>of</strong> EO satellite data in support <strong>of</strong> the <strong>Australia</strong>n<br />
R&D needs surveyed (largely thanks to its free and open data policy, and direct broadcast <strong>of</strong> data<br />
into <strong>Australia</strong>n satellite stations). NASA is cited as a key current supplier six times in Table 5-11,<br />
across five different data types. In the list <strong>of</strong> key future data providers, NASA is only cited in a single<br />
category (Passive Microwave Radiometry data type) with GCOM-W (a JAXA mission) and GPM (a<br />
NASA-led international mission).<br />
4. Provided that data access terms are favourable and the current GMES funding issues are resolved,<br />
<strong>Australia</strong>’s relationship with ESA could potentially become very important <strong>for</strong> provision <strong>of</strong><br />
EO satellite data <strong>for</strong> R&D needs in <strong>Australia</strong> in the next five years. ESA is identified as being a<br />
key current supplier <strong>for</strong> four data types. It is a key future supplier <strong>for</strong> seven data types (<strong>of</strong>ten<br />
in partnership with the EC), largely due to the GMES program and the five series <strong>of</strong> Sentinel<br />
satellite missions.<br />
5. JAXA is expected to be an important partner in the future supply <strong>of</strong> EO data to <strong>Australia</strong>. JAXA is<br />
cited as a potential future supplier <strong>for</strong> six <strong>of</strong> the Priority <strong>Data</strong> Types. The data policy uncertainties in<br />
Japan <strong>for</strong> large volumes <strong>of</strong> data from land-imaging satellites such as the ALOS series will there<strong>for</strong>e<br />
continue to be a risk to the <strong>Australia</strong>n terrestrial research community <strong>of</strong> practice. It is assumed<br />
that all but High Resolution Optical images <strong>of</strong> land surfaces will continue to be freely available, and<br />
that some free access to High and Medium Resolution Optical data would be still available under<br />
collaborative R&D arrangements (e.g. via JAXA’s Kyoto Carbon initiative).<br />
6. ASi is cited as a potential future provider in three different data types (X-band SAR, Hyperspectral<br />
imagery, and L-band SAR as a CONAE partner), although these are mainly commercial.<br />
7. DLR is a potential future provider <strong>for</strong> X-band SAR and Hyperspectral imagery data types.<br />
8. ISRO missions may become more accessible and usable by <strong>Australia</strong>n researchers in the future. It<br />
is cited as a possible supplier <strong>for</strong> Ocean Colour data (OCEANSAT series) and <strong>for</strong> Microwave data<br />
from Megha-Tropiques (launched October 2011).<br />
9. China does not feature significantly in the future supplier table, simply due to a lack <strong>of</strong> in<strong>for</strong>mation<br />
and heritage among <strong>Australia</strong>n researchers utilising data from Chinese satellites. While there is<br />
uncertainty as to data policy and data access systems, Chinese agencies are planning to launch<br />
dozens <strong>of</strong> missions in coming years, some <strong>of</strong> these jointly with Brazil, spanning all or most <strong>of</strong> the<br />
Priority <strong>Data</strong> Types required <strong>for</strong> <strong>Australia</strong>n research. The possibility <strong>of</strong> access to the data streams<br />
from these missions should not be overlooked.<br />
100 <strong>Continuity</strong> <strong>of</strong> <strong>Earth</strong> <strong>Observation</strong> <strong>Data</strong> <strong>for</strong> <strong>Australia</strong>: R&D • January 2012
6 PRIORITIES FOR ACTION<br />
6.1 Major <strong>Data</strong> <strong>Continuity</strong> Risks<br />
PRIORITIES FOR ACTION<br />
As discussed in previous sections, the risk <strong>of</strong> EO data gaps are high <strong>for</strong> several Priority <strong>Data</strong> Types, namely<br />
Medium Resolution Optical, L-band SAR, Hyperspectral and Lidar. From this group, the recent malfunction <strong>of</strong><br />
Landsat-5 and the current gap in L-band SAR data both warrant close attention. In addition, the widespread<br />
reliance on the ageing MODIS sensor, and little preparatory work amongst R&D teams on alternatives such<br />
as VIIRS and Sentinel-1, merits further consideration. The implications <strong>of</strong> these potential data continuity risks<br />
on current EO-related R&D in <strong>Australia</strong> were discussed in Section 5.2.<br />
When addressing alternatives to avoid future data gaps, a combination <strong>of</strong> favourable technical characteristics,<br />
coverage, distribution systems and data access policies are all needed to satisfy the needs <strong>of</strong> the <strong>Australia</strong>n<br />
EO R&D community. Additionally, it must be stressed that the migration <strong>of</strong> research or operational<br />
procedures from one EO data source to another, or source shifting, is both expensive and time-consuming;<br />
the overheads involved in understanding, calibrating and validating, and adapting processing and analysis<br />
systems <strong>for</strong> each new data source make researchers unlikely to change data sources readily or frequently,<br />
and this must be recognised as a major influence on usage patterns.<br />
The overall cost <strong>of</strong> a critical EO data gap to the <strong>Australia</strong>n economy, including any consequent source<br />
shifting, has been estimated at more than $100 million with increasing costs <strong>for</strong> longer data gaps (ACIL<br />
Tasman, 2010). This estimate encompasses:<br />
• Costs associated with source shifting—should alternative datasets be available;<br />
• Selective use <strong>of</strong> commercial data in place <strong>of</strong> open access data;<br />
• Potential under-utilisation <strong>of</strong> government resources if alternative data is not available.<br />
Should no alternative data sources be available or af<strong>for</strong>dable, EO data gaps could disrupt several critical<br />
operational programs, including legislative monitoring and emergency management, and delay the<br />
development and implementation <strong>of</strong> multiple research outcomes.<br />
6.2 Priorities <strong>for</strong> Action<br />
The CEODA-Ops Report discussed five investment areas (or ‘Priorities <strong>for</strong> Action’) that support the EOS<br />
data supply chain in <strong>Australia</strong>. These areas were determined as the collective opinion <strong>of</strong> GA, CSIRO, BoM<br />
and DIGO (<strong>Australia</strong>n Government, 2011):<br />
• Coordination and Cooperation—governance structures to encourage collaboration, and<br />
coordinate EO data access;<br />
• Securing Future <strong>Earth</strong> <strong>Observation</strong>s—ensuring access to international public good EO sources and<br />
efficient use <strong>of</strong> commercial capabilities, through co-investment where necessary;<br />
• Investment in Ground Infrastructure and Communications—strategic planning <strong>for</strong> EO data<br />
reception and distribution, with minimum latency;<br />
• Extracting Value—systems <strong>for</strong> data processing, scientific analysis and in<strong>for</strong>mation delivery, including<br />
Cal/Val activities; and<br />
• Sustained Capability to Deliver—investment in <strong>Australia</strong>n EOS skills to ensure ongoing capability to<br />
process, calibrate, interpret and apply EOS data streams.<br />
The findings <strong>of</strong> the CEODA-R&D survey will be discussed in terms <strong>of</strong> these five investment areas.<br />
<strong>Continuity</strong> <strong>of</strong> <strong>Earth</strong> <strong>Observation</strong> <strong>Data</strong> <strong>for</strong> <strong>Australia</strong>: R&D • January 2012 101
6.2.1 Coordination and Cooperation<br />
The <strong>Australia</strong>n EO sector has largely developed as a synergistic community, with 95% <strong>of</strong> researchers<br />
surveyed through the CEODA-R&D study being actively involved in collaboration with domestic and/or<br />
international organisations. The current extent <strong>of</strong> domestic interaction (see Section 2.3.5) not only ensures<br />
efficient use <strong>of</strong> local resources and maximum benefit from available expertise, but also underpins <strong>Australia</strong>’s<br />
strength in the international EO scene. Collaborative facilities such as IMOS and TERN have further<br />
streamlined the acquisition, standardisation and dissemination <strong>of</strong> EO-related data and skills, and this trend<br />
should be supported and extended to other EO applications areas.<br />
As the EO data type most used by <strong>Australia</strong>n researchers, Low Resolution Optical data are being acquired<br />
concurrently by several R&D centres, predominantly from the on-line MODIS and AVHRRR archives, and via<br />
the <strong>Australia</strong>n national facilities <strong>for</strong> direct broadcast reception and redistribution. The opportunity exists to<br />
rationalise these replicated access ef<strong>for</strong>ts with a more efficient infrastructure <strong>for</strong> the reception, processing<br />
and distribution <strong>of</strong> commonly used datasets like the MODIS 16-day composites. The national processing<br />
facility <strong>for</strong> MODIS/AVHRR/VIIRS data is a significant step in this direction. Given that <strong>Australia</strong> does not<br />
contribute to the funding <strong>of</strong> any <strong>of</strong> these satellite systems even though it is amongst the world’s heaviest<br />
users, a more coordinated approach to data acquisition would also minimise <strong>Australia</strong>’s impact on the<br />
provider agency systems.<br />
While the <strong>Australia</strong>n EO R&D community is technically very strong, it requires more serious institutional<br />
support to help maintain international linkages to collaborators, and have more active participation in<br />
international initiatives such as those <strong>of</strong> the Committee on <strong>Earth</strong> <strong>Observation</strong> Satellites (CEOS) and the<br />
Group on <strong>Earth</strong> <strong>Observation</strong>s (GEO), and involvement at the science team level in the development <strong>of</strong><br />
new satellite technology in order to tailor systems/products to suit <strong>Australia</strong>n requirements. Such support<br />
would permit continued development <strong>of</strong> innovative applications <strong>for</strong> EO data, and also maintain access to key<br />
EO datasets, which is not always provided through operational government programs.<br />
6.2.2 Securing Future <strong>Earth</strong> <strong>Observation</strong>s<br />
<strong>Australia</strong> has no EO satellite capability <strong>of</strong> its own. It has contributed sub-systems to important payloads,<br />
notably the AATSR instrument <strong>of</strong> Envisat, in the past, and is currently contributing hardware to NASA’s<br />
GRACE Follow-on mission. EO data usage in <strong>Australia</strong> is characterised by a preference <strong>for</strong> sources that are<br />
freely available from <strong>for</strong>eign providers.<br />
The <strong>Australia</strong>n EO R&D sector has discovered efficient ways to access key EO datasets, <strong>of</strong>ten via strategic<br />
relationships established by individuals with overseas science collaborators or space agencies. More than 40<br />
different satellites are identified as necessary <strong>for</strong> data supply continuity across the nine Priority <strong>Data</strong> Types<br />
<strong>for</strong> <strong>Australia</strong>n researchers. ESA and JAXA are important potential future EOS data suppliers across a large<br />
number <strong>of</strong> the Priority <strong>Data</strong> Types. The current data supply continuity outlook <strong>for</strong> many EOS missions is<br />
dependent on ad hoc relationships between different individual <strong>Australia</strong>n researchers and/or agencies. To<br />
increase access and adoption <strong>of</strong> more advanced next generation EO data streams, it would be advisable<br />
that stronger inter-institutional data agreements with key data providers be established at the Federal<br />
government level, as well as guaranteed access to bandwidth, and time allocation <strong>for</strong> use <strong>of</strong> current satellite<br />
downlink infrastructure <strong>for</strong> these science missions. The need <strong>for</strong> a national negotiating position may be<br />
exacerbated in future if the main EO data supply agencies continue their trend towards centralised Internetbased<br />
data distribution systems that may not meet <strong>Australia</strong>n latency requirements. Local support <strong>for</strong><br />
<strong>Australia</strong>n membership <strong>of</strong> international EO mission science teams, which is <strong>of</strong>ten locally unfunded, would be<br />
a basis <strong>for</strong> a clearer <strong>Australia</strong>n contribution to international ef<strong>for</strong>ts.<br />
A number <strong>of</strong> CEODA-R&D survey respondents commented that the expectation <strong>of</strong> continued goodwill<br />
through (typically) free supply <strong>of</strong> data from 59 different satellite instruments provided by other countries is a<br />
high risk strategy, particularly considering the current economic positions <strong>of</strong> some <strong>of</strong> these countries relative<br />
to <strong>Australia</strong>.<br />
102 <strong>Continuity</strong> <strong>of</strong> <strong>Earth</strong> <strong>Observation</strong> <strong>Data</strong> <strong>for</strong> <strong>Australia</strong>: R&D • January 2012
PRIORITIES FOR ACTION<br />
Some survey respondents advocated that <strong>Australia</strong> should make an increased and visible contribution to<br />
the space segments <strong>of</strong> the EO capabilities on which we depend as a nation. This could take the <strong>for</strong>m <strong>of</strong><br />
an instrument contribution to the increasing number <strong>of</strong> virtual constellations (coordinated but separate<br />
observing missions <strong>of</strong> several countries), or co-investment in a collaborative international mission.<br />
Furthermore, high altitude unmanned aerial plat<strong>for</strong>ms may also be considered as an alternative option <strong>for</strong><br />
acquiring critical EO data.<br />
The trend towards international virtual constellations <strong>of</strong> spacecraft towards a particular measurement<br />
objective represents a cost-effective opportunity <strong>for</strong> <strong>Australia</strong>n participation in a way that could<br />
secure continued goodwill and data access by the multitude <strong>of</strong> contributing partners. Many <strong>of</strong> these<br />
constellations have been emerging through the CEOS framework (e.g. Ocean Colour, Ocean Surface<br />
Topography, Precipitation) and others (such as the COSMIC GPS Radio Occultation system) are based on<br />
inter-governmental agreements between a number <strong>of</strong> countries (principally Taiwan and USA in the case<br />
<strong>of</strong> COSMIC).<br />
Three EO data types have particular importance to <strong>Australia</strong>n researchers, and warrant special<br />
consideration <strong>for</strong> potential investment:<br />
SAR<br />
The 2009 Defence White Paper (Department <strong>of</strong> Defence, 2009a) states that the Department <strong>of</strong> Defence<br />
intends to acquire a Synthetic Aperture Radar satellite. SAR data are a high priority <strong>for</strong> the <strong>Australia</strong>n<br />
research community surveyed, and there are few prospects <strong>for</strong> open access to L-band and X-band systems<br />
<strong>for</strong> the <strong>for</strong>eseeable future, with both anticipated to be commercially controlled in most (or all) cases. L-band<br />
SAR data is the most productive in support <strong>of</strong> vegetation studies, like <strong>for</strong>est and biomass mapping <strong>for</strong><br />
policy initiatives such as REDD+ or IFCI, disaster monitoring and operational programs such as the National<br />
Carbon Accounting System (NCAS). But X-band SAR data also have a role here, and the inclusion <strong>of</strong><br />
suitable wide area imaging and polarisation modes may permit, <strong>for</strong> example, wall-to-wall <strong>for</strong>est mapping as<br />
needed <strong>for</strong> national reporting activities, or mapping <strong>of</strong> damage to infrastructure or crops after severe storms<br />
or cyclones. If the proposed Defence SAR capability could include both Defence and civil applications, this<br />
would have significant benefits <strong>for</strong> the <strong>Australia</strong>n research community.<br />
C-band data may see increased future use with Sentinel-1 data (ESA/EC) and possibly the RCM data<br />
(Canada) becoming freely available from 2013.<br />
Hyperspectral<br />
The CEODA-R&D survey identified an increasing need <strong>for</strong> spectral in<strong>for</strong>mation and higher sensor quality,<br />
including Hyperspectral imagery, <strong>for</strong> quantitative material detection and mapping in key economic sectors<br />
including resource exploration, agriculture and legislated monitoring programs. <strong>Australia</strong> has a strong<br />
heritage in the manufacture and operation <strong>of</strong> airborne Hyperspectral imaging systems (e.g. the <strong>Australia</strong>n<br />
Hymap sensor), and has long considered a domestic capability in Hyperspectral imaging from space, notably<br />
the ARIES-1 mission studies in the 1990s. The 2009 Defence Capability Plan (Department <strong>of</strong> Defence,<br />
2009b) also identifies Hyperspectral capabilities as a priority <strong>for</strong> the Department <strong>of</strong> Defence, and states<br />
that there may be opportunities <strong>for</strong> collaboration with <strong>Australia</strong>n industry (assumed to include the research<br />
sector) in developing these capabilities.<br />
The first wave <strong>of</strong> Hyperspectral satellite imagers is expected to emerge from 2014, and <strong>Australia</strong>n<br />
researchers have been working closely with the various countries developing these systems (particularly<br />
the US, Germany, italy and Japan) to promote <strong>Australia</strong> as the ideal laboratory to test, calibrate and develop<br />
accurate in<strong>for</strong>mation products from these data <strong>for</strong> a variety <strong>of</strong> applications . Partnerships between <strong>Australia</strong><br />
and one or more <strong>of</strong> the leading countries in this sector would be a high priority <strong>for</strong> future space capability<br />
development, especially if a niche technology can be captured, such as Hyperspectral thermal infrared<br />
imaging technology.<br />
<strong>Continuity</strong> <strong>of</strong> <strong>Earth</strong> <strong>Observation</strong> <strong>Data</strong> <strong>for</strong> <strong>Australia</strong>: R&D • January 2012 103
Short Wave and Thermal Infrared<br />
Both short wave and thermal infrared (SWIR and TIR) multi-spectral data from Low Resolution Optical<br />
sources such as MODIS, AVHRR and AATSR are important <strong>for</strong> broad-area monitoring <strong>of</strong> sea and land<br />
surface temperature, as well as in support <strong>of</strong> vegetation and other land surface studies which feed into<br />
modelling <strong>of</strong> groundcover, climate and evapotranspiration. Thermal spectroscopy data from Hyperspectral<br />
imagers is important <strong>for</strong> mineral mapping. The first ‘geoscience-tuned’ EO system capable <strong>of</strong> mapping land<br />
surface composition, especially its mineral content, was the Japanese AStER sensor with multi-spectral<br />
coverage at SWIR and TIR wavelengths. <strong>Australia</strong> was the first to develop national geoscience maps from<br />
these data.<br />
There is concern that the most-used EO instruments, MODIS and Landsat-7 ETM+, will lose SWIR and<br />
TIR capabilities in the next generation <strong>of</strong> satellites, and there are no plans to develop a follow-on ASTER<br />
instrument. To date, the only Hyperspectral satellite SWIR imaging sensor is the US Hyperion, which was not<br />
designed <strong>for</strong> operational use. There are no satellite TIR imaging sensors currently collecting moderate to high<br />
spatial resolution imagery. Thus, the future data supply <strong>for</strong> SWIR and TIR data is uncertain, and the current<br />
usage <strong>of</strong> these data warrants attention at the national level to ensure security <strong>of</strong> supply.<br />
6.2.3 Investment in Ground Infrastructure and Communications<br />
The most common supply channel <strong>for</strong> EO data used by <strong>Australia</strong>n researchers is the Internet. <strong>Research</strong>ers<br />
typically utilise the servers <strong>of</strong> the supply agencies (e.g. NASA, USGS) or their data processing partners to<br />
secure their routine data needs.<br />
Landsat-8 (LDCM) is known to be moving towards a centralised data architecture, with less dependence on<br />
overseas ground stations, and a central on-line repository at the USGS-operated EROS <strong>Data</strong> Centre. The<br />
GMES Sentinel series data architecture is not fully defined but is likely to follow a similar model. Further, the<br />
distributed ALOS <strong>Data</strong> Node concept, which involved local downlink and processing in <strong>Australia</strong> (at GA),<br />
will not be repeated and JAXA is understood to be moving towards a centralised data distribution model. in<br />
combination, these missions are likely to represent the majority <strong>of</strong> data usage by <strong>Australia</strong>n researchers and<br />
will have major implications <strong>for</strong> the routes through which data flows.<br />
BoM has indicated that the next generation <strong>of</strong> geostationary meteorological satellites <strong>of</strong> Japan will also<br />
distribute data by Internet only. Himawari-8 data volumes are estimated to be 50 TB/annum based on<br />
current specifications, compared with ~0.6 TB/annum from the current MTSAT missions. BoM’s Internet<br />
will need to be capable <strong>of</strong> 13 Mbits/s sustained by 2015, in order to transfer data from JMA to BoM every<br />
10 minutes.<br />
This trend will be compounded if there is a continued move to higher spatial and spectral resolution data<br />
(as indicated by the survey), including High Resolution Optical, Hyperspectral and Lidar data types. In the<br />
next five years, however, the majority <strong>of</strong> Hyperspectral and Lidar data needs will continue to be satisfied by<br />
airborne supply sources.<br />
Some researchers noted the current distortion in data flows resulting from the way in which Internet<br />
bandwidth is paid <strong>for</strong> by State Governments, but not by researchers who are using academic networks.<br />
Relationships between the Governments and the researchers are being exploited to route data through<br />
academic networks and then to physically ship data <strong>for</strong> the final stage <strong>of</strong> the journey to the State user.<br />
Seven <strong>of</strong> the R&D projects surveyed that now use large volumes <strong>of</strong> EO data collectively acquire around<br />
29 TB per year. With data volumes expected to double annually, in 2016 these seven projects could be<br />
acquiring close to 1 PB each year. If researchers access the same datasets independently and in parallel, there<br />
will be significant inefficiencies in the use <strong>of</strong> international network bandwidth. Moves towards centralised<br />
data access and archiving in <strong>Australia</strong> would greatly reduce these inefficiencies. The move to Internet-based<br />
supply models has significant implications <strong>for</strong> national data networks and computing infrastructure with<br />
regard to data transmission, storage, pre-processing and provision, and will require national coordination.<br />
104 <strong>Continuity</strong> <strong>of</strong> <strong>Earth</strong> <strong>Observation</strong> <strong>Data</strong> <strong>for</strong> <strong>Australia</strong>: R&D • January 2012
PRIORITIES FOR ACTION<br />
Recent science infrastructure roadmaps have recognised the need <strong>for</strong> increased central investment into<br />
space-related and EO-related infrastructure, particularly in relation to network bandwidth, high-per<strong>for</strong>mance<br />
EO data processing and management infrastructure, Cal/Val activities, and quality assurance/control activities.<br />
The research community has expressed the need <strong>for</strong> this investment to ensure continued effective supply<br />
and management <strong>of</strong> data.<br />
6.2.4 Extracting Value<br />
Calibration and Validation<br />
As more and more applications rely on EO data <strong>for</strong> quantitative measurements <strong>of</strong> land, atmosphere and<br />
water characteristics, the need <strong>for</strong> careful calibration and data correction (<strong>for</strong> atmospheric effects, imaging<br />
directionality and topography) is increasingly critical. The trend towards legislative monitoring based on EO<br />
data will necessitate systematic, national Cal/Val programs. Topical examples <strong>of</strong> this trend from among the<br />
surveyed projects include monitoring <strong>of</strong> carbon emissions and inland water quality.<br />
National infrastructure to support radiometric Cal/Val is considered by many researchers to be a<br />
fundamental element <strong>of</strong> ensuring EO data stream quality. International links, such as involvement with global<br />
Cal/Val teams, has helped to ensure the quality <strong>of</strong> relevant data products in <strong>Australia</strong>n conditions, especially<br />
in those cases when <strong>Australia</strong> is the only contributor to such activities in the Southern Hemisphere.<br />
This was generally seen as a role <strong>for</strong> the Federal government, tied to the provision <strong>of</strong> calibrated, validated<br />
and standardised datasets, especially <strong>for</strong> optical datasets. An organisation with <strong>for</strong>mal responsibility <strong>for</strong><br />
quantifying these attributes <strong>for</strong> all EO data types in <strong>Australia</strong> would help to ensure data quality.<br />
As discussed in Section 2.3.5, <strong>Australia</strong>n scientists are active participants in the science teams <strong>for</strong> various<br />
international EO missions. This involvement is viewed as essential by many researchers, providing good<br />
leverage <strong>for</strong> <strong>Australia</strong>n users to access EO data and share Cal/Val data with other international research<br />
teams. <strong>Australia</strong>’s unique geography and position in the Southern Hemisphere makes it ideally suited <strong>for</strong> the<br />
collection <strong>of</strong> valuable Cal/Val data, including both surface and atmospheric measurements. Many researchers<br />
considered that this to be one <strong>of</strong> the most significant contributions <strong>Australia</strong> could and should continue to<br />
make to the international EO community.<br />
National EO Product Standards<br />
The MODIS model <strong>for</strong> publishing and delivering a suite <strong>of</strong> specialised in<strong>for</strong>mation products derived from<br />
calibrated radiance, reflectance, emissivity and temperature data has helped initiate the establishment<br />
<strong>of</strong> standards. Even though many MODIS products are not optimised <strong>for</strong> <strong>Australia</strong>n conditions they are<br />
readily taken up by the user community as such products are much easier to integrate. This model is now<br />
being adopted <strong>for</strong> other sensors and applications, including the National Carbon Accounting System and<br />
the <strong>Australia</strong>n ASTER geoscience map, <strong>for</strong> which the underpinning processing methods were developed<br />
in <strong>Australia</strong> and are now being extended to other regions internationally. The process <strong>for</strong> establishing<br />
national in<strong>for</strong>mation product standards is not yet established, however, and many research organisations<br />
are competing <strong>for</strong> recognition and support. The <strong>Australia</strong>n user community requires that such standards be<br />
established to improve the accuracy and useability (value) <strong>of</strong> EO data.<br />
Historical <strong>Data</strong> Archives<br />
A further key priority is the preservation, rigorous pre-processing and seamless availability <strong>of</strong> the historical<br />
archive <strong>of</strong> EO data <strong>for</strong> <strong>Australia</strong>. This consists <strong>of</strong> near-complete High Resolution (30m) Optical datasets<br />
going back to 1985 and Low Resolution Optical datasets going back to 1981, but also includes Ocean<br />
Colour and surface temperature data <strong>for</strong> the surrounding oceans. This historical archive <strong>of</strong> multi-resolution<br />
datasets is important <strong>for</strong> the establishment <strong>of</strong> environmental baselines/retrospective state, and <strong>for</strong> analysis <strong>of</strong><br />
trends, anomalies and environmental change in the presence <strong>of</strong> both climate change and variability.<br />
<strong>Continuity</strong> <strong>of</strong> <strong>Earth</strong> <strong>Observation</strong> <strong>Data</strong> <strong>for</strong> <strong>Australia</strong>: R&D • January 2012 105
The existing archive is a relatively short record, given the temporal resolution <strong>of</strong> certain events on decadal<br />
or longer timescales (e.g. cycles <strong>of</strong> drought driven by El Nino events, the subsequent influence on the<br />
occurrence <strong>of</strong> flood events, changes in ground cover and on inland and coastal water quality). The archive<br />
provides an important historical calibration <strong>for</strong> models developed <strong>for</strong> the prediction <strong>of</strong> current or future<br />
events at both the regional and continental scales, and is also important in framing rapid response (e.g. to<br />
contemporary flooding and bushfire events); <strong>for</strong> example, being able to calibrate river models on historical<br />
data <strong>for</strong> such things as flood events.<br />
6.2.5 Sustained Capability to Deliver<br />
Like many fields <strong>of</strong> <strong>Australia</strong>n science, the EO sector has a legacy <strong>of</strong> being supported by resourceful and<br />
committed scientists who are passionate about their research. This high level <strong>of</strong> commitment has enabled<br />
<strong>Australia</strong>n EO scientists to achieve international prominence with very limited resources, and to develop<br />
a wide range <strong>of</strong> EO applications that significantly benefit the nation. Without adequate <strong>of</strong>ficial support<br />
and investment, however, commitment alone is not sufficient to safeguard existing expertise, ensure its<br />
dissemination to future scientists, and maximise its benefit to <strong>Australia</strong>.<br />
Many <strong>of</strong> the research projects surveyed in the CEODA-R&D study are currently operating with minimum<br />
staffing and budgetary levels. Few areas <strong>of</strong> EO research are continuously funded, and as a consequence,<br />
these R&D activities lack continuity. Transient and/or inadequate funding has yielded inadequately<br />
documented results and high staff turnover, resulting in a loss <strong>of</strong> expertise. Several <strong>of</strong> the projects surveyed<br />
involve staff with decades <strong>of</strong> experience in EO research whose current resources do not allow them to<br />
access future data sources to extend their research. Without appropriate support to pass on their expertise,<br />
when these individual scientists leave the work<strong>for</strong>ce, much <strong>of</strong> their experience and networks will be lost.<br />
The history <strong>of</strong> remote sensing in <strong>Australia</strong> has fostered remarkable goodwill and cooperation amongst<br />
researchers and permitted the establishment <strong>of</strong> key facilities <strong>for</strong> mutual benefit. In future, however, these<br />
facilities must be strategically managed to ensure their effective operation beyond the tenure <strong>of</strong> specific<br />
individuals and their personal networks. To develop a sustained capability to deliver high quality EO products<br />
that currently make an estimated annual GDP contribution <strong>of</strong> $3.3 billion, <strong>Australia</strong> must ensure continuity<br />
<strong>of</strong> capability through strategic planning, resourcing and succession planning.<br />
6.3 Conclusions<br />
The conclusions and recommendations are presented below, structured to be consistent with the<br />
study objectives.<br />
Importance <strong>of</strong> EO data in support <strong>of</strong> R&D outcomes<br />
The CEODA-R&D survey identified 217 EO-related R&D projects in <strong>Australia</strong>, <strong>of</strong> which 187 were considered<br />
<strong>for</strong> inclusion in the survey, and ultimately 56 projects from 31 organisations were sampled in detail. The size<br />
and scope <strong>of</strong> these projects varies considerably. Altogether, the 56 projects employ 190 full-time equivalent<br />
staff and share a total annual budget <strong>of</strong> nearly $35 million.<br />
The sampled R&D projects collectively use 59 different satellite instruments that are considered to be<br />
‘essential’ to the research outcomes. Of these 59 instruments, 17 are used uniquely by CAWCR/BoM in<br />
support <strong>of</strong> their NWP and application research projects.<br />
Airborne data usage was also considered, but in less detail, with supply sources typically being specially<br />
commissioned flights or in-house systems. Since airborne image acquisition is not systematic, continuity <strong>for</strong><br />
airborne data sources cannot be predicted in the same way (although other uncertainties obviously apply to<br />
the execution <strong>of</strong> space data sources).<br />
106 <strong>Continuity</strong> <strong>of</strong> <strong>Earth</strong> <strong>Observation</strong> <strong>Data</strong> <strong>for</strong> <strong>Australia</strong>: R&D • January 2012
National significance <strong>of</strong> the R&D activity<br />
PRIORITIES FOR ACTION<br />
Apart from providing important scientific advances and innovations, the majority <strong>of</strong> surveyed projects also<br />
support a range <strong>of</strong> social, security, environmental and economic outcomes and needs within <strong>Australia</strong>. They<br />
encompass a broad range <strong>of</strong> objectives and applications. Over 70% <strong>of</strong> the surveyed projects are linked<br />
to current operational EO-dependent programs in <strong>Australia</strong>, with research results contributing to a wide<br />
range <strong>of</strong> application areas, including large area monitoring and/or modelling <strong>of</strong> environmental resources,<br />
national weather and ocean <strong>for</strong>ecasting, and emergency management. The most common societal benefit<br />
areas cited were ecosystems, agriculture, climate and water. National benefits and operational outcomes<br />
include: improved weather <strong>for</strong>ecasting and public safety; improved climate models; Antarctic monitoring and<br />
surveillance; ocean <strong>for</strong>ecasting and surveillance; national and international carbon accounting capabilities;<br />
water resource management capabilities; agricultural resource efficiency and improved productivity;<br />
improved resource exploration; disaster mitigation and response capabilities – amongst many others.<br />
<strong>Data</strong> types <strong>of</strong> special importance to the R&D sector<br />
Nine Priority <strong>Data</strong> Types, regarded as essential by <strong>Australia</strong>n researchers, were identified in Section 3.3,<br />
based upon their criticality in support <strong>of</strong> research outcomes, and their widespread usage across multiple<br />
projects. These are (in decreasing order <strong>of</strong> usage):<br />
• Low Resolution Optical;<br />
• Medium Resolution Optical;<br />
• High Resolution Optical;<br />
• SAR (C-, L- and X-band);<br />
• Passive Microwave Radiometry;<br />
• Radar Altimetry;<br />
• Hyperspectral Imagery;<br />
• Lidar; and<br />
• Ocean Colour.<br />
No weighting has been applied to account <strong>for</strong> data volumes or to suggest relative importance <strong>of</strong> one<br />
research activity over another.<br />
Of these, the Low and Medium Resolution Optical data are by far the most widely used, with Low<br />
Resolution Optical data being used by around half <strong>of</strong> the surveyed projects. SAR data sources (three bands<br />
in combination) represent the next most widely used.<br />
Survey respondents assess that these Priority <strong>Data</strong> Types will not change significantly over the next five<br />
years (see Section 4), although EO data sources with higher spatial and spectral resolutions are anticipated.<br />
Several have indicated an increasing need <strong>for</strong> Hyperspectral and Lidar data types, yet many do not expect<br />
their future requirements <strong>for</strong> these two data types to be fully met by satellite sources. The future supply<br />
scenarios outlined in Section 5 indicate that there will be few satellite missions, available on terms suitable<br />
to <strong>Australia</strong>n researchers, <strong>for</strong> these data types. It is presumed that researchers expect their requirements <strong>for</strong><br />
Hyperspectral and Lidar data to be met by airborne data sources.<br />
Supply Outlook <strong>for</strong> the Priority <strong>Data</strong> Types<br />
Section 5 documents considerable detail on future EO data supply scenarios, and explains the global supply<br />
context, prospects <strong>of</strong> each <strong>of</strong> the major supply agencies, and specifics <strong>for</strong> each <strong>of</strong> the nine Priority <strong>Data</strong><br />
Types. The summary table is repeated as Table 6-1.<br />
Of the top four Priority <strong>Data</strong> Types, there is one actual and current data gap <strong>for</strong> SAR (L-band), and a<br />
high risk <strong>of</strong> a data gap <strong>for</strong> Medium Resolution Optical data. The Landsat continuity gap is dependent on<br />
the ongoing health <strong>of</strong> Landsat-5 and Landsat-7. Landsat-5 acquisitions are currently suspended and this<br />
<strong>Continuity</strong> <strong>of</strong> <strong>Earth</strong> <strong>Observation</strong> <strong>Data</strong> <strong>for</strong> <strong>Australia</strong>: R&D • January 2012 107
could indicate the end <strong>of</strong> its 27-year life. If a data gap occurs (as seems likely), the many R&D teams (and<br />
operational programs) in <strong>Australia</strong> using this data will incur a significant cost to transition their Landsat-based<br />
algorithms and methodologies to other multi-spectral optical data. The economic impact to <strong>Australia</strong> <strong>of</strong><br />
losing access to Landsat data has been assessed as $100 million in the first year <strong>of</strong> a data gap, with a flow on<br />
effect in subsequent years <strong>for</strong> the duration <strong>of</strong> that gap (ACIL Tasman, 2010).<br />
Use <strong>of</strong> MODIS data is so widespread in <strong>Australia</strong>n R&D and government programs that a very significant<br />
financial and technical cost will be incurred when MODIS data is no longer available, estimated to be on the<br />
same scale as the costs estimated <strong>for</strong> the Landsat data gap.<br />
Numerous operational national programs and legislated monitoring activities will be severely affected by loss<br />
<strong>of</strong> Landsat and MODIS data.<br />
The L-band SAR data gap has significantly affected the <strong>Australia</strong>n R&D community, including those<br />
supporting <strong>for</strong>est carbon and vegetation studies using radar.<br />
Of the remaining five Priority <strong>Data</strong> Types, only one (Ocean Colour) might safely be described as having a<br />
low risk to data continuity in the next five years.<br />
Priority EO <strong>Data</strong><br />
Type<br />
Optical: Low<br />
Resolution<br />
Optical: Medium<br />
Resolution<br />
Optical: High<br />
Resolution<br />
Table 6-1 Priority <strong>Data</strong> Types: Satellite 5-Year Supply <strong>Continuity</strong> Risk and Key Providers<br />
5-year<br />
continuity<br />
risk<br />
Low<br />
Current key providers<br />
(and missions)<br />
NASA (MODIS)<br />
NOAA/EUMETSAT (AVHRR)<br />
JMA (MtSAt series)<br />
High USGS (Landsat-5/-7)<br />
Low<br />
SAR: C-band Low<br />
SAR: L-band<br />
No current<br />
supply<br />
SAR: X-band Low<br />
Passive Microwave<br />
Radiometry<br />
Medium<br />
Radar Altimetry Medium<br />
Hyperspectral<br />
Imagery<br />
USA commercial providers<br />
(Worldview, GeoEye)<br />
ESA (Envisat)<br />
CSA (Radarsat)<br />
108 <strong>Continuity</strong> <strong>of</strong> <strong>Earth</strong> <strong>Observation</strong> <strong>Data</strong> <strong>for</strong> <strong>Australia</strong>: R&D • January 2012<br />
-<br />
ASI (COSMO-SkyMed)<br />
DLR (terraSAR-X)<br />
NASA (Aqua – just concluded)<br />
NOAA/DoD (DMSP series)<br />
JAXA/NASA (tRMM)<br />
ESA (SMOS)<br />
EUMEtSAt-NOAA (Jason series)<br />
ESA (Envisat)<br />
High NASA (EO-1)<br />
Future key providers<br />
(and missions)<br />
ESA/EC (Sentinel-3 series)<br />
NOAA (NPP/JPSS series)<br />
JAXA (GCOM-C series)<br />
JMA (MtSAt series)<br />
USGS (LDCM)<br />
ESA/EC (Sentinel-2 series)<br />
USA & European commercial<br />
providers<br />
(Worldview, GeoEye, Pleiades)<br />
Airborne operators<br />
ESA/EC (Sentinel-1 series)<br />
CSA (Radarsat & RCM)<br />
CONAE-ASI (SAOCOM-1A)<br />
JAXA (ALOS-2)<br />
ASI (COSMO-SkyMed series)<br />
DLR (terraSAR-X series)<br />
JAXA/NASA (GCOM-W series)<br />
NASA (GPM, Aquarius, SMAP)<br />
NOAA/DoD (DMSP series)<br />
ESA (SMOS)<br />
ISRO (Megha-Tropiques,<br />
RISAT-3)<br />
EUMEtSAt-NOAA (Jason series)<br />
ESA/EC (Sentinel-3 series)<br />
DLR (EnMAP)<br />
ASI (PRISMA)<br />
MEti/JAXA (ALOS-3)<br />
Predominant<br />
Latency<br />
Requirement<br />
Hours/Weeks<br />
Days/Weeks<br />
Days/Weeks<br />
Weeks<br />
Weeks<br />
Weeks<br />
Hours<br />
Hours<br />
Weeks<br />
Lidar High NASA (CALIPSO) ESA/JAXA (<strong>Earth</strong>CARE) Weeks<br />
Ocean Colour Low<br />
ESA (MERIS)<br />
NASA (MODIS)<br />
ISRO (OCEANSAT)<br />
ESA/EC (Sentinel-3 series)<br />
JAXA (GCOM-C series)<br />
ISRO (OCEANSAT)<br />
NOAA (NPP/JPSS series)<br />
Hours
Critical relationships <strong>for</strong> EO data supply continuity<br />
PRIORITIES FOR ACTION<br />
NASA has been the single most important supplier <strong>of</strong> EO satellite data in support <strong>of</strong> <strong>Australia</strong>n R&D needs<br />
over the last decades, but the future supply prospects <strong>for</strong> the Priority <strong>Data</strong> Types identified suggest that a<br />
larger number <strong>of</strong> suppliers will become important to <strong>Australia</strong> over the coming years. This has implications<br />
<strong>for</strong> both the planning and prioritisation <strong>of</strong> key relationships and infrastructure in support <strong>of</strong> these supply<br />
arrangements.<br />
ESA could emerge as an important provider <strong>of</strong> EO satellite data <strong>for</strong> R&D needs in <strong>Australia</strong>, provided that<br />
GMES funding issues are resolved and the data access terms are favourable. ESA (and in some cases the<br />
EC) is identified as a possible future supplier <strong>for</strong> up to seven Priority <strong>Data</strong> Types data types, based on data<br />
from the GMES program and the five series <strong>of</strong> Sentinel satellite missions. A <strong>for</strong>mal data sharing agreement<br />
with ESA is considered to be a high national priority.<br />
JAXA is anticipated to be an important partner in the future supply <strong>of</strong> EO data to <strong>Australia</strong> (and data from<br />
the geostationary meteorological missions <strong>of</strong> Japan continues to be critical <strong>for</strong> both <strong>Australia</strong>n research and<br />
operations). USGS (Landsat), ASi (X-band SAR, Hyperspectral imagery and L-band SAR), DLR (X-band<br />
SAR and Hyperspectral imagery), and ISRO (Ocean Colour data and Passive Microwave data) will also be<br />
important data supply partners. Additionally, Chinese agencies are planning many EO missions in future<br />
years, which could become supply sources <strong>for</strong> <strong>Australia</strong>.<br />
Given the significant and extended interest within <strong>Australia</strong> in the potential <strong>of</strong> Hyperspectral imagery from<br />
space, and the known disposition <strong>of</strong> DLR with regard to supplying data from EnMap <strong>for</strong> research purposes, a<br />
<strong>for</strong>mal agreement with DLR on Hyperspectral data supply is proposed to be another national priority.<br />
More than 40 different satellites are identified as necessary <strong>for</strong> the continuity <strong>of</strong> data supply across the nine<br />
Priority <strong>Data</strong> Types <strong>for</strong> <strong>Australia</strong>n researchers.<br />
Greater involvement with key international coordination bodies, such as CEOS and GEO, could help to<br />
compensate <strong>for</strong> the <strong>Australia</strong>n tradition <strong>of</strong> depending on goodwill from international EO data suppliers.<br />
Infrastructure implications<br />
The most common supply channel <strong>for</strong> EO data used by <strong>Australia</strong>n researchers is the Internet, with<br />
the majority <strong>of</strong> data being derived from international sources. As more suppliers use this avenue <strong>of</strong><br />
dissemination, and data volumes increase (the survey suggested an increase <strong>of</strong> two to ten times current<br />
data volumes is expected over the next five years – more in some domains), efficient on-line access<br />
will be critical to minimise both cost and latency. This has significant implications <strong>for</strong> national computing<br />
infrastructure both in data storage and provision, and will require national coordination.<br />
The need <strong>for</strong> careful, systematic calibration and validation (Cal/Val) <strong>of</strong> EOS datasets is urgently needed to<br />
support the growing number <strong>of</strong> operational programs relying on these data, especially in areas <strong>of</strong> legislative<br />
monitoring. A national infrastructure to support radiometric Cal/Val is considered by many researchers to<br />
be a fundamental element in ensuring EO data stream quality. It is also considered to be one <strong>of</strong> the major<br />
contributions that <strong>Australia</strong> could and should make to the international EO community.<br />
SAR data and Hyperspectral imagery were both identified as future priority data types <strong>for</strong> the R&D<br />
community. In the short term, future missions, such as Sentinel-1 and -2 (ESA/EC, May 2013) and EnMap<br />
(DLR, Apr 2015) <strong>of</strong>fer significant opportunities <strong>for</strong> available data streams <strong>of</strong> high value to the research<br />
community. Adequate planning <strong>for</strong> the reception, processing, archiving and distribution <strong>of</strong> these specialist<br />
data types will be essential if maximum national benefit is to be derived.<br />
<strong>Continuity</strong> <strong>of</strong> <strong>Earth</strong> <strong>Observation</strong> <strong>Data</strong> <strong>for</strong> <strong>Australia</strong>: R&D • January 2012 109
Sustaining capacity<br />
The international prominence <strong>of</strong> <strong>Australia</strong>n R&D achievements in EO is founded on the outstanding<br />
commitment <strong>of</strong> a relatively small number <strong>of</strong> resourceful, and <strong>of</strong>ten under-resourced, scientists. With the<br />
first generation <strong>of</strong> EO scientists reaching retirement, <strong>Australia</strong> is poised to lose decades <strong>of</strong> undocumented<br />
experience and numerous international connections. Similarly, the history <strong>of</strong> EO in <strong>Australia</strong> has fostered a<br />
unique level <strong>of</strong> goodwill and cooperation in many areas, including data management. Such functions have<br />
readily become dependent on generous individuals rather than adequately resourced facilities.<br />
6.4 Recommendations<br />
1. A <strong>for</strong>mal coordinated national strategy to ensure continuity <strong>of</strong> supply <strong>for</strong> the Priority <strong>Data</strong><br />
Types identified, particularly Medium Resolution Optical data, is strongly recommended as a<br />
matter <strong>of</strong> priority, both with regard to international agreements as well as nationally coordinated<br />
EO infrastructure planning. The outlook <strong>for</strong> continuity <strong>of</strong> supply <strong>of</strong> the more than 40 EOS<br />
missions that are critical <strong>for</strong> <strong>Australia</strong>n R&D outcomes is largely dependent on a range <strong>of</strong> ad hoc<br />
relationships between different individual <strong>Australia</strong>n researchers and/or agencies. As also concluded<br />
by the CEODA-Ops Report, a big-picture understanding <strong>of</strong> the full extent <strong>of</strong> the relationships<br />
between <strong>Australia</strong>n EO data users and the suppliers is essential. An increasing number <strong>of</strong> supply<br />
agencies are <strong>of</strong> importance to <strong>Australia</strong> and this needs to be recognised and planned <strong>for</strong>.<br />
2. In addition to traditional US data suppliers, ESA and JAXA are identified as two significant<br />
emerging future suppliers <strong>of</strong> EO data <strong>for</strong> <strong>Australia</strong>n R&D. Formalised national agreements<br />
with these agencies should be explored as a priority to guarantee access to these critical data<br />
(Sentinel-1,-2,-3, GCOM-C, -W, ALOS-2,-3, MTSAT, GPM) on terms consistent with researcher<br />
requirements <strong>for</strong> latency etc. Further priority agreements should also be explored in relation to<br />
the supply <strong>of</strong> L-band SAR data (from JAXA and from CONAE) and the supply <strong>of</strong> Hyperspectral<br />
data (from DLR).<br />
3. A data gap <strong>for</strong> Medium Resolution Optical data appears to be imminent with the suspension<br />
<strong>of</strong> Landsat-5 data acquisition in November 2011. Rather than allow a costly plethora <strong>of</strong><br />
uncoordinated interim arrangements to be negotiated and paid <strong>for</strong> by the multitude <strong>of</strong> research<br />
and operational users in <strong>Australia</strong>, it is recommended to undertake an immediate review <strong>of</strong><br />
the data gap mitigation options and costs, and to seek to negotiate a coordinated solution at<br />
minimum overall cost to the nation.<br />
4. The replication and operational continuity <strong>of</strong> the nationally coordinated EO data access and<br />
processing ef<strong>for</strong>ts being pioneered under prototype research infrastructure initiatives such as<br />
TERN and IMOS should be explored <strong>for</strong> all Priority <strong>Data</strong> Types. The trend towards Internetbased<br />
data supply by all <strong>of</strong> the key supply agencies has significant implications <strong>for</strong> national<br />
computing infrastructure both in data storage and provision, and will require national coordination.<br />
Furthermore, given that <strong>Australia</strong> does not contribute to the funding <strong>of</strong> the satellite systems, but is<br />
amongst the world’s heaviest users <strong>of</strong> EOS data, a more coordinated approach to data acquisition<br />
would also minimise <strong>Australia</strong>’s impact on the provider agency systems by providing an effective<br />
interface to them. The establishment <strong>of</strong> national EO <strong>Data</strong> Centres <strong>for</strong> processing, archival and<br />
distribution <strong>of</strong> key datasets and derived standard products (e.g. <strong>for</strong> terrestrial, <strong>for</strong> climate and<br />
atmospheric, and <strong>for</strong> marine and coastal data), which are downloaded once from the international<br />
supplier, calibrated, processed, mirrored and held at networked repositories, and then distributed<br />
nationally, would rationalise significantly the myriad ad hoc data access arrangements that currently<br />
exist in <strong>Australia</strong>, and save significantly on the overhead and cost <strong>of</strong> international Internet traffic<br />
related to future EO data supply.<br />
110 <strong>Continuity</strong> <strong>of</strong> <strong>Earth</strong> <strong>Observation</strong> <strong>Data</strong> <strong>for</strong> <strong>Australia</strong>: R&D • January 2012
PRIORITIES FOR ACTION<br />
5. The <strong>Australia</strong>n Government should invest in strong links to, and participation in, the key<br />
international coordination bodies related to EO data supply and applications (CEOS, GEO,<br />
CGMS) as a worthwhile and cost-effective investment to counter the ‘high-risk’ strategy <strong>of</strong> assuming<br />
continued free access to the systems developed by other nations. International space agencies<br />
should continue to be encouraged and supported as they move towards free and open data<br />
access policies.<br />
6. National infrastructure to support radiometric Cal/Val should be explored. This is a fundamental<br />
element in ensuring EO data stream quality and is essential to support the growing number<br />
<strong>of</strong> operational programs relying on these data, especially in areas <strong>of</strong> legislative monitoring. It is<br />
also considered to be one <strong>of</strong> the major contributions that <strong>Australia</strong> could and should make to the<br />
international EO community.<br />
7. The <strong>Australia</strong>n Government should consider <strong>for</strong>malised support <strong>for</strong> <strong>Australia</strong>n membership<br />
<strong>of</strong> international science teams related to priority EO missions and Essential Climate Variables.<br />
Such participation is <strong>of</strong>ten locally unfunded, and is another opportunity <strong>for</strong> a clearer <strong>Australia</strong>n<br />
contribution to international ef<strong>for</strong>ts.<br />
8. Three areas are recommended <strong>for</strong> further exploration as high priority candidates <strong>for</strong> an<br />
<strong>Australia</strong>n space segment capability: SAR, Hyperspectral imagery, and Short Wave and Thermal<br />
Infrared. A cost-effective way to contribute could be through <strong>Australia</strong>n participation in the<br />
increasing number <strong>of</strong> international virtual constellations.<br />
9. The CEODA Report series provides a basis <strong>for</strong> a national consultation process to determine<br />
long-term future EO supply priorities. The CEODA-R&D Study survey process does not provide<br />
the full picture as to which future EOS data streams should be studied in more detail as to their<br />
potential to contribute to national in<strong>for</strong>mation needs and societal benefits. Furthermore, several<br />
relatively new sensor systems, which may not be widely used currently, merit more attention in<br />
terms <strong>of</strong> continuity and critical data gaps across a range <strong>of</strong> new science and application fields<br />
important to <strong>Australia</strong>. Similar processes undertaken in Europe and the USA could provide a<br />
helpful model <strong>for</strong> a follow-on consultation activity.<br />
<strong>Continuity</strong> <strong>of</strong> <strong>Earth</strong> <strong>Observation</strong> <strong>Data</strong> <strong>for</strong> <strong>Australia</strong>: R&D • January 2012 111
112 <strong>Continuity</strong> <strong>of</strong> <strong>Earth</strong> <strong>Observation</strong> <strong>Data</strong> <strong>for</strong> <strong>Australia</strong>: R&D • January 2012
REFERENCES<br />
REFERENCES<br />
ACIL Tasman (2010). Report on Economic Value <strong>of</strong> <strong>Earth</strong> <strong>Observation</strong> from Space – A Review <strong>of</strong> the Value to<br />
<strong>Australia</strong> <strong>of</strong> <strong>Earth</strong> <strong>Observation</strong> from Space. ACIL Tasman.<br />
ATSE (2009). An <strong>Australia</strong>n Strategic Plan <strong>for</strong> <strong>Earth</strong> <strong>Observation</strong> from Space. Prepared <strong>for</strong> the <strong>Australia</strong>n<br />
Academy <strong>of</strong> Science and <strong>Australia</strong>n Academy <strong>of</strong> Technological Sciences and Engineering. <strong>Australia</strong>n<br />
Academy <strong>of</strong> Science.<br />
<strong>Australia</strong>n Government (2011). <strong>Earth</strong> <strong>Observation</strong>s from Space (EOS) National Infrastructure: Priorities <strong>for</strong><br />
<strong>Australia</strong>’s Space Policy. Draft v2.4, June 2011.<br />
CEOS (2011). <strong>Earth</strong> <strong>Observation</strong> Handbook. ESA, Nov 2011. http://database.eohandbook.com/<br />
Department <strong>of</strong> Defence (2009a). Defending <strong>Australia</strong> in the Asia Pacific Century: Force 2030 – Defence White<br />
Paper 2009. Department <strong>of</strong> Defence. http://www.defence.gov.au/whitepaper/<br />
Department <strong>of</strong> Defence (2009b). Defence Capability Plan: Public Version. Department <strong>of</strong> Defence.<br />
http://www.defence.gov.au/dmo/id/dcp/dcp.cfm<br />
DIISR (2011). 2011 Strategic Roadmap <strong>for</strong> <strong>Australia</strong>n <strong>Research</strong> Infrastructure. Department <strong>of</strong> Innovation,<br />
Industry Science and <strong>Research</strong>.<br />
Dyce, P., Woolner, J., and Marks, A. (2005) Technical Implementation <strong>of</strong> the Sentinel Hotspots Web-Based Pilot<br />
Wildfire Mapping System in <strong>Australia</strong>. CSIRO Land and Water unpublished report.<br />
http://www.aprsaf.org/data/malaysia_tecshop_data/Part1_Sentinel_Implement.pdf<br />
http://www.aprsaf.org/data/malaysia_tecshop_data/Part2_Sentinel_Implement.pdf<br />
Euroconsult (2008). World Prospects <strong>for</strong> Government Space Markets, 2008 Edition.<br />
Geoscience <strong>Australia</strong> (2010). A National Space Policy: Views from the <strong>Earth</strong> <strong>Observation</strong> Community. National<br />
<strong>Earth</strong> <strong>Observation</strong> Group, Geoscience <strong>Australia</strong>.<br />
Geoscience <strong>Australia</strong> (2011). <strong>Continuity</strong> <strong>of</strong> <strong>Earth</strong> <strong>Observation</strong> <strong>Data</strong> <strong>for</strong> <strong>Australia</strong>: Operational Requirements to<br />
2015 <strong>for</strong> Lands, Coasts and Oceans. Commonwealth <strong>of</strong> <strong>Australia</strong> (Geoscience <strong>Australia</strong>).<br />
http://www.ga.gov.au/image_cache/GA19990.pdf<br />
Held, A., and Kaku, K. (2007) Sentinel Asia: An outline delivery system <strong>for</strong> satellite imagery and disaster<br />
support in the Asia-Pacific region. Proc. International Symposium <strong>of</strong> Remote Sensing <strong>of</strong> Environment,<br />
Costa Rica.<br />
National <strong>Research</strong> Council <strong>of</strong> the National Academies (2007). <strong>Earth</strong> Science and Applications from Space:<br />
National Imperatives <strong>for</strong> the Next Decade and Beyond. Committee on <strong>Earth</strong> Science and Applications<br />
from Space: A Community Assessment and Strategy <strong>for</strong> the Future. National <strong>Research</strong> Council, USA.<br />
National <strong>Research</strong> Council <strong>of</strong> the National Academies (2011). Assessing requirements <strong>for</strong> Sustained Ocean<br />
Color <strong>Research</strong> and Operations. National Academies Press.<br />
ISBN 978-0-309-21044-7 http://www.nap.edu/catalog.php?record_id=13127<br />
Northern Sky <strong>Research</strong> (2009). Global Satellite-Based <strong>Earth</strong> <strong>Observation</strong>, 2nd Edition.<br />
Space Foundation (2011). The Space Report, 2011 Edition.<br />
Space Policy Unit (2010). Analysis <strong>of</strong> <strong>Australia</strong>n Government Space Activities. Department <strong>of</strong> Innovation,<br />
Industry, Science and <strong>Research</strong>, <strong>Australia</strong>.<br />
<strong>Continuity</strong> <strong>of</strong> <strong>Earth</strong> <strong>Observation</strong> <strong>Data</strong> <strong>for</strong> <strong>Australia</strong>: R&D • January 2012 113
114 <strong>Continuity</strong> <strong>of</strong> <strong>Earth</strong> <strong>Observation</strong> <strong>Data</strong> <strong>for</strong> <strong>Australia</strong>: R&D • January 2012
GLOSSARY<br />
AAD <strong>Australia</strong>n Antarctic Division<br />
AARNet <strong>Australia</strong>n Academic and <strong>Research</strong> Network<br />
AATSR Advanced Along-Track Scanning Radiometer<br />
GLOSSARY<br />
ABARES <strong>Australia</strong>n Bureau <strong>of</strong> Agricultural and Resource Economics and Sciences<br />
ABI Advanced Baseline Imager<br />
ACBPS <strong>Australia</strong>n Customs and Border Protection Service<br />
ACCESS <strong>Australia</strong>n Community Climate and <strong>Earth</strong> System Simulator<br />
ACLUMP <strong>Australia</strong>n Collaborative Land Use Mapping Program<br />
ACT <strong>Australia</strong>n Capital Territory (territory <strong>of</strong> <strong>Australia</strong>)<br />
ACTPLA ACT Planning and Land Authority (<strong>Australia</strong>)<br />
AEB Agência Espacial Brasileira (Brazilian Space Agency)<br />
AEC <strong>Australia</strong>n Electoral Commission<br />
AEISS Advanced Electronic Image Scanning System<br />
AERONET Aerosol Robotic Network (NASA)<br />
AFMA <strong>Australia</strong>n Fisheries Management Authority<br />
AGD Attorney-General’s Department<br />
AGRIC WA Department <strong>of</strong> Agriculture and Food (<strong>Australia</strong>)<br />
AGSNET Aerosol Ground Stations Network (CSIRO)<br />
AIMS <strong>Australia</strong>n Institute <strong>for</strong> Marine Science<br />
AIRS Atmospheric Infra-Red Sounder<br />
ALI Advanced Land Imager<br />
ALISEO Aerospace Leap-frog Imaging Stationary interferometer <strong>for</strong><br />
<strong>Earth</strong> <strong>Observation</strong><br />
ALOS Advanced Land Observing Satellite (JAXA, Japan)<br />
AltiKa Ka-band Altimeter (CNES)<br />
ALUM <strong>Australia</strong>n Land Use and Management System<br />
AMAZÔNIA-1 Brazilian satellite named <strong>for</strong> the region in Brazil<br />
AMI/SAR/Image Active Microwave Instrumentation/Synthetic Aperture Radar/Image Mode<br />
AMSR-2 Advanced Microwave Scanning Radiometer-2<br />
AMSR-E Advanced Microwave Scanning Radiometer – EOS<br />
ANU <strong>Australia</strong>n National University<br />
ANZLIC <strong>Australia</strong>n and New Zealand Land In<strong>for</strong>mation Council<br />
Aqua NASA mission collecting data on <strong>Earth</strong>'s water cycle (USA)<br />
<strong>Continuity</strong> <strong>of</strong> <strong>Earth</strong> <strong>Observation</strong> <strong>Data</strong> <strong>for</strong> <strong>Australia</strong>: R&D • January 2012 115
Aquarius NASA Instrument comprising three L-Band radiometers and a<br />
scatterometer<br />
ASAR Advanced Synthetic Aperture Radar<br />
ASI Agenzia Spaziale Italiana (Italian Space Agency)<br />
ASTER Advanced Spaceborne Thermal Emission and Reflection Radiometer<br />
Astrium SPOT Image parent company, a subsidiary <strong>of</strong> EADS<br />
ATSR Along Track Scanning Radiometer<br />
AusAID <strong>Australia</strong>n Government overseas aid program<br />
AVHRR Advanced Very High Resolution Radiometer (NOAA)<br />
AWFI Advanced Wide Field Imager<br />
AWiFS Advanced Wide Field Sensor<br />
AWiFSSAT Advanced Wide Field Sensor Satellite<br />
Beijing-1 China DMC+4 microsatellite<br />
BFCRC Bushfire Cooperative <strong>Research</strong> Centre (<strong>Australia</strong>)<br />
BJ-1 See Beijing-1<br />
BNSC British National Space Centre<br />
BoM Bureau <strong>of</strong> Meteorology (<strong>Australia</strong>)<br />
BRLK ROSHYDROMET Synthetic Aperture Radar<br />
BRS Bureau <strong>of</strong> Rural Science (<strong>Australia</strong>)<br />
BSRN Baseline Surface Radiation Network<br />
Bushfires NT Team responsible <strong>for</strong> Bushfire Act in NT Department <strong>of</strong> Natural<br />
Resources, Environment, the Arts and Sport (<strong>Australia</strong>)<br />
C3DMM WA Centre <strong>of</strong> Excellence <strong>for</strong> 3D Mineral Mapping (<strong>Australia</strong>)<br />
CALIPSO Cloud-Aerosol Lidar and Infrared Pathfinder Satellite <strong>Observation</strong>s<br />
Cal/Val Calibration and Validation <strong>of</strong> EO data<br />
Cartosat Series <strong>of</strong> satellites maintained by ISRO <strong>for</strong> cartographic applications (India)<br />
CAST China Academy <strong>of</strong> Space Technology<br />
CAWCR Centre <strong>for</strong> Weather and Climate <strong>Research</strong> (<strong>Australia</strong>)<br />
CBERS China-Brazil Environmental Remote Sensing satellite<br />
CCD Charged Coupled Device<br />
CDTI Centro para el Desarrollo Tecnológico Industrial<br />
(Center <strong>for</strong> Development <strong>of</strong> Industrial Technology, Spain)<br />
CEODA-Ops <strong>Continuity</strong> <strong>of</strong> <strong>Earth</strong> <strong>Observation</strong> <strong>Data</strong> <strong>for</strong> <strong>Australia</strong>: Operational<br />
Requirements to 2015 <strong>for</strong> Lands, Coasts and Oceans (Geoscience<br />
<strong>Australia</strong>, 2011)<br />
CEOS Committee on <strong>Earth</strong> <strong>Observation</strong> Satellites: established in 1984 to<br />
coordinate <strong>Earth</strong> <strong>Observation</strong> provided by satellite missions; members and<br />
associates from civil agencies responsible <strong>for</strong> developing international <strong>Earth</strong><br />
<strong>Observation</strong> programs and/or managing related ground facilities.<br />
116 <strong>Continuity</strong> <strong>of</strong> <strong>Earth</strong> <strong>Observation</strong> <strong>Data</strong> <strong>for</strong> <strong>Australia</strong>: R&D • January 2012
CEOS MIM CEOS Missions, Instruments and Measurements database<br />
CEOS WGCV CEOS Working Group on Cal/Val<br />
CGMS Coordination Group <strong>for</strong> Meteorological Satellites<br />
CHRIS Compact High Resolution Imaging Spectrometer<br />
CNES Centre National d'Etudes Spatiales (French Space Agency)<br />
COCTS China Ocean Colour and Temperature Scanner<br />
COMDISPLAN Commonwealth Disaster Plan (<strong>Australia</strong>)<br />
COMS Communications, Oceanography and Meteorology Satellite (Korea)<br />
CONAE COmision Nacional de Actividades Espaciales (Argentina)<br />
COSI COrea SAR Instrument (KOMPSAT-5, Korea)<br />
GLOSSARY<br />
COSMIC Constellation Observing System <strong>for</strong> Meteorology, Ionosphere and Climate<br />
COSMO COnstellation <strong>of</strong> small Satellites <strong>for</strong> the Mediterranean basin <strong>Observation</strong><br />
COSMO-SkyMed COSMO satellite series<br />
CPR Cloud Pr<strong>of</strong>iling Radar<br />
CRC Cooperative <strong>Research</strong> Centre (<strong>Australia</strong>)<br />
CRCSI Cooperative <strong>Research</strong> Centre <strong>for</strong> Spatial In<strong>for</strong>mation (<strong>Australia</strong>)<br />
CRESDA Centre <strong>for</strong> Resources, Satellite <strong>Data</strong> and Application (China)<br />
CSA Canadian Space Agency<br />
CSG COSMO-SkyMed Second Generation<br />
CSIRO Commonwealth Scientific and Industrial <strong>Research</strong> Organisation (<strong>Australia</strong>)<br />
CSST CSIRO Space Sciences and Technology (<strong>Australia</strong>)<br />
CZI Coastal Zone Imager<br />
DAFF Department <strong>of</strong> Agriculture, Fisheries and Forestry (<strong>Australia</strong>)<br />
DAFWA WA Department <strong>of</strong> Agriculture and Food (<strong>Australia</strong>)<br />
DCCEE Department <strong>of</strong> Climate Change and Energy Efficiency (<strong>Australia</strong>)<br />
DEC WA Department <strong>of</strong> Environment and Conservation (<strong>Australia</strong>)<br />
DECCW NSW Department <strong>of</strong> Environment, Climate Change and Water (<strong>Australia</strong>)<br />
DEH Department <strong>of</strong> Environment and Heritage (<strong>Australia</strong>)<br />
DEM Digital Elevation Model<br />
DERM Queensland Department <strong>of</strong> Environment and Resource Management<br />
(<strong>Australia</strong>)<br />
DEWHA Department <strong>of</strong> the Environment, Water, Heritage and the Arts (<strong>Australia</strong>)<br />
Deimos-1 DMI satellite, part <strong>of</strong> the DMC (Spain)<br />
DFAT Department <strong>of</strong> Foreign Affairs and Trade (<strong>Australia</strong>)<br />
DigitalGlobe Private USA satellite system operator and digital image product provider<br />
(<strong>for</strong>merly <strong>Earth</strong>Watch, and WorldView Imaging Corporation)<br />
DIGO Defence Imagery and Geospatial Organisation (<strong>Australia</strong>)<br />
<strong>Continuity</strong> <strong>of</strong> <strong>Earth</strong> <strong>Observation</strong> <strong>Data</strong> <strong>for</strong> <strong>Australia</strong>: R&D • January 2012 117
DIISR Former Department <strong>of</strong> Innovation, Industry, Science and <strong>Research</strong><br />
(<strong>Australia</strong>)<br />
DIISRTE Department <strong>of</strong> Industry, Innovation, Science, <strong>Research</strong> and Tertiary<br />
Education (<strong>Australia</strong>) – <strong>for</strong>merly DIISR<br />
DIPE NT Department <strong>of</strong> Infrastructure, Planning and Environment (<strong>Australia</strong>)<br />
DLR Deutsche Zentrum für Luft- und Raumfahrt (German Space Agency)<br />
DMAC DubaiSat-1 Medium Aperture Camera<br />
DMC Disaster Monitoring Constellation<br />
(Consortium <strong>of</strong> European and African countries)<br />
DMCii DMC International Imaging (UK)<br />
DMI Deimos Imaging, part <strong>of</strong> the Deimos Space Group (Spain)<br />
DMSP Defense Meteorological Satellite Program (USA)<br />
DNRM Queensland Department <strong>of</strong> Natural Resource Management (<strong>Australia</strong>)<br />
DPI (Vic) Victorian Department <strong>of</strong> Primary Industry (<strong>Australia</strong>)<br />
DPI (WA) WA Department <strong>of</strong> Primary Industry (<strong>Australia</strong>)<br />
DPIWE Tasmanian Department <strong>of</strong> Primary Industry, Water and Environment<br />
(<strong>Australia</strong>)<br />
DoD Department <strong>of</strong> Defense (USA)<br />
DOW WA Department <strong>of</strong> Water (<strong>Australia</strong>)<br />
DSE Victorian Department <strong>of</strong> Sustainability and Environment (<strong>Australia</strong>)<br />
DubaiSat EIAST satellite, with receiving station in Dubai<br />
(United Arab Emirates)<br />
DWLBC SA Department <strong>of</strong> Water, Land, Biodiversity and Conservation (<strong>Australia</strong>)<br />
EADS European Aeronautic Defence and Space Company<br />
<strong>Earth</strong>CARE ESA cloud and aerosol mission (Europe)<br />
EC<br />
ECV<br />
European Commission<br />
Essential Climate Variable<br />
ECMWF European Centre <strong>for</strong> Medium-Range Weather Forecasts<br />
EHC Electronic Housing Code (<strong>Australia</strong>)<br />
EIAST Emirates Institution <strong>for</strong> Advanced Science and Technology (United Arab<br />
Emirates)<br />
EMA Emergency Management <strong>Australia</strong><br />
EnMAP Environmental Mapping and Analysis Program (Germany)<br />
Envisat Environmental Satellite (ESA)<br />
EO <strong>Earth</strong> <strong>Observation</strong><br />
EOS <strong>Earth</strong> <strong>Observation</strong>s from Space<br />
ERIN Environmental Resources In<strong>for</strong>mation Network (<strong>Australia</strong>)<br />
EROS <strong>Earth</strong> Resources <strong>Observation</strong> and Science<br />
118 <strong>Continuity</strong> <strong>of</strong> <strong>Earth</strong> <strong>Observation</strong> <strong>Data</strong> <strong>for</strong> <strong>Australia</strong>: R&D • January 2012
ERS European Remote Sensing satellite (ESA)<br />
ERSDAC <strong>Earth</strong> Remote Sensing <strong>Data</strong> Analysis Centre (Japan)<br />
ERTS <strong>Earth</strong> Resource Technology Satellite (renamed to Landsat)<br />
ESA European Space Agency<br />
ETM+ Enhanced Thematic Mapper Plus<br />
GLOSSARY<br />
EUMETSAT European Organisation <strong>for</strong> the Exploitation <strong>of</strong> Meteorological Satellites<br />
FAPAR Fraction <strong>of</strong> Absorbed Photosynthetically Active Radiation<br />
FCI Flexible Combined Imager<br />
FMCW Frequency Modulated Continuous Wave (Radar)<br />
FORMOSAT Series <strong>of</strong> satellites managed by NSPO (Taiwan)<br />
FY FengYun (wind and cloud) polar orbiting meteorological satellite series<br />
(China)<br />
GA Geoscience <strong>Australia</strong><br />
GAC Global Area Coverage<br />
GB Gigabyte (10 6 KB)<br />
GCOS Global Climate Observing System<br />
GCOM-C1 Global Change <strong>Observation</strong> Mission – Climate series (Japan)<br />
GCOM-W1 Global Change <strong>Observation</strong> Mission – Water series (Japan)<br />
GDE Groundwater Dependent Ecosystems<br />
GEO Group on <strong>Earth</strong> <strong>Observation</strong>s: Intergovernmental body established in<br />
2002 that encourages members to coordinate projects, strategies and<br />
investments <strong>for</strong> <strong>Earth</strong> observation.<br />
GeoEye Private USA company providing satellite and aerial imagery and services<br />
GEOSS Global <strong>Earth</strong> <strong>Observation</strong> System <strong>of</strong> Systems: Being developed by GEO<br />
based on 10 year plan from 2005 to advance and demonstrate societal<br />
benefits <strong>of</strong> <strong>Earth</strong> observation in nine specific areas: Disasters, Health,<br />
Energy, Climate, Agriculture, Ecosystems, Biodiversity, Water and Weather.<br />
Geoton-L1 ROSKOSMOS high resolution imaging Vis/IP radiometer<br />
GFOI Global Forest <strong>Observation</strong> Initiative<br />
GFZ GeoForschungZentrum Potsdam<br />
(National German <strong>Research</strong> Centre <strong>for</strong> <strong>Earth</strong> Science)<br />
GIS MS GeoEye Imager System – Multispectral<br />
GIS PAN GeoEye Imager System – Panchromatic<br />
GISTDA Geo-In<strong>for</strong>matics and Space Technology Development Agency (Thailand)<br />
GLAS Geoscience Laser Altimeter System<br />
GMES Global Monitoring <strong>for</strong> Environment and Security (ESA)<br />
GOCI Geostationary Ocean Colour Imager (Korea)<br />
GOES-R Geostationary Operational Environmental Satellite R-Series (NOAA)<br />
<strong>Continuity</strong> <strong>of</strong> <strong>Earth</strong> <strong>Observation</strong> <strong>Data</strong> <strong>for</strong> <strong>Australia</strong>: R&D • January 2012 119
GOES-S Geostationary Operational Environmental Satellite S-Series (NOAA)<br />
GPM Global Precipitation Measurement mission<br />
GPS Global Positioning System (USA)<br />
GRACE Gravity Recovery and Climate Experiment (NASA)<br />
GRDC Grain <strong>Research</strong> and Development Corporation (<strong>Australia</strong>)<br />
GSD Ground Sampling Distance<br />
GSQ Geological Survey <strong>of</strong> Queensland (<strong>Australia</strong>)<br />
GSWA Geological Survey <strong>of</strong> WA (<strong>Australia</strong>)<br />
GTS Global Telecommunication System (WMO)<br />
HHI Hyperion Hyperspectral Imager<br />
HICO Hyperspectral Imager <strong>for</strong> the Coastal Ocean<br />
HiRI High Resolution Imager<br />
HISUI Hyperspectral imager Suite, ALOS-3 (Japan)<br />
HJ Huan Jing (environment) satellite series (China)<br />
HPC High Per<strong>for</strong>mance Computing<br />
HPCCC High Per<strong>for</strong>mance Computing and Communications Centre<br />
HPSC High Per<strong>for</strong>mance Scientific Computing facility (CSIRO)<br />
HRG High Resolution Geometrical<br />
HRPIC High Resolution Panchromatic Imaging Camera<br />
HRS High Resolution Stereoscope<br />
HRTC High Resolution Technological Camera (Panchromatic)<br />
HRVIR High Resolution Visible and Infra-Red<br />
HSC High Sensitivity Camera<br />
HSI Hyperspectral Imager<br />
HSTC High Sensitivity Technological Camera<br />
HY HaiYang (ocean) satellite series (China)<br />
HYC HYperspectral Camera<br />
HySI Hyperspectral Imager<br />
HyspIRI Hyperspectral Infrared Imager<br />
IASI Infrared Atmospheric Sounding Interferometer<br />
IFCI International Forest Carbon Initiative<br />
IKONOS Lockheed Martin / GeoEye commercial satellite—after the Greek word<br />
eikon, -<br />
meaning ‘image’<br />
Imager (INSAT) Very High Resolution Radiometer (ISRO)<br />
IMCRA Integrated Marine and Coastal Regionalisation <strong>of</strong> <strong>Australia</strong><br />
IMOS Integrated Marine Observing System (<strong>Australia</strong>)<br />
IMS-1 Indian MicroSatellite – 1<br />
120 <strong>Continuity</strong> <strong>of</strong> <strong>Earth</strong> <strong>Observation</strong> <strong>Data</strong> <strong>for</strong> <strong>Australia</strong>: R&D • January 2012
INCAS Indonesian National Carbon Accounting System (Indonesia)<br />
Ingenio Also knowns as SEOSAT, Satélite Español de Observación de la Tierra<br />
(Spanish System <strong>for</strong> <strong>Earth</strong> <strong>Observation</strong> Satellite)<br />
(CDTI, ESA)<br />
INPE Instituto Nacional de Pesquisas Espaciais<br />
(Institute <strong>of</strong> Spatial <strong>Research</strong>, Brazil)<br />
INSAT Indian National Satellite System<br />
IR Infrared<br />
IRS Infrared Sounding instrument<br />
IRS-P6 Indian Remote Sensing satellite, also known as RESOURCESAT-1<br />
ISA International Space Agency<br />
ISRO Indian Space <strong>Research</strong> Organisation<br />
ITT International Telephone & Telegraph (corporation, USA)<br />
iVEC WA collaborative supercomputing, storage and visualisation centre<br />
JAXA Japan Aerospace Exploration Agency<br />
JMA Japan Meteorological Agency<br />
JMR Jason-1 Microwave Radiometer (successor to tMR)<br />
JPSS Joint Polar Satellite System (NASA)<br />
GLOSSARY<br />
KALPANA-1 Meteorological satellite named <strong>for</strong> the Indian-born American Astronaut Dr<br />
Kalpana Chawla (India)<br />
KARI Korea Aerospace <strong>Research</strong> Institute<br />
KaRIN Ka-band Radar INterferometer<br />
KB Kilobyte (2 10 bytes)<br />
KMSS ROSHYDROMET MultiSpectral Imager (VIS)<br />
KOMPSAT KOrea Multi-Purpose SATellite<br />
Landgate WA Statutory Authority responsible <strong>for</strong> Land In<strong>for</strong>mation and Geographic<br />
<strong>Data</strong> (<strong>Australia</strong>)<br />
Landsat Originally known as the <strong>Earth</strong> Resource Technology Satellite, renamed in<br />
1975 (USA)<br />
LDCM Landsat <strong>Data</strong> <strong>Continuity</strong> Mission, also Landsat-8 (USA)<br />
LISS-III Linear Imaging Self Scanner - III<br />
LISS-IV Linear Imaging Self Scanner - IV<br />
LoSaMBA Law <strong>of</strong> the Sea and Maritime Boundaries Advice (<strong>Australia</strong>)<br />
LPDAAC Land Products Distributed Active Archive Centre, USGS<br />
LPMA NSW Land and Property Management Authority (<strong>Australia</strong>)<br />
MB Megabyte (10 3 KB)<br />
MBEI Multi-Band <strong>Earth</strong> Imager<br />
MCSI Multiple Channel Scanning Imager<br />
<strong>Continuity</strong> <strong>of</strong> <strong>Earth</strong> <strong>Observation</strong> <strong>Data</strong> <strong>for</strong> <strong>Australia</strong>: R&D • January 2012 121
MDA MacDonald Dettwiler and Associates (Canada)<br />
MDBA Murray-Darling Basin Authority (<strong>Australia</strong>)<br />
MERCI MERIS Catalogue and Inventory<br />
MERIS Medium-Resolution Imaging Spectrometer<br />
MERSI Medium-Resolution Spectral Imager<br />
Meteor-M Series <strong>of</strong> Russian meteorological satellites<br />
METI Ministry <strong>of</strong> Economy, trade and industry (Japan)<br />
Metop Meteorological Operational—Series <strong>of</strong> polar-orbiting meteorological<br />
satellites (EUMETSAT/NOAA)<br />
MIOSAT MIssione Ottica su microSATellite (Italy)<br />
MIR Mid-infrared<br />
MIRAS Microwave Imaging Radiometer using Aperture Synthesis<br />
MIREI Mid-InfraRed <strong>Earth</strong> Imager<br />
MMRS Multispectral Medium Resolution Scanner<br />
MODIS MODerate-Resolution Imaging Spectroradiometer (NASA)<br />
Monitor-E Monitor Experimental (Russia)<br />
MoU Memorandum <strong>of</strong> Understanding<br />
MS Multispectral (Camera or Imager)<br />
MSC MultiSpectral Camera<br />
MSI MultiSpectral Imager<br />
MSMR Multifrequency Scanning Microwave Radiometer<br />
MSS MultiSpectral Scanner<br />
MSU-MR Multispectral Scanning Imager–Radiometer (visible/IR)<br />
MTG-I1 Meteosat Third Generation – Imager Mission 1<br />
MTSAT Series <strong>of</strong> Japanese meteorological satellites (JMA)<br />
MUX Multispectral Camera<br />
MVIRS Moderate Resolution Visible and Infra-Red Imaging Spectroradiometer<br />
MVISR Multispectral Visible and Infra-Red Scan Radiometer<br />
MWR Microwave Radiometer<br />
MWRI Microwave Radiation Imager<br />
MxT Multi-spectral CCD Camera<br />
NASA National Aeronautics and Space Administration (USA)<br />
NASRDA National Space <strong>Research</strong> and Development Agency (Nigeria)<br />
NCAS National Carbon Accounting System (<strong>Australia</strong>)<br />
NCI National Computing Infrastructure<br />
NDVI Normalised Difference Vegetation Index<br />
NEDF National Elevation <strong>Data</strong> Framework (<strong>Australia</strong>)<br />
122 <strong>Continuity</strong> <strong>of</strong> <strong>Earth</strong> <strong>Observation</strong> <strong>Data</strong> <strong>for</strong> <strong>Australia</strong>: R&D • January 2012
GLOSSARY<br />
NEO National <strong>Earth</strong> <strong>Observation</strong> group within Geoscience <strong>Australia</strong> (<strong>for</strong>merly<br />
the <strong>Australia</strong>n Centre <strong>for</strong> Remote Sensing, ACRES)<br />
NEON National Ecological Observatory Network<br />
NigeriaSat Nigeria Satellite series<br />
NIR Near Infrared (electromagnetic radiation with wavelength near the red end<br />
<strong>of</strong> the visible spectrum)<br />
NIRST New Infrared Sensor Technology<br />
NLWRA National Land and Water Resources Audit (<strong>Australia</strong>)<br />
NMP EO-1 New Millennium Program <strong>Earth</strong> Observing mission 1<br />
NOAA National Oceanic and Atmospheric Administration (USA)<br />
NPOESS National Polar-orbiting Operational Environmental Satellite System (USA)<br />
NPEI National Plan <strong>for</strong> Environmental In<strong>for</strong>mation<br />
NPP NPOESS Preparatory Project (USA)<br />
NRSCC National Remote Sensing Center <strong>of</strong> China<br />
NRSTRG National Remote Sensing Technical Reference Group (<strong>Australia</strong>)<br />
NSAU National Space Agency <strong>of</strong> Ukraine<br />
NSPO National Space Program Office (Taiwan)<br />
NSW New South Wales (state <strong>of</strong> <strong>Australia</strong>)<br />
NT Northern Territory (territory <strong>of</strong> <strong>Australia</strong>)<br />
NT DNREAS Northern Territory Department <strong>of</strong> Natural Resources, Environment, the<br />
Arts and Sport<br />
NTLIS NT Land In<strong>for</strong>mation System (<strong>Australia</strong>)<br />
NVIS National Vegetation In<strong>for</strong>mation System (<strong>Australia</strong>)<br />
NWP National Weather Program (BoM, <strong>Australia</strong>)<br />
OCEANSAT OCEAN SATellite series (India)<br />
OCM Ocean Colour Monitor<br />
OCS Ocean Colour Scanner<br />
OLCI Ocean and Land Colour Imager<br />
OLI Operational Land Imager<br />
OOW NSW Office <strong>of</strong> Water (<strong>Australia</strong>)<br />
ORBIMAGE Orbital Imaging Corporation, now GeoEye (USA)<br />
OrbView OrbImage/GeoEye satellite series (also known as SeaStar)<br />
ORFEO Optical and Radar Federated <strong>Earth</strong> <strong>Observation</strong> (France & Italy)<br />
PAN Panchromatic (Camera or Imager)<br />
PAZ Also known as SEOSAR, Satélite Español de Observación SAR<br />
(SAR <strong>Observation</strong> Spanish Satellite) (CDTI)<br />
PB Petabyte (10 12 KB)<br />
PM&C Department <strong>of</strong> the Prime Minister and Cabinet (<strong>Australia</strong>)<br />
<strong>Continuity</strong> <strong>of</strong> <strong>Earth</strong> <strong>Observation</strong> <strong>Data</strong> <strong>for</strong> <strong>Australia</strong>: R&D • January 2012 123
PMR Passive Microwave Radiometer<br />
POAMA Predictive Ocean Atmosphere Model <strong>for</strong> <strong>Australia</strong><br />
PPP Public-Private Partnership<br />
PRISMA Precursore IperSpettrale della Missione Operativa (Italy)<br />
PROBA PRoject <strong>for</strong> OnBoard Autonomy (ESA)<br />
PSA A panchromatic imager (aka Gamma-L) (Russia)<br />
QLUMP Queensland Land Use Monitoring Program (<strong>Australia</strong>)<br />
QuickBird High resolution satellite owned and operated by DigitalGlobe (USA)<br />
R&D <strong>Research</strong> and Development<br />
RADAR RAdio Detection And Ranging<br />
RADARSAT RADAR SATellite (Canada)<br />
RADARSAT C RADAR SATellite Constellation (Canada)<br />
RapidEye German geospatial in<strong>for</strong>mation provider (now Canadian-owned)<br />
RASAT Microsatellite imaging mission <strong>of</strong> Tubitak-Uzay;<br />
After the Turkish word meaning ‘observation’ (Turkey)<br />
RCM Radarsat Constellation Mission (Canada)<br />
RCM DERM Reef Catchment Monitoring (<strong>Australia</strong>)<br />
RDSA A multispectral imager (aka Gamma-C) (Russia)<br />
REDD Reducing Emissions from De<strong>for</strong>estation and Forest Degradation<br />
RESOURCESAT RESOURCE SATellite (India)<br />
Resurs DK1 Resurs – High Resolution 1 (Russia)<br />
Resurs P Resurs P Environmental Satellite (Russia)<br />
RET Department <strong>of</strong> Resources, Energy and Tourism (<strong>Australia</strong>)<br />
RGB Red Green Blue (generally refers to visible light)<br />
RISAT Radar Imaging SATellite (India)<br />
ROSHYDROMET Russian Federal Service <strong>for</strong> Hydrometeorology and Environmental<br />
Monitoring<br />
ROSKOSMOS Russian Federal Space Agency<br />
RSI Remote Sensing Instrument (Taiwan)<br />
S-Band SAR S-Band Synthetic Aperture Radar<br />
SA South <strong>Australia</strong> (state <strong>of</strong> <strong>Australia</strong>)<br />
SAC-C Satelite de Aplicaciones Cientificas – C<br />
(Satellite <strong>for</strong> Scientific Applications – C, Argentina)<br />
SAC-D Satelite de Aplicaciones Cientificas – D<br />
(Satellite <strong>for</strong> Scientific Applications – D, Argentina)<br />
SAGNAC For French physicist George Sagnac (cf. Sagnac interference)<br />
SANSA South African National Space Agency<br />
124 <strong>Continuity</strong> <strong>of</strong> <strong>Earth</strong> <strong>Observation</strong> <strong>Data</strong> <strong>for</strong> <strong>Australia</strong>: R&D • January 2012
SAOCOM SAtélite Argentino de Observación COn Microondas<br />
(Argentine Microwaves <strong>Observation</strong> Satellite)<br />
SAR Synthetic Aperture Radar<br />
SAR 2000 Synthetic Aperture Radar – 2000<br />
SAR-2000 S.G. SAR–2000 Second Generation<br />
SAR-L L-Band Synthetic Aperture Radiometer<br />
SAR-X X-Band Synthetic Aperture Radiometer<br />
SARAL Satellite with ARgos and ALtiKa<br />
SBA Societal Benefit Area, defined by GEOSS<br />
SeaWiFS Sea-viewing Wide Field-<strong>of</strong>-view Sensor<br />
Sentinel Radar imaging satellite missions supporting GMES<br />
Severjanin X-band Synthetic Aperature Radar (Russia)<br />
SGLI Second generation GLobal imager (Japan)<br />
Sich-2 Small ocean observation satellite (Ukraine)<br />
SIRAL SAR Interferometer Radar Altimeter<br />
SLATS Statewide Landcover and Tree Study (Queensland, <strong>Australia</strong>)<br />
SLIM-6 Surrey Linear IMager – 6 channel<br />
GLOSSARY<br />
SLIP-EM WA Shared Land In<strong>for</strong>mation Plat<strong>for</strong>m Emergency Management (<strong>Australia</strong>)<br />
SLSTR Sea and Land Surface Temperature Radiometer<br />
SMAP Soil Moisture Active Passive (NASA)<br />
SMOS Soil Moisture and Ocean Salinity (ESA)<br />
SNSB Swedish National Space Board<br />
SOE State <strong>of</strong> Environment (<strong>Australia</strong>)<br />
SPOT Système Probatoire d'<strong>Observation</strong> de la Terre (France)<br />
SPU Space Policy Unit (<strong>Australia</strong>)<br />
SRAL SAR Radar Altimeter<br />
SSM/I Special Sensor Microwave Imager<br />
SST Sea Surface Temperature<br />
SumbandilaSat Sumbandila Satellite (from a Venda word, chosen by school children,<br />
meaning ‘lead the way’) (South Africa)<br />
SumbandilaSat Imager A 6 spectral band (visible range) line scanner<br />
SWIR Short-wave Infrared<br />
SZS Shore Zone Scanner<br />
tanDEM-X terraSAR-X add-on <strong>for</strong> Digital Elevation Measurement (Germany)<br />
TB Terabyte (10 9 KB)<br />
TERN Terrestrial Ecosystem <strong>Research</strong> Network (<strong>Australia</strong>)<br />
<strong>Continuity</strong> <strong>of</strong> <strong>Earth</strong> <strong>Observation</strong> <strong>Data</strong> <strong>for</strong> <strong>Australia</strong>: R&D • January 2012 125
Terra A multi-national NASA scientific research satellite, from the Latin word <strong>for</strong><br />
"earth"<br />
terraSAR-X Satellite acquiring X-band SAR data (Germany)<br />
TERSS Tasmanian <strong>Earth</strong> Resource Satellite Station (<strong>Australia</strong>)<br />
TES Technology Experiment Satellite (India)<br />
TES-HYS TES Hyperspectral Imager<br />
THEOS THailand <strong>Earth</strong> <strong>Observation</strong> Satellite (Thailand)<br />
TIR Thermal Infrared Radiometer<br />
TIRS Thermal InfraRed Sensor<br />
TM Thematic Mapper<br />
TMI TRMM Microwave Imager<br />
TMPA TRMM Multi-satellite Precipitation Analysis<br />
TMR tOPEX Microwave Radiometer (predecessor to JMR)<br />
TopSat Tactical Optical Satellite (UK)<br />
TPM Topex-Poseidon Mission<br />
TRMM tropical Rainfall Measuring Mission (USA & Japan)<br />
tSX-SAR terraSAR-X SAR<br />
Tubitak Space Technologies <strong>Research</strong> Institute /<br />
The Scientific and Technological <strong>Research</strong> Council <strong>of</strong> Turkey<br />
TVMMP Tasmanian Vegetation Mapping and Monitoring Program (<strong>Australia</strong>)<br />
UAdel University <strong>of</strong> Adelaide (<strong>Australia</strong>)<br />
UAV Unmanned Aerial Vehicles<br />
UK-DMC UK Disaster Monitoring Constellation (UK)<br />
ULTRAPAN (Cartosat-3) Panchromatic sensor<br />
UNCLOS United Nations Convention on the Law <strong>of</strong> the Sea<br />
UNSW University <strong>of</strong> NSW (<strong>Australia</strong>)<br />
USGS USA Geological Survey (USA)<br />
UTS University <strong>of</strong> Technology Sydney (<strong>Australia</strong>)<br />
UWA University <strong>of</strong> Western <strong>Australia</strong> (<strong>Australia</strong>)<br />
VENμS Vegetation and Environment monitoring on a New<br />
micro-Satellite (France & Israel)<br />
VHRR Very High Resolution Radiometer<br />
VIIRS Visible/Infrared Imager Radiometer Suite<br />
VIRR Multispectral Visible and Infra-Red Scan Radiometer<br />
VSC Venus Superspectral Camera<br />
WA Western <strong>Australia</strong> (state <strong>of</strong> <strong>Australia</strong>)<br />
WALIS Western <strong>Australia</strong>n Land In<strong>for</strong>mation System (<strong>Australia</strong>)<br />
126 <strong>Continuity</strong> <strong>of</strong> <strong>Earth</strong> <strong>Observation</strong> <strong>Data</strong> <strong>for</strong> <strong>Australia</strong>: R&D • January 2012
WASTAC Western <strong>Australia</strong>n Satellite Technology and Applications Consortium<br />
(<strong>Australia</strong>)<br />
WFC Wide Field Camera<br />
WFI Wide Field Imager<br />
WIRADA Water In<strong>for</strong>mation <strong>Research</strong> and Development Alliance (<strong>Australia</strong>)<br />
WMO World Meteorological Organisation<br />
GLOSSARY<br />
WorldView Commercial satellite (cf. QuickBird) owned and operated by DigitalGlobe<br />
(USA)<br />
WV110 WorldView-110 camera (combined panchromatic and 8-band multispectral<br />
scanners)<br />
WV60 WorldView-60 camera (panchromatic imager only)<br />
X-Band SAR X-Band Synthetic Aperture Radar<br />
<strong>Continuity</strong> <strong>of</strong> <strong>Earth</strong> <strong>Observation</strong> <strong>Data</strong> <strong>for</strong> <strong>Australia</strong>: R&D • January 2012 127