Continuity of Earth Observation Data for Australia: Research ... - csiro
Continuity of Earth Observation Data for Australia: Research ... - csiro
Continuity of Earth Observation Data for Australia: Research ... - csiro

Create successful ePaper yourself
Turn your PDF publications into a flip-book with our unique Google optimized e-Paper software.
EO <strong>Data</strong> Type<br />
Optical – Low<br />
Resolution<br />
Atmospheric<br />
Temperature and<br />
Humidity Sounding<br />
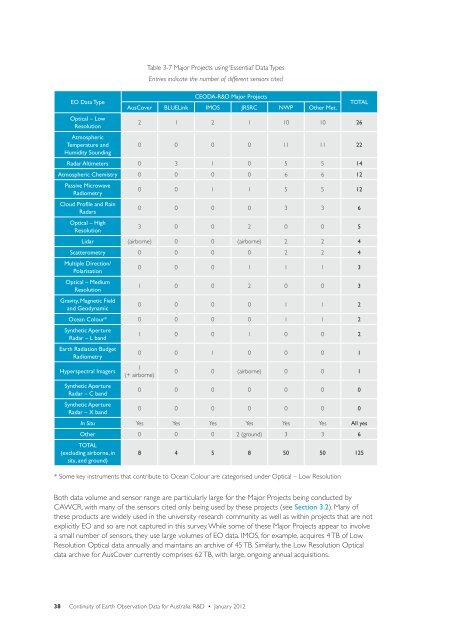
Table 3-7 Major Projects using ‘Essential’ <strong>Data</strong> Types<br />
Entries indicate the number <strong>of</strong> different sensors cited<br />
CEODA-R&D Major Projects<br />
AusCover BLUELink IMOS JRSRC NWP Other Met.<br />
38 <strong>Continuity</strong> <strong>of</strong> <strong>Earth</strong> <strong>Observation</strong> <strong>Data</strong> <strong>for</strong> <strong>Australia</strong>: R&D • January 2012<br />
TOTAL<br />
2 1 2 1 10 10 26<br />
0 0 0 0 11 11 22<br />
Radar Altimeters 0 3 1 0 5 5 14<br />
Atmospheric Chemistry 0 0 0 0 6 6 12<br />
Passive Microwave<br />
Radiometry<br />
Cloud Pr<strong>of</strong>ile and Rain<br />
Radars<br />
Optical – High<br />
Resolution<br />
0 0 1 1 5 5 12<br />
0 0 0 0 3 3 6<br />
3 0 0 2 0 0 5<br />
Lidar (airborne) 0 0 (airborne) 2 2 4<br />
Scatterometry 0 0 0 0 2 2 4<br />
Multiple Direction/<br />
Polarisation<br />
Optical – Medium<br />
Resolution<br />
Gravity, Magnetic Field<br />
and Geodynamic<br />
0 0 0 1 1 1 3<br />
1 0 0 2 0 0 3<br />
0 0 0 0 1 1 2<br />
Ocean Colour* 0 0 0 0 1 1 2<br />
Synthetic Aperture<br />
Radar – L band<br />
<strong>Earth</strong> Radiation Budget<br />
Radiometry<br />
Hyperspectral Imagers<br />
Synthetic Aperture<br />
Radar – C band<br />
Synthetic Aperture<br />
Radar – X band<br />
1 0 0 1 0 0 2<br />
0 0 1 0 0 0 1<br />
1<br />
(+ airborne)<br />
0 0 (airborne) 0 0 1<br />
0 0 0 0 0 0 0<br />
0 0 0 0 0 0 0<br />
In Situ Yes Yes Yes Yes Yes Yes All yes<br />
Other 0 0 0 2 (ground) 3 3 6<br />
TOTAL<br />
(excluding airborne, in<br />
situ, and ground)<br />
8 4 5 8 50 50 125<br />
* Some key instruments that contribute to Ocean Colour are categorised under Optical – Low Resolution<br />
Both data volume and sensor range are particularly large <strong>for</strong> the Major Projects being conducted by<br />
CAWCR, with many <strong>of</strong> the sensors cited only being used by these projects (see Section 3.2). Many <strong>of</strong><br />
these products are widely used in the university research community as well as within projects that are not<br />
explicitly EO and so are not captured in this survey. While some <strong>of</strong> these Major Projects appear to involve<br />
a small number <strong>of</strong> sensors, they use large volumes <strong>of</strong> EO data. IMOS, <strong>for</strong> example, acquires 4 TB <strong>of</strong> Low<br />
Resolution Optical data annually and maintains an archive <strong>of</strong> 45 TB. Similarly, the Low Resolution Optical<br />
data archive <strong>for</strong> AusCover currently comprises 62 TB, with large, ongoing annual acquisitions.