
You also want an ePaper? Increase the reach of your titles
YUMPU automatically turns print PDFs into web optimized ePapers that Google loves.
Savanta Consumer Compass Europe <strong>Q3</strong> <strong>2023</strong><br />
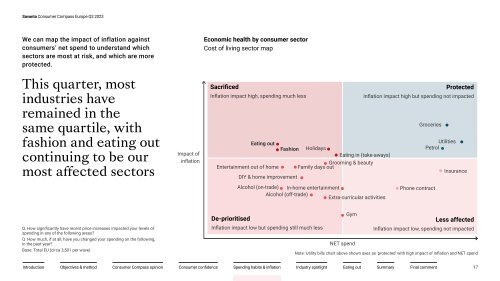
We can map the impact of inflation against<br />
consumers’ net spend to understand which<br />
sectors are most at risk, and which are more<br />
protected.<br />
This quarter, most<br />
industries have<br />
remained in the<br />
same quartile, with<br />
fashion and eating out<br />
continuing to be our<br />
most affected sectors<br />
Impact of<br />
inflation<br />
Economic health by consumer sector<br />
Cost of living sector map<br />
Sacrificed<br />
Inflation impact high, spending much less<br />
Eating out<br />
Entertainment out of home<br />
Fashion<br />
DIY & home improvement<br />
Holidays<br />
Grooming & beauty<br />
Family days out<br />
Protected<br />
Inflation impact high but spending not impacted<br />
Eating in (take-aways)<br />
Groceries<br />
Utilities<br />
Petrol<br />
Insurance<br />
Alcohol (on-trade) In-home entertainment<br />
Alcohol (off-trade)<br />
Extra-curricular activities<br />
Phone contract<br />
Q. How significantly have recent price increases impacted your levels of<br />
spending in any of the following areas?<br />
Q. How much, if at all, have you changed your spending on the following,<br />
in the past year?<br />
Base: Total EU (circa 3,501 per wave)<br />
De-prioritised<br />
Gym<br />
Less affected<br />
Inflation impact low but spending still much less<br />
Inflation impact low, spending not impacted<br />
NET spend<br />
Note: Utility bills chart above shown axes as 'protected' with high impact of inflation and NET spend<br />
17