CHAPTER I Global Investment Trends
CHAPTER I Global Investment Trends
CHAPTER I Global Investment Trends

You also want an ePaper? Increase the reach of your titles
YUMPU automatically turns print PDFs into web optimized ePapers that Google loves.
12<br />
World <strong>Investment</strong> Report 2011: Non-Equity Modes of International Production and Development<br />
Box I.2. FDI flows and the use of funds for investment<br />
FDI is traditionally broken down into three components: equity capital, intra-company loans, and reinvested earnings<br />
of foreign affiliates. These component parts can be considered as sources of funds for investment, additional to<br />
funds raised on local and international capital markets. However, the decision by a TNC to finance an investment in<br />
productive assets in a host country through an increase in equity capital, a loan, or by using income earned in the<br />
host country is driven by a wide range of factors, most of which are beyond the reach of host-country policymakers<br />
to influence.<br />
From a policymaker’s perspective, it may be more relevant to see how FDI flows are used (use of funds). TNCs can<br />
employ FDI (1) for the creation, expansion or improvement of productive assets, generating additional productive<br />
capacity, (2) to finance changes in ownership of assets (M&As), or (3) to add to the financial reserves of foreign<br />
affiliates. The latter may be motivated by decisions on the level of financial leverage of the firm, by the need to retain<br />
cash for planned future investments, by fiscal considerations (e.g. to defer tax liabilities upon repatriation of profits),<br />
or by other factors, including opportunistic behaviour on the part of TNCs to profit from changes in exchange rates<br />
or local asset-price rises.<br />
The traditional method of analysing FDI by sources of funds tends to overlook the significance of such “parked<br />
funds” held in foreign affiliates of TNCs. “Reinvested earnings” consist of income earned by foreign affiliates that is<br />
not repatriated to the home country of the parent firm; firms do not necessarily reinvest this income in additional<br />
productive capacity. The difference between FDI flows and actual capital expenditures by foreign affiliates represents<br />
FDI not immediately employed for the creation of additional productive capacity and, as such, it is a good proxy for<br />
the increase in cash reserves in foreign affiliates.<br />
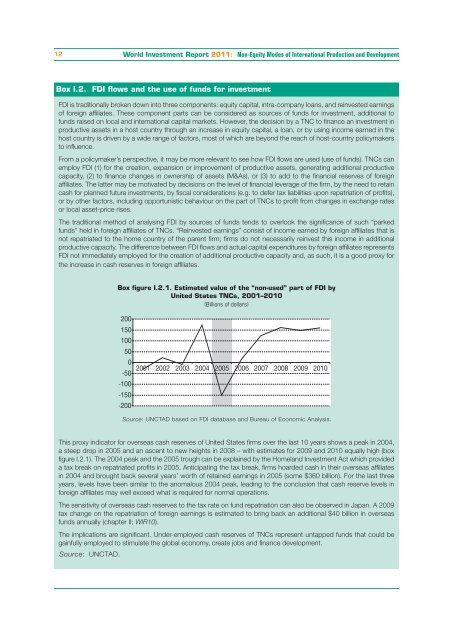
Box figure I.2.1. Estimated value of the “non-used” part of FDI by<br />
United States TNCs, 2001–2010<br />
(Billions of dollars)<br />
Source: UNCTAD based on FDI database and Bureau of Economic Analysis.<br />
This proxy indicator for overseas cash reserves of United States firms over the last 10 years shows a peak in 2004,<br />
a steep drop in 2005 and an ascent to new heights in 2008 – with estimates for 2009 and 2010 equally high (box<br />
figure I.2.1). The 2004 peak and the 2005 trough can be explained by the Homeland <strong>Investment</strong> Act which provided<br />
a tax break on repatriated profits in 2005. Anticipating the tax break, firms hoarded cash in their overseas affiliates<br />
in 2004 and brought back several years’ worth of retained earnings in 2005 (some $360 billion). For the last three<br />
years, levels have been similar to the anomalous 2004 peak, leading to the conclusion that cash reserve levels in<br />
foreign affiliates may well exceed what is required for normal operations.<br />
The sensitivity of overseas cash reserves to the tax rate on fund repatriation can also be observed in Japan. A 2009<br />
tax change on the repatriation of foreign earnings is estimated to bring back an additional $40 billion in overseas<br />
funds annually (chapter II; WIR10).<br />
The implications are significant. Under-employed cash reserves of TNCs represent untapped funds that could be<br />
gainfully employed to stimulate the global economy, create jobs and finance development.<br />
Source: UNCTAD.<br />
200<br />
150<br />
100<br />
50<br />
0<br />
2001 2002 2003 2004 2005 2006 2007 2008 2009 2010<br />
-50<br />
-100<br />
-150<br />
-200