CHAPTER I Global Investment Trends
CHAPTER I Global Investment Trends
CHAPTER I Global Investment Trends

You also want an ePaper? Increase the reach of your titles
YUMPU automatically turns print PDFs into web optimized ePapers that Google loves.
30<br />
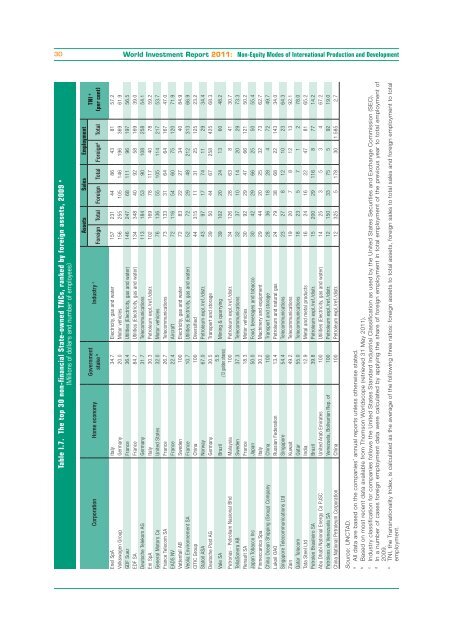
Table I.7. The top 30 non-financial State-owned TNCs, ranked by foreign assets, 2009 a<br />
(Millions of dollars and number of employees)<br />
Assets Sales Employment<br />
TNI e<br />
(per cent)<br />
Foreign Total Foreign Total Foreign d Total<br />
Industry c<br />
Government<br />
stake b<br />
Corporation Home economy<br />
World <strong>Investment</strong> Report 2011: Non-Equity Modes of International Production and Development<br />
Enel SpA Italy 34.7 Electricity, gas and water 157 231 44 86 43 81 57.2<br />
Volkswagen Group Germany 20.0 Motor vehicles 156 255 105 146 196 369 61.9<br />
GDF Suez France 36.4 Utilities (Electricity, gas and water) 146 247 68 111 96 197 56.5<br />
EDF SA France 84.7 Utilities (Electricity, gas and water) 134 348 40 92 58 169 39.0<br />
Deutsche Telekom AG Germany 31.7 Telecommunications 113 184 53 90 108 258 54.1<br />
Eni SpA Italy 30.3 Petroleum expl./ref./distr. 102 169 78 117 40 78 59.2<br />
General Motors Co United States 32.0 Motor vehicles 76 136 55 105 114 217 53.7<br />
France Telecom SA France 26.7 Telecommunications 73 133 31 64 64 167 47.0<br />
EADS NV France 22.4 Aircraft 72 116 54 60 75 120 71.9<br />
Vattenfall AB Sweden 100 Electricity, gas and water 72 83 22 27 34 40 84.9<br />
Veolia Environnement SA France 10.7 Utilities (Electricity, gas and water) 52 72 29 48 212 313 66.9<br />
CITIC Group China 100 Diversified 44 315 11 31 25 125 23.2<br />
Statoil ASA Norway 67.0 Petroleum expl./ref./distr. 43 97 17 74 11 29 34.4<br />
Deutsche Post AG Germany 30.5 Transport and storage 39 50 44 67 258 425 68.3<br />
5.5<br />
Vale SA Brazil<br />
Mining & quarrying 39 102 20 24 13 60 48.2<br />
(12 golden shares)<br />
Petronas - Petroliam Nasional Bhd Malaysia 100 Petroleum expl./ref./distr. 34 126 28 63 8 41 30.7<br />
TeliaSonera AB Sweden 37.3 Telecommunications 32 37 10 14 20 29 73.3<br />
Renault SA France 18.3 Motor vehicles 30 92 29 47 66 121 50.2<br />
Japan Tobacco Inc Japan 50.0 Food, beverages and tobacco 30 42 29 66 25 50 55.4<br />
Finmeccanica Spa Italy 30.2 Machinery and equipment 29 44 20 25 32 73 62.7<br />
China Ocean Shipping (Group) Company China 100 Transport and storage 28 36 18 28 4 72 49.7<br />
Lukoil OAO Russian Federation 13.4 Petroleum and natural gas 24 79 38 68 22 143 34.0<br />
Singapore Telecommunications Ltd Singapore 54.4 Telecommunications 23 27 8 12 10 23 64.3<br />
Zain Kuwait 49.2 Telecommunications 19 20 7 8 12 13 92.1<br />
Qatar Telecom Qatar 55.0 Telecommunications 18 23 5 7 1 2 78.0<br />
Tata Steel Ltd India 12.9 Metal and metal products 16 24 16 22 47 81 65.2<br />
Petroleo Brasileiro SA Brazil 39.8 Petroleum expl./ref./distr. 15 200 29 116 8 77 14.2<br />
Abu Dhabi National Energy Co PJSC United Arab Emirates 100 Utilities (Electricity, gas and water) 14 25 3 5 3 4 67.2<br />
Petróleos de Venezuela SA Venezuela, Bolivarian Rep. of 100 Petroleum expl./ref./distr. 12 150 33 75 5 92 19.0<br />
China National Petroleum Corporation China 100 Petroleum expl./ref./distr. 12 325 5 178 30 1 585 2.7<br />
Source: UNCTAD.<br />
a All data are based on the companies’ annual reports unless otherwise stated.<br />
b Based on most recent data available from Thomson Worldscope (retrieved 31 May 2011).<br />
c Industry classification for companies follows the United States Standard Industrial Classification as used by the United States Securities and Exchange Commission (SEC).<br />
d In a number of cases foreign employment data were calculated by applying the share of foreign employment in total employment of the previous year to total employment of<br />
2009.<br />
e TNI, the Transnationality Index, is calculated as the average of the following three ratios: foreign assets to total assets, foreign sales to total sales and foreign employment to total<br />
employment.