CHAPTER I Global Investment Trends
CHAPTER I Global Investment Trends
CHAPTER I Global Investment Trends

Create successful ePaper yourself
Turn your PDF publications into a flip-book with our unique Google optimized e-Paper software.
22<br />
World <strong>Investment</strong> Report 2011: Non-Equity Modes of International Production and Development<br />
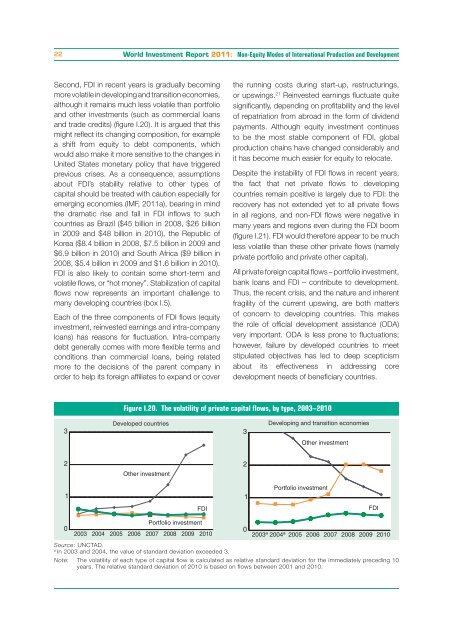
Second, FDI in recent years is gradually becoming<br />
more volatile in developing and transition economies,<br />
although it remains much less volatile than portfolio<br />
and other investments (such as commercial loans<br />
and trade credits) (figure I.20). It is argued that this<br />
might reflect its changing composition, for example<br />
a shift from equity to debt components, which<br />
would also make it more sensitive to the changes in<br />
United States monetary policy that have triggered<br />
previous crises. As a consequence, assumptions<br />
about FDI’s stability relative to other types of<br />
capital should be treated with caution especially for<br />
emerging economies (IMF, 2011a), bearing in mind<br />
the dramatic rise and fall in FDI inflows to such<br />
countries as Brazil ($45 billion in 2008, $26 billion<br />
in 2009 and $48 billion in 2010), the Republic of<br />
Korea ($8.4 billion in 2008, $7.5 billion in 2009 and<br />
$6.9 billion in 2010) and South Africa ($9 billion in<br />
2008, $5.4 billion in 2009 and $1.6 billion in 2010).<br />
FDI is also likely to contain some short-term and<br />
volatile flows, or “hot money”. Stabilization of capital<br />
flows now represents an important challenge to<br />
many developing countries (box I.5).<br />
Each of the three components of FDI flows (equity<br />
investment, reinvested earnings and intra-company<br />
loans) has reasons for fluctuation. Intra-company<br />
debt generally comes with more flexible terms and<br />
conditions than commercial loans, being related<br />
more to the decisions of the parent company in<br />
order to help its foreign affiliates to expand or cover<br />
3<br />
2<br />
1<br />
0<br />
the running costs during start-up, restructurings,<br />
or upswings. 21 Reinvested earnings fluctuate quite<br />
significantly, depending on profitability and the level<br />
of repatriation from abroad in the form of dividend<br />
payments. Although equity investment continues<br />
to be the most stable component of FDI, global<br />
production chains have changed considerably and<br />
it has become much easier for equity to relocate.<br />
Despite the instability of FDI flows in recent years,<br />
the fact that net private flows to developing<br />
countries remain positive is largely due to FDI: the<br />
recovery has not extended yet to all private flows<br />
in all regions, and non-FDI flows were negative in<br />
many years and regions even during the FDI boom<br />
(figure I.21). FDI would therefore appear to be much<br />
less volatile than these other private flows (namely<br />
private portfolio and private other capital).<br />
All private foreign capital flows – portfolio investment,<br />
bank loans and FDI – contribute to development.<br />
Thus, the recent crisis, and the nature and inherent<br />
fragility of the current upswing, are both matters<br />
of concern to developing countries. This makes<br />
the role of official development assistance (ODA)<br />
very important. ODA is less prone to fluctuations;<br />
however, failure by developed countries to meet<br />
stipulated objectives has led to deep scepticism<br />
about its effectiveness in addressing core<br />
development needs of beneficiary countries.<br />
Figure I.20. The volatility of private capital flows, by type, 2003–2010<br />
Developed countries Developing and transition economies<br />
3<br />
Other investment<br />
Portfolio investment<br />
FDI<br />
2003 2004 2005 2006 2007 2008 2009 2010<br />
Source: UNCTAD.<br />
a In 2003 and 2004, the value of standard deviation exceeded 3.<br />
Note: The volatility of each type of capital flow is calculated as relative standard deviation for the immediately preceding 10<br />
years. The relative standard deviation of 2010 is based on flows between 2001 and 2010.<br />
2<br />
1<br />
0<br />
Other investment<br />
Portfolio investment<br />
FDI<br />
2003 a 2004 a 2005 2006 2007 2008 2009 2010