CHAPTER I Global Investment Trends
CHAPTER I Global Investment Trends
CHAPTER I Global Investment Trends

You also want an ePaper? Increase the reach of your titles
YUMPU automatically turns print PDFs into web optimized ePapers that Google loves.
4<br />
World <strong>Investment</strong> Report 2011: Non-Equity Modes of International Production and Development<br />
by a shift in international consumption, in the wake<br />
of which market-seeking FDI is also gaining ground.<br />
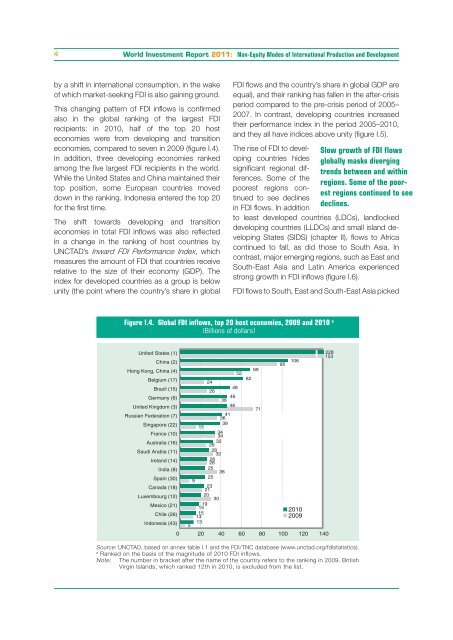
This changing pattern of FDI inflows is confirmed<br />
also in the global ranking of the largest FDI<br />
recipients: in 2010, half of the top 20 host<br />
economies were from developing and transition<br />
economies, compared to seven in 2009 (figure I.4).<br />
In addition, three developing economies ranked<br />
among the five largest FDI recipients in the world.<br />
While the United States and China maintained their<br />
top position, some European countries moved<br />
down in the ranking. Indonesia entered the top 20<br />
for the first time.<br />
The shift towards developing and transition<br />
economies in total FDI inflows was also reflected<br />
in a change in the ranking of host countries by<br />
UNCTAD’s Inward FDI Performance Index, which<br />
measures the amount of FDI that countries receive<br />
relative to the size of their economy (GDP). The<br />
index for developed countries as a group is below<br />
unity (the point where the country’s share in global<br />
FDI flows and the country’s share in global GDP are<br />
equal), and their ranking has fallen in the after-crisis<br />
period compared to the pre-crisis period of 2005–<br />
2007. In contrast, developing countries increased<br />
their performance index in the period 2005–2010,<br />
and they all have indices above unity (figure I.5).<br />
The rise of FDI to developing<br />
countries hides<br />
significant regional differences.<br />
Some of the<br />
poorest regions continued<br />
to see declines<br />
in FDI flows. In addition<br />
to least developed countries (LDCs), landlocked<br />
developing countries (LLDCs) and small island developing<br />
States (SIDS) (chapter II), flows to Africa<br />
continued to fall, as did those to South Asia. In<br />
contrast, major emerging regions, such as East and<br />
South-East Asia and Latin America experienced<br />
strong growth in FDI inflows (figure I.6).<br />
FDI flows to South, East and South-East Asia picked<br />
Figure I.4. <strong>Global</strong> FDI inflows, top 20 host economies, 2009 and 2010 a<br />
(Billions of dollars)<br />
United States (1)<br />
China (2)<br />
Hong Kong, China (4)<br />
Belgium (17)<br />
Brazil (15)<br />
Germany (6)<br />
United Kingdom (3)<br />
Russian Federation (7)<br />
Singapore (22)<br />
France (10)<br />
Australia (16)<br />
Saudi Arabia (11)<br />
Ireland (14)<br />
India (8)<br />
Spain (30)<br />
Canada (18)<br />
Luxembourg (12)<br />
Mexico (21)<br />
Chile (26)<br />
Indonesia (43)<br />
24<br />
26<br />
46<br />
38<br />
46<br />
41<br />
36<br />
39<br />
15<br />
34<br />
34<br />
32<br />
26<br />
28<br />
32<br />
26<br />
26<br />
25<br />
36<br />
25<br />
9<br />
23<br />
21<br />
20<br />
30<br />
19<br />
15<br />
15<br />
13<br />
13<br />
5<br />
Source: UNCTAD, based on annex table I.1 and the FDI/TNC database (www.unctad.org/fdistatistics).<br />
a Ranked on the basis of the magnitude of 2010 FDI inflows.<br />
Note: The number in bracket after the name of the country refers to the ranking in 2009. British<br />
Virgin Islands, which ranked 12th in 2010, is excluded from the list.<br />
48<br />
52<br />
62<br />
69<br />
71<br />
95<br />
106<br />
2010<br />
2009<br />
0 20 40 60 80 100 120 140<br />
Slow growth of FDI flows<br />
globally masks diverging<br />
trends between and within<br />
regions. Some of the poorest<br />
regions continued to see<br />
declines.<br />
228<br />
153