CHAPTER I Global Investment Trends
CHAPTER I Global Investment Trends
CHAPTER I Global Investment Trends

Create successful ePaper yourself
Turn your PDF publications into a flip-book with our unique Google optimized e-Paper software.
<strong>CHAPTER</strong> I <strong>Global</strong> <strong>Investment</strong> <strong>Trends</strong> 31<br />
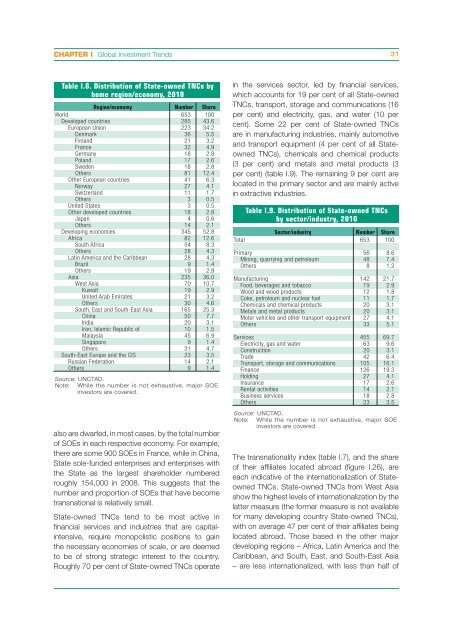
Table I.8. Distribution of State-owned TNCs by<br />
home region/economy, 2010<br />
Region/economy Number Share<br />
World 653 100<br />
Developed countries 285 43.6<br />
European Union 223 34.2<br />
Denmark 36 5.5<br />
Finland 21 3.2<br />
France 32 4.9<br />
Germany 18 2.8<br />
Poland 17 2.6<br />
Sweden 18 2.8<br />
Others 81 12.4<br />
Other European countries 41 6.3<br />
Norway 27 4.1<br />
Switzerland 11 1.7<br />
Others 3 0.5<br />
United States 3 0.5<br />
Other developed countries 18 2.8<br />
Japan 4 0.6<br />
Others 14 2.1<br />
Developing economies 345 52.8<br />
Africa 82 12.6<br />
South Africa 54 8.3<br />
Others 28 4.3<br />
Latin America and the Caribbean 28 4.3<br />
Brazil 9 1.4<br />
Others 19 2.9<br />
Asia 235 36.0<br />
West Asia 70 10.7<br />
Kuwait 19 2.9<br />
United Arab Emirates 21 3.2<br />
Others 30 4.6<br />
South, East and South-East Asia 165 25.3<br />
China 50 7.7<br />
India 20 3.1<br />
Iran, Islamic Republic of 10 1.5<br />
Malaysia 45 6.9<br />
Singapore 9 1.4<br />
Others 31 4.7<br />
South-East Europe and the CIS 23 3.5<br />
Russian Federation 14 2.1<br />
Others 9 1.4<br />
Source: UNCTAD.<br />
Note: While the number is not exhaustive, major SOE<br />
investors are covered.<br />
also are dwarfed, in most cases, by the total number<br />
of SOEs in each respective economy. For example,<br />
there are some 900 SOEs in France, while in China,<br />
State sole-funded enterprises and enterprises with<br />
the State as the largest shareholder numbered<br />
roughly 154,000 in 2008. This suggests that the<br />
number and proportion of SOEs that have become<br />
transnational is relatively small.<br />
State-owned TNCs tend to be most active in<br />
financial services and industries that are capitalintensive,<br />
require monopolistic positions to gain<br />
the necessary economies of scale, or are deemed<br />
to be of strong strategic interest to the country.<br />
Roughly 70 per cent of State-owned TNCs operate<br />
in the services sector, led by financial services,<br />
which accounts for 19 per cent of all State-owned<br />
TNCs, transport, storage and communications (16<br />
per cent) and electricity, gas, and water (10 per<br />
cent). Some 22 per cent of State-owned TNCs<br />
are in manufacturing industries, mainly automotive<br />
and transport equipment (4 per cent of all Stateowned<br />
TNCs), chemicals and chemical products<br />
(3 per cent) and metals and metal products (3<br />
per cent) (table I.9). The remaining 9 per cent are<br />
located in the primary sector and are mainly active<br />
in extractive industries.<br />
Table I.9. Distribution of State-owned TNCs<br />
by sector/industry, 2010<br />
Sector/industry Number Share<br />
Total 653 100<br />
Primary 56 8.6<br />
Mining, quarrying and petroleum 48 7.4<br />
Others 8 1.2<br />
Manufacturing 142 21.7<br />
Food, beverages and tobacco 19 2.9<br />
Wood and wood products 12 1.8<br />
Coke, petroleum and nuclear fuel 11 1.7<br />
Chemicals and chemical products 20 3.1<br />
Metals and metal products 20 3.1<br />
Motor vehicles and other transport equipment 27 4.1<br />
Others 33 5.1<br />
Services 455 69.7<br />
Electricity, gas and water 63 9.6<br />
Construction 20 3.1<br />
Trade 42 6.4<br />
Transport, storage and communications 105 16.1<br />
Finance 126 19.3<br />
Holding 27 4.1<br />
Insurance 17 2.6<br />
Rental activities 14 2.1<br />
Business services 18 2.8<br />
Others 23 3.5<br />
Source: UNCTAD.<br />
Note: While the number is not exhaustive, major SOE<br />
investors are covered.<br />
The transnationality index (table I.7), and the share<br />
of their affiliates located abroad (figure I.26), are<br />
each indicative of the internationalization of Stateowned<br />
TNCs. State-owned TNCs from West Asia<br />
show the highest levels of internationalization by the<br />
latter measure (the former measure is not available<br />
for many developing country State-owned TNCs),<br />
with on average 47 per cent of their affiliates being<br />
located abroad. Those based in the other major<br />
developing regions – Africa, Latin America and the<br />
Caribbean, and South, East, and South-East Asia<br />
– are less internationalized, with less than half of