CHAPTER I Global Investment Trends
CHAPTER I Global Investment Trends
CHAPTER I Global Investment Trends

You also want an ePaper? Increase the reach of your titles
YUMPU automatically turns print PDFs into web optimized ePapers that Google loves.
<strong>CHAPTER</strong> I <strong>Global</strong> <strong>Investment</strong> <strong>Trends</strong> 33<br />
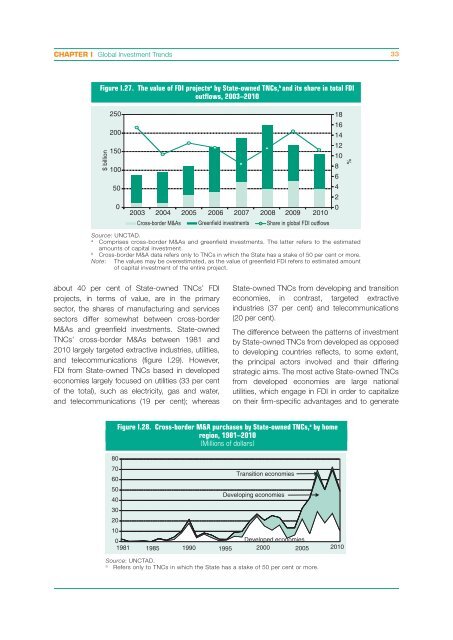
Figure I.27. The value of FDI projects a by State-owned TNCs, b and its share in total FDI<br />
outflows, 2003–2010<br />
$ billion<br />
250<br />
200<br />
150<br />
100<br />
50<br />
0<br />
2003 2004 2005 2006 2007 2008 2009 2010<br />
about 40 per cent of State-owned TNCs’ FDI<br />
projects, in terms of value, are in the primary<br />
sector, the shares of manufacturing and services<br />
sectors differ somewhat between cross-border<br />
M&As and greenfield investments. State-owned<br />
TNCs’ cross-border M&As between 1981 and<br />
2010 largely targeted extractive industries, utilities,<br />
and telecommunications (figure I.29). However,<br />
FDI from State-owned TNCs based in developed<br />
economies largely focused on utilities (33 per cent<br />
of the total), such as electricity, gas and water,<br />
and telecommunications (19 per cent); whereas<br />
Cross-border M&As Greenfield investments Share in global FDI outflows<br />
Source: UNCTAD.<br />
a Comprises cross-border M&As and greenfield investments. The latter refers to the estimated<br />
amounts of capital investment.<br />
b Cross-border M&A data refers only to TNCs in which the State has a stake of 50 per cent or more.<br />
Note: The values may be overestimated, as the value of greenfield FDI refers to estimated amount<br />
of capital investment of the entire project.<br />
80<br />
70<br />
60<br />
50<br />
40<br />
30<br />
20<br />
10<br />
State-owned TNCs from developing and transition<br />
economies, in contrast, targeted extractive<br />
industries (37 per cent) and telecommunications<br />
(20 per cent).<br />
The difference between the patterns of investment<br />
by State-owned TNCs from developed as opposed<br />
to developing countries reflects, to some extent,<br />
the principal actors involved and their differing<br />
strategic aims. The most active State-owned TNCs<br />
from developed economies are large national<br />
utilities, which engage in FDI in order to capitalize<br />
on their firm-specific advantages and to generate<br />
Figure I.28. Cross-border M&A purchases by State-owned TNCs, a by home<br />
region, 1981–2010<br />
(Millions of dollars)<br />
Transition economies<br />
Developing economies<br />
0<br />
Developed economies<br />
1981 1985 1990 1995 2000 2005 2010<br />
Source: UNCTAD.<br />
a Refers only to TNCs in which the State has a stake of 50 per cent or more.<br />
18<br />
16<br />
14<br />
12<br />
10<br />
8<br />
6<br />
4<br />
2<br />
0<br />
%