CHAPTER I Global Investment Trends
CHAPTER I Global Investment Trends
CHAPTER I Global Investment Trends

You also want an ePaper? Increase the reach of your titles
YUMPU automatically turns print PDFs into web optimized ePapers that Google loves.
8<br />
World <strong>Investment</strong> Report 2011: Non-Equity Modes of International Production and Development<br />
Russian Federation, India and China – have gained<br />
ground as important investors in recent years as<br />
the result of rapid economic growth in their home<br />
countries, abundant financial resources and strong<br />
motivations to acquire resources and strategic<br />
assets abroad (section C).<br />
In 2010 there were seven mega-deals (over<br />
$3 billion) involving developing and transition<br />
economies (or 12 per cent of the total) (annex table<br />
I.7), compared to only two (or 3 per cent of the total)<br />
in 2009. Firms from developing Asia expanded their<br />
acquisitions in 2010 beyond their own regions. For<br />
example China’s outward FDI showed substantial<br />
increases in Latin America (chapter II; ECLAC,<br />
2011). Transition-economy firms also increased<br />
their purchases in other transition economies in<br />
2010.<br />
b. FDI by sector and industry<br />
In the aftermath of the<br />
crisis, FDI in manufacturing<br />
bounced back while<br />
services sector FDI is still<br />
in decline.<br />
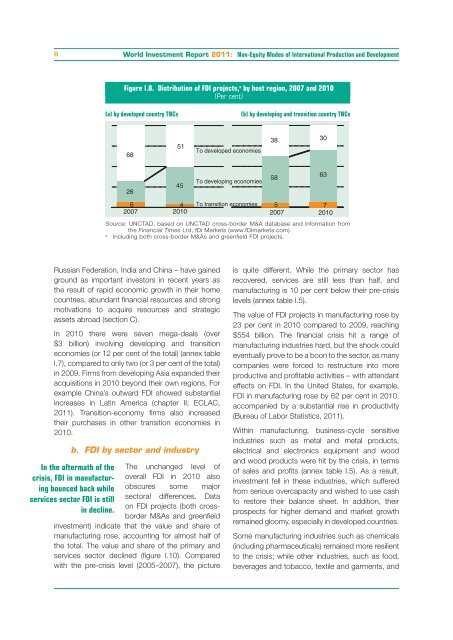
Figure I.8. Distribution of FDI projects, a by host region, 2007 and 2010<br />
(Per cent)<br />
(a) by developed country TNCs<br />
68<br />
26<br />
6 4 To transition economies 5 7<br />
2007 2010 2007 2010<br />
Source: UNCTAD, based on UNCTAD cross-border M&A database and information from<br />
the Financial Times Ltd, fDi Markets (www.fDimarkets.com).<br />
a Including both cross-border M&As and greenfield FDI projects.<br />
The unchanged level of<br />
overall FDI in 2010 also<br />
obscures some major<br />
sectoral differences. Data<br />
on FDI projects (both crossborder<br />
M&As and greenfield<br />
investment) indicate that the value and share of<br />
manufacturing rose, accounting for almost half of<br />
the total. The value and share of the primary and<br />
services sector declined (figure I.10). Compared<br />
with the pre-crisis level (2005–2007), the picture<br />
51<br />
45<br />
To developed economies<br />
To developing economies<br />
(b) by developing and transition country TNCs<br />
38<br />
58<br />
is quite different. While the primary sector has<br />
recovered, services are still less than half, and<br />
manufacturing is 10 per cent below their pre-crisis<br />
levels (annex table I.5).<br />
The value of FDI projects in manufacturing rose by<br />
23 per cent in 2010 compared to 2009, reaching<br />
$554 billion. The financial crisis hit a range of<br />
manufacturing industries hard, but the shock could<br />
eventually prove to be a boon to the sector, as many<br />
companies were forced to restructure into more<br />
productive and profitable activities – with attendant<br />
effects on FDI. In the United States, for example,<br />
FDI in manufacturing rose by 62 per cent in 2010,<br />
accompanied by a substantial rise in productivity<br />
(Bureau of Labor Statistics, 2011).<br />
Within manufacturing, business-cycle sensitive<br />
industries such as metal and metal products,<br />
electrical and electronics equipment and wood<br />
and wood products were hit by the crisis, in terms<br />
of sales and profits (annex table I.5). As a result,<br />
investment fell in these industries, which suffered<br />
from serious overcapacity and wished to use cash<br />
to restore their balance sheet. In addition, their<br />
prospects for higher demand and market growth<br />
remained gloomy, especially in developed countries.<br />
Some manufacturing industries such as chemicals<br />
(including pharmaceuticals) remained more resilient<br />
to the crisis; while other industries, such as food,<br />
beverages and tobacco, textile and garments, and<br />
30<br />
63