Matrix metalloproteinases (MMPs): Chemical–biological functions ...
Matrix metalloproteinases (MMPs): Chemical–biological functions ...
Matrix metalloproteinases (MMPs): Chemical–biological functions ...

Create successful ePaper yourself
Turn your PDF publications into a flip-book with our unique Google optimized e-Paper software.
2238 R. P. Verma, C. Hansch / Bioorg. Med. Chem. 15 (2007) 2223–2268<br />
Table 6. Description about the physicochemical parameters used for the QSAR models listed in Table 5<br />
No. Physicochemical parameter Description<br />
1 logP or ClogP Hydrophobicity of the molecules<br />
2 logPo Optimum value of hydrophobicity for the molecules<br />
3 p Hydrophobicity of the substituents<br />
4 NVE Number of valence electron<br />
5<br />
1 v<br />
v Kier’s first-order valence molecular connectivity index ( 1 v v ) of the substituents/molecules<br />
6 Si Electrotopological state (E-state) indices (Si) of the atom: measure of the availability of p or<br />
lone pair electrons on the atom<br />
7 SN (E-state) indices nitrogen atom: availability of p or lone pair electrons on the nitrogen atom.<br />
8 SS (E-state) indices sulfur atom: availability of p or lone pair electrons on the sulfur atom.<br />
9 r Sigma (electronic parameter)<br />
10 MR Molar refractivity<br />
11 Pol Polarizability<br />
the QSAR are executed with the C-QSAR program. 100<br />
The parameters used in this review have already been<br />
discussed in detail along with their application. 79 Briefly,<br />
ClogP is the calculated partition coefficient in n-octanol/<br />
water and is a measure of hydrophobicity, and p is the<br />
hydrophobic parameter for substituents. Cp is the calculated<br />
hydrophobic parameter of the substituents. r, r + ,<br />
and r are Hammett electronic parameters that apply<br />
to substituent effects on aromatic systems. B1, B5, and<br />
L are Verloop’s sterimol parameters for substituents. 101<br />
B1 is a measure of the minimum width of a substituent,<br />
B5 is an attempt to define maximum width of the whole<br />
substituent, and L is the substituent length.<br />
CMR is the calculated molar refractivity for the whole<br />
molecule. MR is calculated from the Lorentz–Lorenz<br />
equation and is described as follows: [(n 2<br />
1)/<br />
(n 2 + 2)](MW/d), where n is the refractive index, MW<br />
is the molecular weight, and d is the density of the substance.<br />
MR is dependent on volume and polarizability.<br />
It can be used for a substituent or for the whole molecule.<br />
A new polarizability parameter, NVE, was developed,<br />
which is shown to be effective at delineating<br />
various chemico-biological interactions. 85,102–104 NVE<br />
represents the total number of valence electrons and is<br />
calculated by simply summing up the valence electrons<br />
in a molecule, that is, H = 1, C = 4, Si = 4, N = 5,<br />
P = 5, O = 6, S = 6, and halogens = 7. It may also be<br />
represented as: NVE = nr + np + nn, where nr is the<br />
number of electrons in r-orbital, np is the number of<br />
electrons in p-orbitals, and nn is the number of lone pair<br />
electrons. MgVol is the molar volume for the whole<br />
molecule. 105 The indicator variable I is assigned the<br />
value of 1 or 0 for special features with special effects<br />
that cannot be parametrized and has been explained<br />
wherever used.<br />
In QSAR equations, n is the number of data points, r is<br />
the correlation coefficient between observed values of<br />
the dependent and the values calculated from the equation,<br />
r 2 is the square of the correlation coefficient representing<br />
the goodness of fit, q 2 is the cross-validated r 2 (a<br />
measure of the quality of the QSAR model), and s is<br />
the standard deviation. The cross-validated r 2 (q 2 ) is<br />
obtained by using leave-one-out (LOO) procedure as<br />
described by Cramer et al. 106 Q is the quality factor (quality<br />
ratio), where Q = r/s. Chance correlation, due to the<br />
excessive number of parameter (which increases the r<br />
and s values also), can, thus, be detected by the examination<br />
of Q value. F is the Fischer statistics (Fischer ratio),<br />
F = fr 2 /[(1 r 2 )m], where f is the number of degree of<br />
freedom, f = n (m+1), n is the number of data points<br />
and m is the number of variables. The modeling was<br />
taken to be optimal when Q reached a maximum together<br />
with F, even if slightly nonoptional F values have<br />
normally been accepted. A significant decrease in F<br />
with the introduction of one additional variable (with<br />
increasing Q and decreasing s) could mean that the new<br />
descriptor is not as good as expected, that is, its introduction<br />
has endangered the statistical quality of the<br />
combination that nevertheless can again improve with<br />
the ulterior introduction of a more convincing descriptor.<br />
107 Compounds were assigned to be outliers on the<br />
basis of their deviation between observed and calculated<br />
activities from the equation (>2s). 108 Each regression<br />
equation includes 95% confidence limits for each term<br />
in parentheses.<br />
All the new QSARs reported here are derived by us and<br />
were not formulated by the original authors. These<br />
QSARs are found to be statistically significant, which<br />
fulfill the conditions given by Golbraikh and Tropsha 109<br />
as the acceptable models. These models also fulfill the<br />
condition of (number of data points)/(number of<br />
descriptors) P 4. For a list of outliers in each data set,<br />
refer to the corresponding tables.<br />
10.2.2. Results and discussion<br />
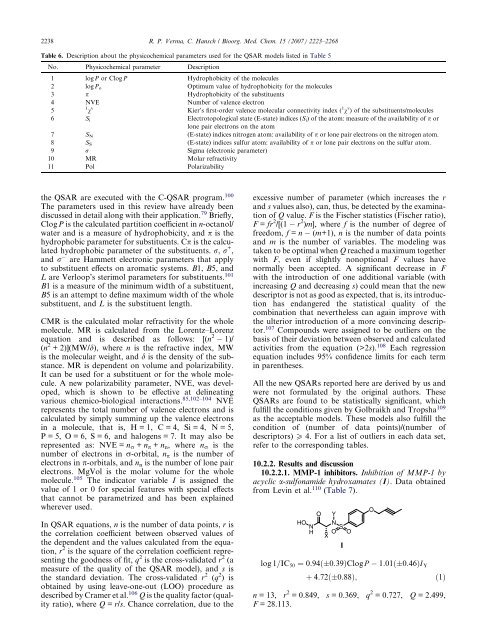
10.2.2.1. MMP-1 inhibitors. Inhibition of MMP-1 by<br />
acyclic a-sulfonamide hydroxamates (I). Data obtained<br />
from Levin et al. 110 (Table 7).<br />
O Y<br />
HO<br />
NH<br />
N<br />
S<br />
O<br />
X<br />
I<br />
O<br />
log 1=IC50 ¼ 0:94ð 0:39ÞClogP 1:01ð 0:46ÞI Y<br />
O<br />
þ 4:72ð 0:88Þ; ð1Þ<br />
n = 13, r 2 = 0.849, s = 0.369, q 2 = 0.727, Q = 2.499,<br />
F = 28.113.