Matrix metalloproteinases (MMPs): Chemical–biological functions ...
Matrix metalloproteinases (MMPs): Chemical–biological functions ...
Matrix metalloproteinases (MMPs): Chemical–biological functions ...

You also want an ePaper? Increase the reach of your titles
YUMPU automatically turns print PDFs into web optimized ePapers that Google loves.
2260 R. P. Verma, C. Hansch / Bioorg. Med. Chem. 15 (2007) 2223–2268<br />
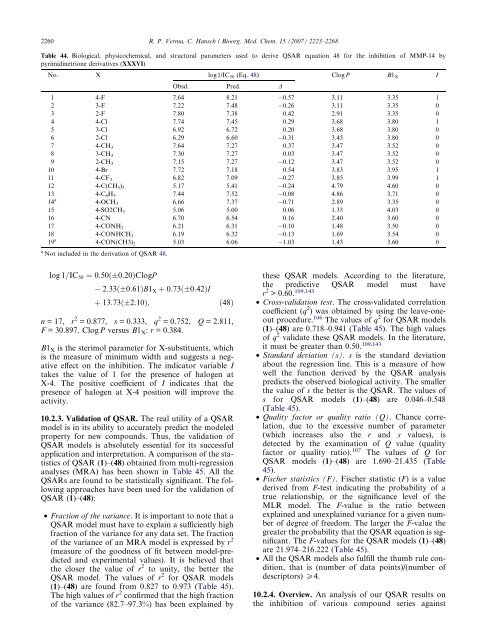
Table 44. Biological, physicochemical, and structural parameters used to derive QSAR equation 48 for the inhibition of MMP-14 by<br />
pyrimidinetrione derivatives (XXXVI)<br />
No. X log1/IC50 (Eq. 48) ClogP B1X I<br />
Obsd. Pred. D<br />
1 4-F 7.64 8.21 0.57 3.11 3.35 1<br />
2 3-F 7.22 7.48 0.26 3.11 3.35 0<br />
3 2-F 7.80 7.38 0.42 2.91 3.35 0<br />
4 4-Cl 7.74 7.45 0.29 3.68 3.80 1<br />
5 3-Cl 6.92 6.72 0.20 3.68 3.80 0<br />
6 2-Cl 6.29 6.60 0.31 3.45 3.80 0<br />
7 4-CH3 7.64 7.27 0.37 3.47 3.52 0<br />
8 3-CH3 7.30 7.27 0.03 3.47 3.52 0<br />
9 2-CH3 7.15 7.27 0.12 3.47 3.52 0<br />
10 4-Br 7.72 7.18 0.54 3.83 3.95 1<br />
11 4-CF3 6.82 7.09 0.27 3.85 3.99 1<br />
12 4-C(CH3) 3 5.17 5.41 0.24 4.79 4.60 0<br />
13<br />
14<br />
4-C6H5 7.44 7.52 0.08 4.86 3.71 0<br />
a<br />
4-OCH3 6.66 7.37 0.71 2.89 3.35 0<br />
15 4-SO2CH3 5.06 5.00 0.06 1.33 4.03 0<br />
16 4-CN 6.70 6.54 0.16 2.40 3.60 0<br />
17 4-CONH2 6.21 6.31 0.10 1.48 3.50 0<br />
18<br />
19<br />
4-CONHCH3 6.19 6.32 0.13 1.69 3.54 0<br />
a<br />
4-CON(CH3) 2 5.03 6.06 1.03 1.43 3.60 0<br />
a Not included in the derivation of QSAR 48.<br />
log 1=IC50 ¼ 0:50ð 0:20ÞClogP<br />
2:33ð 0:61ÞB1X þ 0:73ð 0:42ÞI<br />
þ 13:73ð 2:10Þ; ð48Þ<br />
n =17, r 2 = 0.877, s = 0.333, q 2 = 0.752, Q = 2.811,<br />
F = 30.897. Clog P versus B1 X: r = 0.384.<br />
B1X is the sterimol parameter for X-substituents, which<br />
is the measure of minimum width and suggests a negative<br />
effect on the inhibition. The indicator variable I<br />
takes the value of 1 for the presence of halogen at<br />
X-4. The positive coefficient of I indicates that the<br />
presence of halogen at X-4 position will improve the<br />
activity.<br />
10.2.3. Validation of QSAR. The real utility of a QSAR<br />
model is in its ability to accurately predict the modeled<br />
property for new compounds. Thus, the validation of<br />
QSAR models is absolutely essential for its successful<br />
application and interpretation. A comparison of the statistics<br />
of QSAR (1)–(48) obtained from multi-regression<br />
analyses (MRA) has been shown in Table 45. All the<br />
QSARs are found to be statistically significant. The following<br />
approaches have been used for the validation of<br />
QSAR (1)–(48):<br />
• Fraction of the variance. It is important to note that a<br />
QSAR model must have to explain a sufficiently high<br />
fraction of the variance for any data set. The fraction<br />
of the variance of an MRA model is expressed by r 2<br />
(measure of the goodness of fit between model-predicted<br />
and experimental values). It is believed that<br />
the closer the value of r 2 to unity, the better the<br />
QSAR model. The values of r 2 for QSAR models<br />
(1)–(48) are found from 0.827 to 0.973 (Table 45).<br />
The high values of r 2 confirmed that the high fraction<br />
of the variance (82.7–97.3%) has been explained by<br />
these QSAR models. According to the literature,<br />
the predictive QSAR model must have<br />
r 2 > 0.60. 109,143<br />
• Cross-validation test. The cross-validated correlation<br />
coefficient (q 2 ) was obtained by using the leave-oneout<br />
procedure. 106 The values of q 2 for QSAR models<br />
(1)–(48) are 0.718–0.941 (Table 45). The high values<br />
of q 2 validate these QSAR models. In the literature,<br />
it must be greater than 0.50. 109,143<br />
• Standard deviation (s). s is the standard deviation<br />
about the regression line. This is a measure of how<br />
well the function derived by the QSAR analysis<br />
predicts the observed biological activity. The smaller<br />
the value of s the better is the QSAR. The values of<br />
s for QSAR models (1)–(48) are 0.046–0.548<br />
(Table 45).<br />
• Quality factor or quality ratio (Q). Chance correlation,<br />
due to the excessive number of parameter<br />
(which increases also the r and s values), is<br />
detected by the examination of Q value (quality<br />
factor or quality ratio). 107 The values of Q for<br />
QSAR models (1)–(48) are 1.690–21.435 (Table<br />
45).<br />
• Fischer statistics (F). Fischer statistic (F) is a value<br />
derived from F-test indicating the probability of a<br />
true relationship, or the significance level of the<br />
MLR model. The F-value is the ratio between<br />
explained and unexplained variance for a given number<br />
of degree of freedom. The larger the F-value the<br />
greater the probability that the QSAR equation is significant.<br />
The F-values for the QSAR models (1)–(48)<br />
are 21.974–216.222 (Table 45).<br />
• All the QSAR models also fulfill the thumb rule condition,<br />
that is (number of data points)/(number of<br />
descriptors) P4.<br />
10.2.4. Overview. An analysis of our QSAR results on<br />
the inhibition of various compound series against