Bombardier Business Aircraft | Market Forecast 2011-2030 - Learjet ...
Bombardier Business Aircraft | Market Forecast 2011-2030 - Learjet ...
Bombardier Business Aircraft | Market Forecast 2011-2030 - Learjet ...

Create successful ePaper yourself
Turn your PDF publications into a flip-book with our unique Google optimized e-Paper software.
current market drivers<br />
US <strong>Business</strong> Jet Utilization<br />
All business jets, Thousand departures and landings, 2009-<strong>2011</strong><br />
-30%<br />
826<br />
Source: FAA.<br />
-24%<br />
874<br />
-12%<br />
0%<br />
927 945 960<br />
16% 15%<br />
10%<br />
8%<br />
5%<br />
1,001 1,018 1,019 1,006<br />
Q1 09 Q2 09 Q3 09 Q4 09 Q1 10 Q2 10 Q3 10 Q4 10 Q1 11<br />
Departures and Landings ('000) Departures and Landings Growth YoY (%)<br />
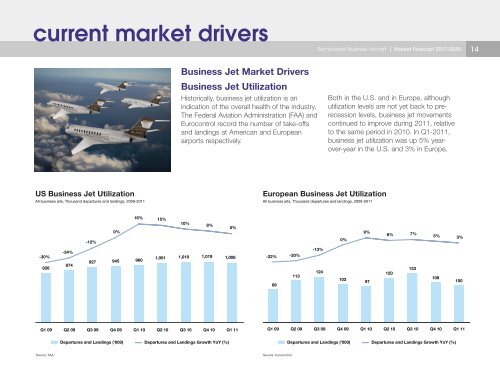
<strong>Business</strong> Jet <strong>Market</strong> Drivers<br />
<strong>Business</strong> Jet Utilization<br />
Historically, business jet utilization is an<br />
indication of the overall health of the industry.<br />
The Federal Aviation Administration (FAA) and<br />
Eurocontrol record the number of take-offs<br />
and landings at American and European<br />
airports respectively.<br />
<strong>Bombardier</strong> <strong>Business</strong> <strong>Aircraft</strong> | <strong>Market</strong> <strong>Forecast</strong> <strong>2011</strong>-<strong>2030</strong> 14<br />
European <strong>Business</strong> Jet Utilization<br />
All business jets, Thousand departures and landings, 2009-<strong>2011</strong><br />
-22%<br />
89<br />
Source: Eurocontrol.<br />
-20%<br />
113<br />
-13%<br />
124<br />
Both in the U.S. and in Europe, although<br />
utilization levels are not yet back to prerecession<br />
levels, business jet movements<br />
continued to improve during <strong>2011</strong>, relative<br />
to the same period in 2010. In Q1-<strong>2011</strong>,<br />
business jet utilization was up 5% yearover-year<br />
in the U.S. and 3% in Europe.<br />
0%<br />
103<br />
9%<br />
97<br />
Departures and Landings ('000) Departures and Landings Growth YoY (%)<br />
6%<br />
120<br />
7%<br />
133<br />
5% 3%<br />
Q1 09 Q2 09 Q3 09 Q4 09 Q1 10 Q2 10 Q3 10 Q4 10 Q1 11<br />
108<br />
100