reSolution_LNT_No1_en - Leica Microsystems
reSolution_LNT_No1_en - Leica Microsystems
reSolution_LNT_No1_en - Leica Microsystems

Create successful ePaper yourself
Turn your PDF publications into a flip-book with our unique Google optimized e-Paper software.
INDUSTRY<br />
20 reSOLUTION<br />
Furthermore these marks are asymmetric about the EP rubber<br />
domain and appear to be most promin<strong>en</strong>t at the bottom<br />
of the domain, though stretch marks are also observed on<br />
the top portion of the domain. The sample was allowed<br />
to sit overnight at 1.7% elongation and the next morning<br />
revealed a disappearance of the stretch marks as shown in<br />
the AFM image of Figure 1c, suggesting the yielding of the<br />
PP matrix overnight.<br />
Finally, the effect of the stress within the PP matrix at 2%<br />
elongation is shown in Figure 2. Both topography (a) and<br />
phase (b) images of a large-area (15um) scan size show a<br />
number of areas where cracks have formed at the EP-PP<br />
interface and propagated into the PP matrix; some of the<br />
cracks are highlighted in blue/orange circles. The developm<strong>en</strong>ts<br />
of cracks or shear bands and micro-voids may come<br />
from stress amplifi cation in the ICP material due to the pres<strong>en</strong>ce<br />
of EP rubber domains. Maximum stress amplifi cation<br />
by a spherical EP rubber domain is inversely proportional<br />
to the square root of the crack tip radius and occurs at the<br />
poles of the EP rubber domain. All these cracks and shear<br />
bands in Figure 2 appear to originate at the polar locations<br />
of the EP rubber domains, probably at sharp corners of the<br />
rubber domain with extremely small crack tip radii (and<br />
therefore maximum stress amplifi cation resulting in a stress<br />
singularity at that point). The appearance of these shear<br />
bands and micro-voids suggests that the local stresses well<br />
exceed the yield stress despite the 2% global deformation.<br />
The larger cracks propagate several microns within the<br />
polypropyl<strong>en</strong>e matrix. However, there are also several<br />
cracks with signifi cantly smaller dim<strong>en</strong>sions of a couple<br />
hundred nm in l<strong>en</strong>gth and t<strong>en</strong>s of nm in width. Zooming in<br />
on the crack circled in orange from Figure 2 is shown in<br />
Figure 3 and reveals tiny PP fi brils stretching across the<br />
<strong>en</strong>tire width of the track, as shown in the corresponding<br />
topography 3(a) and phase 3(b) images, at about 45 degree<br />
to the stretching direction suggesting that the cracking is<br />
induced by shear deformation. This particular crack is measured<br />
to be ~80 nm in depth and ~600 nm in width.<br />
Summary<br />
Morphology and interface adhesion of an impact copolymer<br />
(ICP) were studied using atomic force microscopy. Effects<br />
of deformation were observed within both PP and EP<br />
compon<strong>en</strong>ts as well as at the interface betwe<strong>en</strong> the two<br />
materials. A continued stretching of the ICP could lead to<br />
delamination of EP from PP matrix. The strain required to<br />
separate the EP domains from the PP matrix could be used<br />
as a measure of the interfacial adhesion betwe<strong>en</strong> EP and<br />
PP. Most importantly, the corresponding local interfacial<br />
stretching ext<strong>en</strong>t or void l<strong>en</strong>gth betwe<strong>en</strong> EP and PP upon<br />
delamination, which can be measured directly by AFM, can<br />
be used to calculate the interfacial str<strong>en</strong>gth betwe<strong>en</strong> EP<br />
and PP. Pres<strong>en</strong>tly, there are no direct measurem<strong>en</strong>t methods<br />
available to determine interfacial adhesive str<strong>en</strong>gth<br />
of nano- and microscale domains within polymer bl<strong>en</strong>ds,<br />
especially bl<strong>en</strong>ds g<strong>en</strong>erated in situ in polymerization reactors.<br />
This AFM examination of micro-domain deformation<br />
described qualitatively here could be used for direct determination<br />
of interfacial adhesion in complex polymer containing<br />
materials such as bl<strong>en</strong>ds and composites.<br />
Figures reproduction permission<br />
Figures 1, 2, and 3 are reprinted with permission from<br />
Microscopy and Analysis 25(3):11-13 (AM), 2011, Copyright<br />
2011 John Wiley and Sons Ltd.<br />
Contact<br />
Dr. Dalia G. Yablon<br />
Corporate Strategic Research<br />
ExxonMobil Research and Engineering<br />
Annandale, NJ<br />
dalia.g.yablon@exxonmobil.com<br />
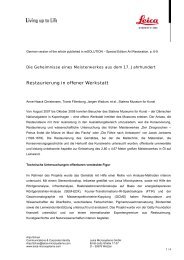
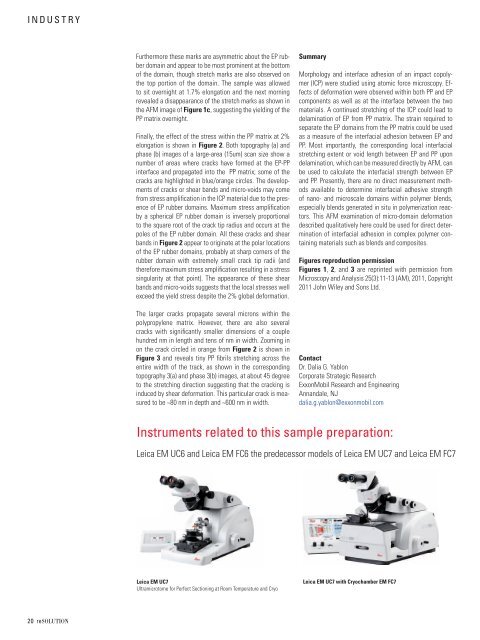
Instrum<strong>en</strong>ts related to this sample preparation:<br />
<strong>Leica</strong> EM UC6 and <strong>Leica</strong> EM FC6 the predecessor models of <strong>Leica</strong> EM UC7 and <strong>Leica</strong> EM FC7<br />
<strong>Leica</strong> EM UC7<br />
Ultramicrotome for Perfect Sectioning at Room Temperature and Cryo<br />
<strong>Leica</strong> EM UC7 with Cryochamber EM FC7