reSolution_LNT_No1_en - Leica Microsystems
reSolution_LNT_No1_en - Leica Microsystems
reSolution_LNT_No1_en - Leica Microsystems

Create successful ePaper yourself
Turn your PDF publications into a flip-book with our unique Google optimized e-Paper software.
No. 01, Autumn 2012<br />
CUSTOMER MAGAZINE<br />
FOR NANOTECHNOLOGY<br />
reSOLUTION
EDITORIAL<br />
CONTENT<br />
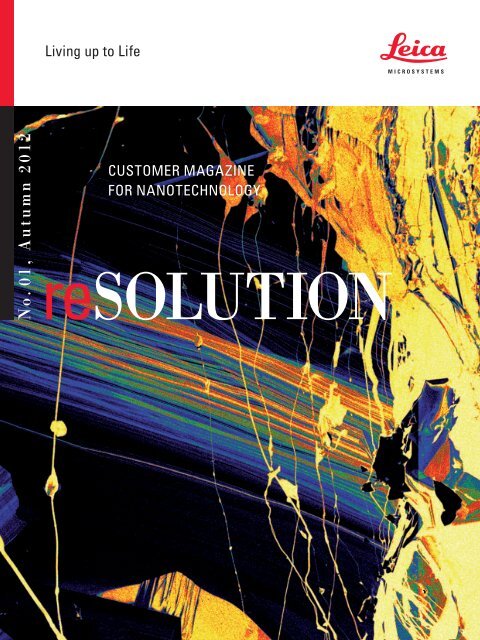
Title<br />
Panchromatic cathodoluminesc<strong>en</strong>ce image of<br />
cassiterite mineral (SnO 2 )<br />
Image Credits<br />
Scott Wight1 , Ed Vic<strong>en</strong>zi2 , Doug Meier1 , and<br />
Kurt B<strong>en</strong>kstein1 1 National Institute of Standards and<br />
Technology<br />
2 Smithsonian Institution<br />
Source: Smithsonial National Mineral<br />
Collection, Preparation: Cut and polished<br />
with the <strong>Leica</strong> EM TXP Data Collection:<br />
FEI Company QuantaTM 200F SEM with<br />
Gatan, MonoCL4 Elite System<br />
2 reSOLUTION<br />
Dear Readers,<br />
It gives me great pleasure to welcome you to the <strong>Leica</strong> NanoTechnology (<strong>LNT</strong>) edition of <strong>reSolution</strong> magazine. As<br />
it is our first totally exclusive <strong>LNT</strong> magazine, we decided to provide information on application techniques for both<br />
biology and materials sample preparation. All of the articles were prepared by our customers from around the<br />
world and I would like to express our thanks to everyone who provided the high quality articles for this edition.<br />
Sharing such experi<strong>en</strong>ces helps to disseminate techniques and applications around our EM community.<br />
To provide further support for issues regarding sample preparation techniques, later in the year we will launch<br />
a <strong>Leica</strong> EM Sample Preparation Sci<strong>en</strong>ce Laboratory online service where you will be able to find ev<strong>en</strong> more<br />
information about applications and products specific to your needs.<br />
Late last year we launched three new products to <strong>en</strong>hance sample preparation in your laboratory; a new ion<br />
beam slope cutter, the TIC 3X, for materials SEM preparation; a critical point dryer, CPD300 - a prerequisite for<br />
good SEM preparation for biological and some materials samples; and an <strong>en</strong>try level high pressure freezer for<br />
freezing samples in tubes, the SPF. You can find more information about these instrum<strong>en</strong>ts on our website at<br />
http://www.leica-microsystems.com/products/electron-microscope-sample-preparation/<br />
This year we have also launched some exciting new products. A new family of coaters, the ACE range, was<br />
pres<strong>en</strong>ted at the EMC meeting in Manchester UK. This new g<strong>en</strong>eration of coating systems continues in line<br />
with our developm<strong>en</strong>t philosophy, to automate tedious processes and push forward the boundaries of sample<br />
preparation in line with the needs of the sci<strong>en</strong>tific community.<br />
I hope you <strong>en</strong>joy this first <strong>LNT</strong> <strong>reSolution</strong> magazine and I look forward to your feedback.<br />
Happy Reading! ding!<br />
Best Wishes, es,<br />
Ian Lamswood wood<br />
Marketing Manager<br />
BIOLOGY<br />
Capturing neuro transmitter receptors 04<br />
and ion channels:<br />
High-resolution techniques to localize<br />
membrane proteins<br />
Biological Electron Microscopy at 07<br />
Durham University<br />
Dr. Martin W. Goldberg, Durham University, UK<br />
Substitutes for Uranyl Acetate in TEM 09<br />
Thin Section Post-Staining<br />
Perusing alternatives for staining applications<br />
for TEM thin sections<br />
Dry ultrathin sectioning combined with 13<br />
high pressure freezing/freeze-substitution<br />
improves ret<strong>en</strong>tion and visualization of<br />
calcium and phosphorus ions prior to nucleation<br />
of mineral crystals within osteoblastic<br />
cultures<br />
INDUSTRY<br />
A Word on Cathodoluminesc<strong>en</strong>ce 17<br />
Atomic Force Microscopy Study of a 19<br />
Stretched Impact Copolymer<br />
University of Wollongong Electron 21<br />
Microscopy C<strong>en</strong>tre<br />
REGISTRATION 23<br />
IMPRINT 23
Capturing Neurotransmitter Receptors and Ion Channels<br />
High-resolution Techniques<br />
to Localize Membrane Proteins<br />
Daniel Althof1,2 , Akos Kulik1,3 1Departm<strong>en</strong>t of Anatomy and Cell Biology, Institute of Neuroanatomy<br />
2Spemann Graduate School of Biology and Medicine, University of Freiburg, Germany<br />
3Departm<strong>en</strong>t of Physiology II, University of Freiburg, Germany<br />
Neurotransmitter receptors and ion channels in the c<strong>en</strong>tral<br />
nervous system are localized to synaptic and extrasynaptic<br />
membrane compartm<strong>en</strong>ts of pre- and postsynaptic elem<strong>en</strong>ts<br />
of neurons. The impact of the activation of these<br />
proteins on synaptic integration and regulation of transmitter<br />
release dep<strong>en</strong>ds on their precise location relative to<br />
synapses, as well as on the d<strong>en</strong>sity and coupling of molecules<br />
in microcompartm<strong>en</strong>ts of the cells. High-resolution<br />
qualitative and quantitative visualization of membranebound<br />
receptors and ion channels is, therefore, ess<strong>en</strong>tial<br />
for understanding their roles in cell communication.<br />
The ability of the nervous system to learn and respond to<br />
the <strong>en</strong>vironm<strong>en</strong>t refl ects an underlying capability of neurons<br />
to dynamically alter the number, type, and str<strong>en</strong>gths<br />
of their connections. These connections, called synapses,<br />
are highly organized sites of contact betwe<strong>en</strong> postsynaptic<br />
neurons and presynaptic terminals. The specialized synaptic<br />
membrane, contains a large variety of molecules such<br />
as receptors, ion channels, and associated structural proteins,<br />
whose precise subcellular organization facilitates its<br />
proper function. A large number of studies have provided<br />
evid<strong>en</strong>ce that the location of these proteins and their position<br />
relative to synapses substantially affects their functional<br />
roles. Neurotransmitter receptors, localized to the<br />
synaptic membrane of postsynaptic compartm<strong>en</strong>ts of neurons,<br />
are directly exposed to released neurotransmitters.<br />
Consequ<strong>en</strong>tly, they are activated in a transi<strong>en</strong>t manner,<br />
g<strong>en</strong>erating fast postsynaptic responses that are precisely<br />
time-locked to the presynaptic action pot<strong>en</strong>tials. In contrast,<br />
receptors localized to the extrasynaptic plasma membrane,<br />
remote from synaptic sites, are activated by spilledover<br />
neurotransmitters producing a tonic conductance that<br />
is not precisely time-locked to single presynaptic action<br />
pot<strong>en</strong>tials, but rather refl ects the whole network activity<br />
on a slower time scale 1 . Receptors can also be located<br />
presynaptically either on the extrasynaptic membrane of<br />
axon terminals or over the presynaptic grid where they are<br />
activated by neurotransmitters released by the same or by<br />
neighbouring boutons. Like neurotransmitter receptors,<br />
ion channels are also localized to the somato-d<strong>en</strong>dritic<br />
membranes and axon terminals of neurons. Postsynaptic<br />
channels are g<strong>en</strong>erally playing a role in the integration and<br />
plasticity of synaptic inputs, as well as in the control of<br />
neuronal excitation by mediating slow inhibitory synaptic<br />
responses and contributing to the resting membrane pot<strong>en</strong>tial.<br />
Presynaptic channels that are conc<strong>en</strong>trated either at the<br />
presynaptic active zone or localized to the extrasynaptic<br />
membrane of boutons are involved in the regulation of neurotransmitter<br />
release, thereby playing a role in the presynaptic<br />
modulation of neuronal activity. It is, therefore, easy<br />
to understand that the same receptor and ion channel could<br />
fulfi ll very differ<strong>en</strong>t functional requirem<strong>en</strong>ts wh<strong>en</strong> targeted<br />
to differ<strong>en</strong>t subcellular compartm<strong>en</strong>ts of cells 1 .<br />
Furthermore, the impact of the activation of membrane<br />
proteins on synaptic integration and<br />
regulation of transmitter release<br />
critically dep<strong>en</strong>ds on the d<strong>en</strong>sity and<br />
functional coupling of receptors and<br />
ion channels in compartm<strong>en</strong>ts of the<br />
target neurons, as well as on their location<br />
relative to excitatory and inhibitory<br />
synaptic sites. Thus, the question<br />
arises of how the precise subcellular<br />
location of these molecules can be<br />
determined at high resolution.<br />
For this purpose the following advanced<br />
high-resolution immunocytochemical<br />
methods have be<strong>en</strong> widely<br />
used: (i) preembedding immunogold,<br />
(ii) postembedding immunogold, and<br />
(iii) sodium dodecyl sulfate (SDS)-digested<br />
freeze-fracture replica labeling<br />
(SDS-FRL) techniques. (i) In case of the<br />
preembedding immunogold method,<br />
an 0.8 nm or a 1.4 nm gold particle is<br />
coupled to the secondary antibodies<br />
Fig. 1<br />
BIOLOGY<br />
Akos Kulik Daniel Althof<br />
NANOTECHNOLOGY 3
BIOLOGY<br />
Fig. 2<br />
Fig. 1 & 2: Distribution and colocalization of<br />
GABA (B1) and Kir3.2 in d<strong>en</strong>drites of hippocampal<br />
cells as revealed by the SDS-digested freezefracture<br />
replica labeling technique. A, Immunoparticles<br />
for the GABA (B1) subunit were found<br />
in clusters (arrows) over the surface of d<strong>en</strong>dritic<br />
shaft (D<strong>en</strong>) and spine (s) of a putative pyramidal<br />
cell. B, C, Double and triple immunogold labeling<br />
for Kir3.2 (5 nm particles; double arrows), GABA<br />
(B1) (10 nm; arrows), and PSD-95 (15 nm in C)<br />
revealed that the two proteins co-clustered in<br />
d<strong>en</strong>dritic spines of pyramidal cells (B and C) and<br />
associated to the site of glutamatergic synapses<br />
indicated by immunoreactivity for PSD-95 (C).<br />
Scale bars, 200 nm<br />
4 reSOLUTION<br />
in order to facilitate proper p<strong>en</strong>etration.<br />
Silver int<strong>en</strong>sifi cation of the gold<br />
particles is subsequ<strong>en</strong>tly carried out<br />
to produce a detectable particle size.<br />
This method produces non-diffusible<br />
labels, thus the precise site of the reaction<br />
and the location of the protein<br />
at extra- and perisynaptic sites can be<br />
determined. Synaptic proteins, however,<br />
cannot be detected using this<br />
method, most likely due to the inaccessibility<br />
of the epitopes in the synaptic<br />
specializations of fi xed tissues 2 .<br />
(ii) The postembedding immunogold<br />
method overcomes the problems of<br />
pre-embedding technique by reacting<br />
immunochemicals with the antig<strong>en</strong>s<br />
exposed on the surface of the ultrathin<br />
sections and th<strong>en</strong> detecting synaptic<br />
proteins with the same s<strong>en</strong>sititvity as<br />
that for non-synaptic molecules. This<br />
also improves quantitative evaluation<br />
of the protein d<strong>en</strong>sities.<br />
However, in resin-embedded sections<br />
substantial proportions of proteins are<br />
buried and therefore not accessible<br />
for antibodies, limiting the detection<br />
s<strong>en</strong>sitivity of this technique 2 . (iii) In<br />
SDS-FRL, the brain tissue is froz<strong>en</strong><br />
with a high-pressure freezing machine (<strong>Leica</strong> EM HPM100)<br />
th<strong>en</strong> froz<strong>en</strong> samples are freeze-fractured in a replica machine<br />
(<strong>Leica</strong> EM BAF060). Proteins are allocated to either<br />
the protoplasmic faces (P-faces) or the exoplasmic faces<br />
(E-faces) of plasma membranes. Molecules are immobilized<br />
with a thin layer of carbon (3-5 nm) followed by a<br />
further coating with a 2-nm-thick platinum/carbon layer for<br />
shadowing the membrane faces and th<strong>en</strong> this material is<br />
str<strong>en</strong>gth<strong>en</strong>ed with a 15 – 20 nm thick carbon deposit 3 . The<br />
SDS-FRL technique has two major advantages compared to<br />
conv<strong>en</strong>tional immunogold methods.<br />
First, the s<strong>en</strong>sitivity of the SDS-FRL is considerably higher<br />
than that of the pre- and postembedding techniques, because<br />
membrane proteins are exposed on the two-dim<strong>en</strong>sional<br />
surface of the replica (Fig. 1), making them readily<br />
accessible to immunoreag<strong>en</strong>ts. In addition, epitopes are<br />
d<strong>en</strong>aturated by SDS, allowing antibodies known to be<br />
suitable for immunoblot analysis to react similarly with<br />
proteins immobilized on the replica membrane. Second,<br />
synaptic and extrasynaptic proteins can simultaneously<br />
be visualized and quantifi cation of immunogold d<strong>en</strong>sity in<br />
membrane segm<strong>en</strong>ts can be achieved.<br />
This immunocytochemical method, similarly to others, has<br />
limitations. First, the id<strong>en</strong>tifi cation of labeled morphological<br />
structures is diffi cult, therefore, it is necessary to use<br />
marker proteins to facilitate the id<strong>en</strong>tifi cation of fractured<br />
membranes 6 . Second, the separation of membrane proteins<br />
to P-face or E-face is unpredictable: some proteins are prefer<strong>en</strong>tially<br />
allocated to either the P-face, such as GABA (B1),<br />
Kir3.2 4 or the E-face, such as AMPA receptors 5 , whereas<br />
others, like gluRδ2 6 are localized to both faces. Thus, for<br />
quantitative studies, the allocation of the molecules should<br />
carefully be examined 7 .<br />
Tak<strong>en</strong> together, these three immunocytochemical techniques<br />
provide complem<strong>en</strong>tary information about the cellular<br />
and subcellular distribution of proteins and are widely<br />
used for high-resolution qualitative and quantitative analysis<br />
of receptor and ion channel localization and colocalization<br />
in post- and presynaptic compartm<strong>en</strong>ts of neurons.<br />
Contact<br />
Daniel Althof, Akos Kulik<br />
Departm<strong>en</strong>t of Anatomy and Cell Biology,<br />
Institute of Neuroanatomy, Spemann Graduate School of<br />
Biology and Medicine, University of Freiburg, Germany<br />
Departm<strong>en</strong>t of Physiology II, University of Freiburg,<br />
Germany<br />
akos.kulik@physiologie.uni-freiburg.de
Refer<strong>en</strong>ces<br />
1. Farrant, M., Nusser Z. Variations on an inhibitory theme: phasic<br />
and tonic activation of GABA(A) receptors.<br />
Nature Rev Neurosci<strong>en</strong>ce 6(3), 215-229. (2005).<br />
2. Lujan, R., Nusser, Z., Roberts, J.D.B., Shigemoto, R., Somogyi,<br />
P. Perisynaptic location of metabotropic glutamate receptors<br />
mGluR1 and mGluR5 on d<strong>en</strong>drites and d<strong>en</strong>dritic spines in the<br />
rat hippocampus. Eur J Neurosci<strong>en</strong>ce 8(7), 1488-1500. (1996)<br />
3. Fukazawa, Y., Masugi-Tokita, M., Tarusawa, E., Hagiwara, H.,<br />
Shigemoto, R. SDS-digested freezefracture replica labeling<br />
(SDS-FRL), in Handbook of Cryo-preparation Methods for<br />
Electron microscopy, eds. Cavalier A, Spehner D, Humbel BM,<br />
CRC Press, New York, 567-586. (2009)<br />
4. Kulik, A., Vida, I., Fukazawa, Y., Guetg, N., Kasugai, Y., Marker,<br />
C.L., Rigato, F., Bettler, B., Wickman, K., Frotscher, M., Shigemoto,<br />
R. Compartm<strong>en</strong>t-dep<strong>en</strong>d<strong>en</strong>t colocalization of Kir3.2containing<br />
K+ channels and GABAB receptors in hippocampal<br />
pyramidal cells. J Neurosci<strong>en</strong>ce 26(16), 4289-4297. (2006)<br />
<strong>Leica</strong> EM HPM100<br />
High Pressure Freezer for Cryofi xation<br />
of Biological and Industrial Samples<br />
5. Masugi-Tokita, M., Tarusawa, E., Watanabe, M., Molnar, E.,<br />
Fujimoto, K., Shigemoto, R. Number and d<strong>en</strong>sity of AMPA receptors<br />
in individual synapses in the rat cerebellum as revealed<br />
by SDS-digested freeze-fracture replica labeling. J Neurosci<strong>en</strong>ce<br />
27(8), 2135-2144. (2007a)<br />
6. Masugi-Tokita, M., Shigemoto, R. High-resolution quantitative<br />
visualization of glutamate and GABA receptors at c<strong>en</strong>tral<br />
synapses. Curr opinion in Neurobiology 17, 387-393. (2007b)<br />
7. Fujimoto, K. Freeze-fracture replica electron microscopy combined<br />
with SDS digestion for cytochemical labeling of integral<br />
membrane proteins. Journal of Cell Sci<strong>en</strong>ce 108, 3443-3449.<br />
(1995)<br />
Instrum<strong>en</strong>ts used for this sample preparation:<br />
<strong>Leica</strong> EM BAF060<br />
Freeze Fracture System<br />
BIOLOGY<br />
NANOTECHNOLOGY 5
BIOLOGY<br />
Biological Electron<br />
Microscopy<br />
Dr. Martin W. Goldberg, Durham University, UK<br />
The Electron Microscopy (EM) laboratory in the School of Biological and Biomedical Sci<strong>en</strong>ces at Durham University is an<br />
integral part of a wider facility spanning a range of advanced imaging tools (laser scanning and spinning disc confocal microscopes,<br />
TIRF microscopy and live cell imaging) as well as an ultra high resolution (
Such sample preparation is also am<strong>en</strong>able to immuno-gold<br />
labelling, so that we can use antibodies to locate cargoes<br />
and transporters in transit, as well as the proteins that make<br />
up this gateway (the NPC) (Fig.4).<br />
Contact<br />
Dr. Martin W. Goldberg,<br />
Durham University, UK<br />
m.w.goldberg@durham.ac.uk<br />
Instrum<strong>en</strong>ts related to this sample preparation:<br />
<strong>Leica</strong> EM TP<br />
Automated Routine Tissue Processor<br />
<strong>Leica</strong> EM ACE200<br />
Low Vacuum Coater<br />
BIOLOGY<br />
Fig. 3: High magnifi cation transmission electron micrograph of high pressure froz<strong>en</strong>, freeze substituted yeast cell, clearly showing<br />
both leafl ets of the inner and the outer nuclear membranes, with ribosomes docked on the outer membrane and NPCs at points<br />
where the two membranes are joined.<br />
Fig. 4: Transmission electron micrograph of high pressure froz<strong>en</strong>, freeze substituted yeast cell immuno-gold labelled for a NPC<br />
protein.<br />
<strong>Leica</strong> EM CPD300<br />
Automated Critical Point Dryer<br />
<strong>Leica</strong> EM ACE600<br />
High Vacuum Coater<br />
NANOTECHNOLOGY 7
BIOLOGY<br />
Perusing alternatives for automated staining of TEM thin sections<br />
Substitutes for Uranyl Acetate in<br />
TEM Thin Section Post-Staining<br />
Nicole Fellner1,3 , Marl<strong>en</strong>e Brandstetter1,3 , Karin Trimmel1,2 , and Dr. Gu<strong>en</strong>ter P. Resch1,3 1IMP-IMBA-GMI Electron Microscopy Facility, Institute of Molecular Biotechnology, Vi<strong>en</strong>na, Austria<br />
2University of Applied Sci<strong>en</strong>ces, Wi<strong>en</strong>er Neustadt, Austria<br />
3Campus Sci<strong>en</strong>ce Support Facilities GmbH, Vi<strong>en</strong>na, Austria<br />
Nicole Fellner (left), Marl<strong>en</strong>e Brandstetter (in the middle of the front row),<br />
Günter Resch (in the middle of the back row), Harald Kotisch (right)<br />
8 reSOLUTION<br />
Introduction<br />
Contrast in transmission electron microscopy<br />
(TEM) is mainly produced<br />
by electron scattering at the specim<strong>en</strong>:<br />
Structures that strongly scatter<br />
electrons are referred to as electron<br />
d<strong>en</strong>se and appear as dark areas in the<br />
bright fi eld image, while structures<br />
which scatter fewer electrons appear<br />
bright (electron transpar<strong>en</strong>t) (Flegler<br />
et al., 1993). As electron scattering<br />
increases with atomic number, biological<br />
samples show hardly any inher<strong>en</strong>t<br />
amplitude contrast in the TEM,<br />
as they are largely composed of light<br />
elem<strong>en</strong>ts.<br />
To increase their contrast, electron d<strong>en</strong>se stains can be<br />
added to the sample, the most commonly used heavy elem<strong>en</strong>ts<br />
being: gold, platinum, tungst<strong>en</strong>, lead, and uranium.<br />
Biological specim<strong>en</strong>s can be contrasted through various<br />
staining techniques: Particles like protein complexes or<br />
viruses can be embedded in heavy metal salts (negative<br />
staining), or the specim<strong>en</strong> can be covered with very thin<br />
electron-d<strong>en</strong>se metal fi lms (replicas produced by shadowing).<br />
Cells and tissues can be infi ltrated with stain<br />
before embedding (Osmium tetroxide or uranyl acetate<br />
<strong>en</strong> bloc staining) or the ultra-thin sections are stained<br />
(Dykstra, 1992). The choice of reag<strong>en</strong>ts for the latter approach,<br />
called post-staining, is discussed in this article.<br />
The most frequ<strong>en</strong>tly used method for post-staining is a<br />
twostep procedure of staining with uranyl acetate (UA),<br />
followed by lead citrate. Uranyl acetate is used as an<br />
aqueous or alcoholic solution with a pH for the saturated<br />
solution in the range of 3.5 to 4.0. The addition<br />
of alcohol, especially methanol, increases the solubility<br />
(Hayat, 2000). Uranyl acetate strongly stains proteins<br />
as well as nucleic acids and phospholipids. Wh<strong>en</strong><br />
applied after the uranyl acetate staining, lead citrate<br />
(prepared according to Reynolds, 1963) will increase this<br />
contrast (Dykstra, 1992). Staining can be performed either<br />
manually or automatically, both techniques have their advantages.<br />
For manual staining, a grid is fl oated, sectionside<br />
down, on a drop of a uranyl acetate solution for 10<br />
minutes. After blotting off the stain, the grid is rinsed<br />
thoroughly with water to remove any residual unbound<br />
stain. This fi rst step is followed by 5 min. lead citrate<br />
staining, following the same procedure. The consumption<br />
of reag<strong>en</strong>ts is minimal, whereas the effort is relatively<br />
high. Alternatively, poststaining can be automated. This<br />
<strong>en</strong>sures increased reproducibility and time saving, though<br />
the amount of reag<strong>en</strong>ts used is higher. Using the automated<br />
contrasting device EM AC20 (<strong>Leica</strong> <strong>Microsystems</strong>,<br />
Vi<strong>en</strong>na) allows for simultaneous staining of up to 20 grids<br />
per run with no effort and a guarantee for safety, both for<br />
the <strong>en</strong>vironm<strong>en</strong>t and the user. Although UA is an excell<strong>en</strong>t<br />
and well characterized stain, replacem<strong>en</strong>ts are sought for,<br />
for several reasons.<br />
Wh<strong>en</strong> it needs to be handled as a powder, it is very toxic<br />
and carcinog<strong>en</strong>ic if inhaled. Furthermore, also depleted<br />
uranyl acetate is considered a radioactive material, and<br />
h<strong>en</strong>ce subject to relevant regulations. Therefore, UA requires<br />
adequate storage and careful handling, which in<br />
turn increases cost for shipping and waste disposal. To<br />
minimize contact, the automated version with the AC20<br />
is preferred by many users, in particular as readily prepared<br />
solutions are available, handling of solid UA can be<br />
avoided. Two reag<strong>en</strong>ts described in literature as replacem<strong>en</strong>ts<br />
for UA caught our att<strong>en</strong>tion: oolong tea extract<br />
(OTE) and Platinum Blue. Only very little data is published<br />
about them and the methods are not well known in the<br />
EM community. Therefore, we have tested both with<br />
manual contrasting and for the fi rst time with the <strong>Leica</strong><br />
EM AC20 instrum<strong>en</strong>t.<br />
To allow a direct comparison of results from the differ<strong>en</strong>t<br />
post-staining techniques, the same sample was used for<br />
all tests: Liver tissue freshly dissected from mice was fi xed<br />
with 2.5% glutaraldehyde in 100 mmol/l Soer<strong>en</strong>s<strong>en</strong> phosphate<br />
buffer and post-fi xed with 2.0% osmium tetroxide.
Pieces of tissue were dehydrated and embedded in Agar<br />
100 epoxy resin and sectioned to a nominal thickness of<br />
70 nm. Poststaining was performed as described below.<br />
Besides contrasting effi ci<strong>en</strong>cy and comparability of the<br />
results with UA, a number of other important parameters<br />
were assessed.<br />
Oolong Tea Extract<br />
OTE was described as post-stain to electron microscopy by<br />
Sato et al. (2003), and used in a small number of studies<br />
(Sato et al., 2008; Miller and Simakova, 2010). According<br />
to Rumpler et al. (2001), OTE is a type of half-ferm<strong>en</strong>ted<br />
tea and produced as a foodstuff. Therefore it was assumed<br />
to be harmless for health and <strong>en</strong>vironm<strong>en</strong>t, ev<strong>en</strong> though<br />
the supplier failed to produce a material safety data sheet.<br />
It can be purchased from Ted Pella (http://www.tedpella.<br />
com), and is delivered as a powder. According to Sato et al.<br />
(2003), the polyph<strong>en</strong>olic compon<strong>en</strong>ts in OTE react with peptide<br />
bonds. A reaction with OTE and lead citrate in return,<br />
leads to an <strong>en</strong>hancem<strong>en</strong>t of the contrast.<br />
After tests with differ<strong>en</strong>t OTE conc<strong>en</strong>trations, 0.2% OTE<br />
dissolved in boiling ddH 2 O was used for further experim<strong>en</strong>ts,<br />
as already proposed by Sato et al. (2003). Compared<br />
to conv<strong>en</strong>tional staining with uranyl acetate, the manual<br />
application of OTE and the subsequ<strong>en</strong>t staining step with<br />
Reynold’s lead citrate was more time consuming (Table 1).<br />
Optimal results on the <strong>Leica</strong> EM AC20 were obtained also<br />
using an ext<strong>en</strong>ded program at room temperature (Table 2).<br />
At a conc<strong>en</strong>tration of 0.2% OTE both manually as well as<br />
automatically stained samples show an increase in contrast<br />
ev<strong>en</strong> though it was clearly lower than with UA (Figs.<br />
1 and 2). In our hands, contamination was observed more<br />
frequ<strong>en</strong>tly than with UA, which mainly constituted a problem<br />
at lower magnifi cation. Despite ext<strong>en</strong>ded washing<br />
steps, both with manual staining or the <strong>Leica</strong> EM AC20,<br />
this problem could not be eliminated.<br />
Platinum Blue<br />
Platinum Blue (Pt Blue) was used as an alternative to uranyl<br />
acetate in thin section post-staining by Inaga et al. (2007;<br />
2009). This compound is a product of the reaction of cisdichlordiamineplatinum<br />
(II) with thymidine (Inaga et al.,<br />
2007). The reag<strong>en</strong>t can be ordered directly from the Japanese<br />
producer Nisshin (http://nisshin-em.co.jp). Pt Blue is<br />
a hazardous material, which may cause eye irritation, cancer<br />
and effects on fertility as well as severe disorders of<br />
the bone marrow, kidneys and the nervous system (MSDS<br />
Nisshin). The commercially available 6% stock solution has<br />
be<strong>en</strong> found to give good results at a dilution of 1:100 for the<br />
manual staining and 1:200 for the automated procedure.<br />
The incubation times for the manual staining method were<br />
the same as for UA staining (cf. Table 1).<br />
For staining using the <strong>Leica</strong> EM AC20, the step for Pt Blue<br />
were ext<strong>en</strong>ded to 30 min, using the id<strong>en</strong>tical conditions<br />
as for UA. The grids were th<strong>en</strong> rinsed with distilled water,<br />
stained with lead citrate, and washed as described in<br />
Table 2. Figures 1 and 2 illustrate that all organelles show<br />
good contrast and that the results are comparable in quality<br />
to pictures tak<strong>en</strong> from sections stained with UA. Differ<strong>en</strong>ces<br />
can be found in a more int<strong>en</strong>sely stained mitochondrial<br />
matrix and a higher contrast of glycog<strong>en</strong> granules. The<br />
ribosomes appear weaker stained as compared to UA.<br />
Stain 1 Time Washing Stain 2 Time Washing<br />
UA 10 min 2 min ddH 2 O Lead citrate 5 min 2 min ddH 2 O<br />
OTE 25 min 6 min ddH 2 O Lead citrate 5 min 2 min ddH 2 O<br />
Pt Blue 10 min 2 min ddH 2 O Lead citrate 5 min 2 min ddH 2 O<br />
Table 1: Details of manual staining procedures<br />
Stain 1 Time Washing Stain 2 Time Washing<br />
BIOLOGY<br />
UA 30 min 2 min 20 sec ddH 2 O Lead citrate 7 min 2 min 20 sec ddH 2 O<br />
OTE 40 min 5 min ddH 2 O Lead citrate 7 min 2 min ddH 2 O<br />
Pt Blue 30 min 2 min 20 sec ddH 2 O Lead citrate 7 min 2 min 20 sec ddH 2 O<br />
Table 2: Automated staining procedures of the <strong>Leica</strong> EM AC20. The conditions for UA and lead citrate are suggested by <strong>Leica</strong> and can be found in the user's manual of the staining device.<br />
NANOTECHNOLOGY 9
BIOLOGY<br />
10 reSOLUTION<br />
Conclusion<br />
OTE and Pt Blue were assessed as substitutes for UA in<br />
section post-staining for electron microscopy with regard<br />
to contrasting effi ci<strong>en</strong>cy, toxicity, handling, and price. Manual<br />
as well as automatic staining procedures with the <strong>Leica</strong><br />
EM AC20 were tested. No <strong>en</strong> bloc staining was performed.<br />
Furthermore, resins other than Agar 100 or differ<strong>en</strong>t section<br />
thicknesses may lead to differ<strong>en</strong>t results.<br />
Both the rather weak contrast obtained with OTE as well<br />
as the contamination observed on the specim<strong>en</strong> were not<br />
convincing with manual staining and the <strong>Leica</strong> EM AC20. Pt<br />
Blue delivered clearly better results with both approaches.<br />
However, slight differ<strong>en</strong>ces in contrasting properties as<br />
compared to UA have to be tak<strong>en</strong> into account for interpretation<br />
of micrographs (Yamaguchi et al., 2010). The quality<br />
of results that can be obtained from automatic staining is<br />
comparable with the manual procedure for both OTE and<br />
Platinum Blue.<br />
Regarding toxicity, both reag<strong>en</strong>ts tested as substitutes of<br />
UA have the advantage of not being radioactive. Furthermore,<br />
working with health-damaging inhalable powder can<br />
be avoided. Being a food product it can be presumed that<br />
OTE is non-hazardous. In contrast, Pt Blue is toxic but as it<br />
is delivered as a stock solution further risky handling can<br />
be reduced to a minimum. The utilization of an automatic<br />
staining device such as the <strong>Leica</strong> EM AC20 can help to further<br />
minimize contact with toxic reag<strong>en</strong>ts.<br />
Staining with UA and Pt Blue is comparable in time<br />
and labor, whereas contrasting with OTE is more time<br />
consuming without delivering as satisfactory results.<br />
As with the <strong>Leica</strong> EM AC20, it is possible to stain<br />
Instrum<strong>en</strong>ts related to this sample preparation:<br />
<strong>Leica</strong> EM AC20<br />
Automatic Constrasting Instrum<strong>en</strong>t for Ultrathin Sections<br />
<strong>Leica</strong> EM TRIM2<br />
Specim<strong>en</strong> Trimming Device for TEM, SEM, LM<br />
up to 20 grids at once and all steps are carried out<br />
automatically, this becomes less of a disadvantage of OTE.<br />
From the economic point of view, OTE was by far the cheapest<br />
product. The price per grid at the used conc<strong>en</strong>tration of<br />
0.2% was signifi cantly lower than for Pt Blue (at a dilution<br />
of 1:100) and the 2.0% UA solution.<br />
Summing up, electron microscopists in need of a replacem<strong>en</strong>t<br />
for UA for post-staining of sections have the choice<br />
betwe<strong>en</strong> one reag<strong>en</strong>t at a very cheap price and minimal<br />
risk with moderate results – Oolong tea extract – and<br />
another one, that delivers very convincing results, but at<br />
higher cost and not without safety risks – Platinum Blue.<br />
The experim<strong>en</strong>ts here have shown that this is applicable<br />
for both manual as well as automated staining with the<br />
<strong>Leica</strong> EM AC20.<br />
Acknowledgem<strong>en</strong>ts<br />
The authors would like to thank Yanli Tong (<strong>Leica</strong> <strong>Microsystems</strong>,<br />
Shanghai) for assistance with acquiring reag<strong>en</strong>ts and<br />
Jean Trichereau (IMBA, Vi<strong>en</strong>na) for providing samples. The<br />
work of N.F., M.B. and G.P.R. was supported by the City of<br />
Vi<strong>en</strong>na/Z<strong>en</strong>trum fuer Innovation und Technologie through<br />
the Spot of Excell<strong>en</strong>ce grant “C<strong>en</strong>ter of Molecular and Cellular<br />
Nanostructure.”<br />
Contact<br />
Dr. Günter Resch<br />
Head of Electron Microscopy, Campus Sci<strong>en</strong>ce Support<br />
Facilities GmbH, Vi<strong>en</strong>na, Austria<br />
gu<strong>en</strong>ter.resch@csf.ac.at<br />
<strong>Leica</strong> EM UC7<br />
Ultramicrotome for Perfect Sectioning at Room Temperature and Cryo
Refer<strong>en</strong>ces<br />
1. MSDS Nisshin: http://nisshin-em.co.jp/home/msds/index.<br />
html.<br />
2. Dykstra, M.J. 1992. Biological Electron Microscopy: Therory,<br />
Techniques, and Troubleshooting. Pl<strong>en</strong>um Press, New<br />
York.<br />
3. Flegler, S.L., Heckman, J.W., Jr., Klompar<strong>en</strong>s, K.L. 1993. Scanning<br />
and Transmission Electron Microscopy: An Introduction.<br />
W.H. Freeman and Company, New York.<br />
4. Hayat, M.A. 2000. Principles and Techniques of Electron Microscopy:<br />
Biological Applications. 4 th ed. Cambridge University<br />
Press, Cambridge.<br />
5. Inaga, S., Hirashima, S., Tanaka, K., Katsumoto, T., Kameie,<br />
T., Nakane, H., Naguro, T. 2009. Low vacuum scanning electron<br />
microscopy for paraffin sections utilizing the differ<strong>en</strong>tial<br />
stainability of cells and tissues with platinum blue. Arch Histol<br />
Cytol. 72(2):101-106.<br />
6. Inaga, S., Katsumoto, T., Tanaka, K., Kameie, T., Nakane, H.,<br />
Naguro, T. 2007. Platinum blue as an alternative to uranyl acetate<br />
for staining in transmission electron microscopy. Arch<br />
Histol Cytol. 70(1):43-49.<br />
7. Miller, A.A., and A.V. Simakova. 2010. Application of Method<br />
of OTE Staining of Ultrathin Sections Based on Example of Microsporidia<br />
(Protozoa: Microsporidia). Cell and Tissue Biology.<br />
4(1):109-115.<br />
8. Reynolds E.S. 1963. The Use of Lead Citrate at High pH as an<br />
Electron Opaque Stain in Electron Microscopy. Journal of Cell<br />
Biology 17:208-212.<br />
9. Sato, S., Adachi, A., Sasaki, Y., Ghazizadeh, M. 2008. Oolong tea<br />
extract as a substitute for uranyl acetate in staining of ultrathin sections.<br />
Journal of Microscopy. 229(Pt 1):17-20. Sato, S., Sasaki, Y.,<br />
Adachi, A., Dai, W., Liu, X.L., Namimatsu, S. 2003. Use of oolong<br />
tea extract (OTE) for elastin staining and <strong>en</strong>hancem<strong>en</strong>t in ultrathin<br />
sections. Med Electron Microsc. 36(3):179-182.<br />
10. Rumpler, W., Seale, J., Clevid<strong>en</strong>ce, B., Judd, J., Wiley, E., Yamamoto,<br />
S., Komatsu, T., Sawaki, T., Ishikura, Y., Hosoda, K.<br />
2001. Oolong Tea Increases Metabolic Rate and Fat Oxidation<br />
in M<strong>en</strong>. J. Nutr. 131: 2848–2852.<br />
11. Yamaguchi, K., Suzuki, K., Tanaka, K. 2010. Examination<br />
of electron stains as a substitute for uranyl acetate for the<br />
ultrathin sections of bacterial cells. Journal of Electron<br />
Microscopy (Tokyo) 59(2):113-118.<br />
BIOLOGY<br />
Fig. 1: Results from the manual poststaining procedure with UA,<br />
OTE, and Pt Blue, followed by lead citrate, in comparison. All images<br />
were acquired under id<strong>en</strong>tical conditions and are reproduced with<br />
similar contrast <strong>en</strong>hancem<strong>en</strong>t to allow a direct comparison of the<br />
contrast obtained. (A, top left) Unstained mouse liver tissue. (B, top<br />
right) Routine EM staining shows a good and consist<strong>en</strong>t contrast of<br />
all cell organelles. (C, bottom left) Organelles including nucleus and<br />
rough <strong>en</strong>doplasmic reticulum are clearly se<strong>en</strong> in OTE stained tissue.<br />
(D, bottom right) Pt Blue stained sections show good contrast.<br />
Staining is more int<strong>en</strong>se in mitochondria and glycog<strong>en</strong> granules as<br />
compared to UA. Scale bar: 1 μm.<br />
Fig. 2: Comparison of mouse liver sections after automatic staining<br />
with UA, OTE, and Pt Blue using the <strong>Leica</strong> EM AC20. (A, top left)<br />
Unstained tissue. (B, top right) UA stained liver tissue shows an<br />
overall good contrast. (C, bottom left) Contrast is weaker in OTE<br />
stained liver tissue and minor contamination is visible. (D, bottom<br />
right) Nucleus, rough <strong>en</strong>doplasmic reticulum, mitochondria, and glycog<strong>en</strong><br />
granules are clearly visible in this specim<strong>en</strong> stained with Pt<br />
Blue (1:200). Scale bar: 1 μm.<br />
Note added in proof: Readers interested in<br />
replacing uranyl acetate are also referred to<br />
Nakakoshi, M., Nishioka, H., and Katayama,<br />
E. 2011: New versatile staining reag<strong>en</strong>ts for<br />
biological transmission electron microscopy that<br />
substitute for uranyl acetate. Journal of Electron<br />
Microscopy 60(6): 401–407.<br />
NANOTECHNOLOGY 11
BIOLOGY<br />
Dry Ultrathin Sectioning Combined With High Pressure<br />
Freezing/Freeze-substitution Improves Ret<strong>en</strong>tion and<br />
Visualization of Calcium and Phosphorus Ions Prior to<br />
Nucleation of Mineral Crystals Within Osteoblastic Cultures<br />
Jeff P. Gorski1 , N.T. Huffman1 , T. Hillman-Marti2 , and Daniel Studer2 1Departm<strong>en</strong>t of Oral Biology and the UMKC C<strong>en</strong>ter of Excell<strong>en</strong>ce<br />
in Mineralized Tissue Research, School of D<strong>en</strong>tistry,<br />
Univ. Missouri-KC, Kansas City, Kansas City, MO and<br />
2Institute of Anatomy, University of Bern, Bern, Switzerland<br />
12 reSOLUTION<br />
We have used cultured UMR106-01 osteoblastic cells to<br />
investigate the process of bone mineralization. UMR106-<br />
01 cells as well as primary calvarial bone cells assemble<br />
spherical extracellular supramolecular protein-lipid complexes,<br />
termed biomineralization foci (BMF), in which the<br />
fi rst crystals of hydroxyapatite mineral are deposited (Midura<br />
et al., 2004; Wang et al., 2004). A major differ<strong>en</strong>ce<br />
betwe<strong>en</strong> these culture models is the speed with which<br />
mineralization occurs, ranging from 12-16 days after plating<br />
for primary osteoblastic cells to 88h for UMR106-01<br />
cells.<br />
If mineralization is blocked by omission of phosphate<br />
source or by addition of serine protease inhibitor AEBSF,<br />
BMF complexes are formed but no mineralization occurs.<br />
Interestingly, ultra structural studies have shown that prior<br />
to mineralization BMF contain numerous membrane limited<br />
vesicles ranging in size from 50 nm to 2 microns in diameter.<br />
However, the fi rst mineral crystals are not detected<br />
until 78 h after plating of UMR106-01 cells and are localized<br />
within spherical sites presumed to be vesicles.<br />
Specifi cally, confocal Raman spectral analyses have shown<br />
that mineralization within BMF is a progressive, multi-step<br />
process occurring simultaneously in all BMF within a culture<br />
fl ask (Wang et al., 2009). Importantly, several protein<br />
spectral changes are detectable within each BMF prior<br />
to the deposition of poorly crystalline hydroxyapatite and<br />
wh<strong>en</strong> mineralization was blocked, these changes did not<br />
Jeff P. Gorski Daniel Studer<br />
Thérèse Hillmann<br />
occur. Thus, mineralization within BMF is a temporally<br />
synchronized process. However, understanding the biochemical<br />
mechanism of mineralization requires a detailed<br />
appreciation of calcium and phosphorus ion handling prior<br />
to crystal nucleation within BMF.<br />
Previous work has proposed that cartilage and/or bone<br />
mineralization utilizes either a single vesicle population<br />
<strong>en</strong>riched in both calcium and phosphorus, or, two vesicle<br />
populations separately <strong>en</strong>riched in calcium or phosphorus<br />
(Fig. 1) (Anderson, 1967; Bonucci, 1967; Ars<strong>en</strong>ault and Ott<strong>en</strong>smeyer,<br />
1984). In order to clarify this issue, the solubility<br />
of these ions necessitates the use of additional methods<br />
such as high pressure freezing and freeze substitution to<br />
avoid loss during specim<strong>en</strong> fi xation, embedding, and sectioning.<br />
Since most prior studies have not consist<strong>en</strong>tly<br />
avoided water during specim<strong>en</strong> processing, the true impact<br />
of pseudo non-aqueous processing on the process of<br />
osteoblast-mediated mineralization is diffi cult to assess.<br />
The goal of our study was to use the synchronized UMR106-<br />
01 culture model to devise and validate a pseudo nonaqueous<br />
processing method to image the distribution of<br />
calcium and phosphorus ions within BMF immediately prior<br />
to nucleation of the fi rst hydroxyapatite crystals therein<br />
(Fig. 1). We believe this method should also be applicable<br />
to investigations of temporal changes in calcium ion distributions<br />
in other cells such as muscle.
Calcium and phosphorus can be lost from samples either<br />
after high pressure freezing and freeze-substitution or during<br />
conv<strong>en</strong>tional fi xation. To evaluate the effectiv<strong>en</strong>ess<br />
of our pseudo non-aqueous method, we chose to stop the<br />
cultures at 76 h, twelve hours after adding the ß-glycerol<br />
phosphate mineralization stimulus, but 2 h before the appearance<br />
of the fi rst crystals of mineral within BMF (Midura<br />
et al., 2004; Wang et al., 2009). Some cultures were<br />
randomly chos<strong>en</strong> to be processed for conv<strong>en</strong>tional fi xation<br />
(Fig. 2) while others were processed by high pressure<br />
freezing (<strong>Leica</strong> EM PACT) and freeze-substitution (Fig. 3).<br />
Comparison of these paired cultures support several conclusions.<br />
Large areas contain a somewhat homog<strong>en</strong>eous<br />
particulate organic matrix after conv<strong>en</strong>tional fi xation.<br />
These areas seem to exclude membrane limited vesicles<br />
from their volume. In contrast, high pressure froz<strong>en</strong> cultures<br />
contain numerous almost “white” extracellular areas,<br />
roughly 0.5-1 μm in diameter, within BMF (arrows, Fig. 3).<br />
In higher power views, it is evid<strong>en</strong>t that despite the low<br />
contrast these “white” regions do possess an underlying<br />
detail which repres<strong>en</strong>ts a range of irregularly shaped<br />
spherical bodies from about 50 to 800 nanometers in diameter<br />
(not shown). However, the pres<strong>en</strong>ce of these “white”<br />
areas raised immediate concerns regarding the loss of inorganic<br />
or organic substances. In particular, wh<strong>en</strong> compared<br />
with similar BMF regions from paired, conv<strong>en</strong>tionally fi xed<br />
cultures (Fig. 2), we hypothesized that “white” spots repres<strong>en</strong>ted<br />
materials which were prefer<strong>en</strong>tially retained by<br />
high pressure freezing but which were subsequ<strong>en</strong>tly lost<br />
upon further processing.<br />
Notably, subsequ<strong>en</strong>t electron spectroscopic imaging of<br />
calcium and phosphorus was not possible in either conv<strong>en</strong>tionally<br />
fi xed nor in freeze-substituted samples which were<br />
sectioned on water regardless of whether specim<strong>en</strong>s were<br />
post-stained or not (results not shown). We therefore substituted<br />
dry sectioning for wet sectioning of high pressure<br />
froz<strong>en</strong>, freeze substituted cultures. Calcium and phosphorus<br />
ret<strong>en</strong>tion is improved in dry sectioned high pressure froz<strong>en</strong>,<br />
freeze-substituted cultures. It is clear that substitution<br />
of dry sectioning leads to a dramatic increase in ret<strong>en</strong>tion<br />
of calcium and phosphorus within biomineralization foci<br />
[compare Figures 3 (wet sectioning) and 4 (dry sectioning)].<br />
Focal 0.5-1 μm diameter areas which appeared as “white”<br />
spots in Fig. 3 after wet sectioning, now appear dark (Fig.<br />
4A) in the zero loss <strong>en</strong>ergy image. The fact that UMR106-01<br />
cultures mineralize in a reproducible, temporally synchronous<br />
manner facilitates these direct comparisons among<br />
differ<strong>en</strong>t cultures (Wang et al., 2009).In addition, electron<br />
spectroscopic imaging demonstrates that the dark appearing<br />
areas are <strong>en</strong>riched in calcium and phosphorus (compare<br />
Figs. 4A, B, and C). Finally, as shown in the overlay image<br />
in Fig. 4D, the calcium (red) and phosphorus (gre<strong>en</strong>) signals<br />
largely overlap each other in the 76 h cultures as shown<br />
by the pres<strong>en</strong>ce of yellow. Since other studies have shown<br />
that 76 h UMR106-01 cultures do not contain detectable<br />
mineral crystals (Huffman et al., 2007; Wang et al., 2009),<br />
the <strong>en</strong>riched cont<strong>en</strong>ts of calcium and phosphorus observed<br />
here could repres<strong>en</strong>t amorphous calcium phosphate (Driess<strong>en</strong>s<br />
et al., 1978) and/or labile organic forms of phosphorus<br />
such as polyphosphates (Omelon et al., 2009).<br />
Importantly, a functional role for the observed <strong>en</strong>riched focal<br />
cont<strong>en</strong>ts of calcium and phosphorus in mineralization is<br />
supported by analyses of un-mineralized control cultures.<br />
Wh<strong>en</strong> a similar high pressure freezing, freeze substitution,<br />
and dry sectioning approach was applied to un-mineralized<br />
UMR106-01 cultures, few dark (calcium and/or phosphorus<br />
<strong>en</strong>riched) vesicles or particles were detected (not shown).<br />
Finally, an additional advantage to use of the oscillating<br />
knife was that it reduced compression during sectioning<br />
and reduced wrinkling of resultant sections.<br />
BIOLOGY<br />
Fig. 1: The single and dual vesicle models of extracellular mineralization. Upper panel,<br />
single matrix vesicle model. Calcium and phosphorus ions are progressively conc<strong>en</strong>trated<br />
within a single population of matrix vesicles through the proposed actions of<br />
Ca +2 -pumping ATPase, Na + -phosphate co-transporter, and phosphatases acting on<br />
phospholipids. Once Ca +2 and phosphate ions reach a threshold conc<strong>en</strong>tration (yellow),<br />
nucleation of initial mineral crystals occurs leading to breakage of the vesicle<br />
and release of crystals which can propagate additional crystals within the surrounding<br />
extracellular collag<strong>en</strong>ous matrix. Lower panel, dual vesicle model. Calcium and<br />
phosphorus are progressively conc<strong>en</strong>trated within two differ<strong>en</strong>t populations of vesicles<br />
which biochemically display distinct functional distributions including Ca +2 pumping<br />
ATPase and Na + -phosphate co-transporter activities, respectively. Subsequ<strong>en</strong>tly,<br />
these calcium and phosphate <strong>en</strong>riched vesicle populations fuse and nucleate mineral<br />
crystals leading to breakage of the vesicle and release of crystals which can propagate<br />
additional crystals within the surrounding extracellular collag<strong>en</strong>ous matrix.<br />
Instrum<strong>en</strong>t related to this sample<br />
preparation:<br />
<strong>Leica</strong> EM PACT2<br />
High Pressure Freezer with Rapid Transfer System<br />
NANOTECHNOLOGY 13
BIOLOGY<br />
Fig. 2: Appearance of BMF in mineralizing osteoblastic culture after conv<strong>en</strong>tional chemical fixation and wet sectioning. UMR106-01 cells were cultured for 12 h in the pres<strong>en</strong>ce of ß-glycerol phosphate. Arrowhead<br />
defines the outlines of an extracellular BMF <strong>en</strong>riched in a somewhat homog<strong>en</strong>eous particulate organic matrix.<br />
Fig. 3: High-pressure froz<strong>en</strong>, freeze-substituted osteoblastic cultures contain BMF with transluc<strong>en</strong>t spots (arrow) which are poorly contrasted extracellular<br />
matrix regions. Wh<strong>en</strong> compared with analogous samples subjected to dry sectioning, the transluc<strong>en</strong>t spots appear black (see Figure 4).<br />
14 reSOLUTION
In summary, our results show that high pressure freezing<br />
and pseudo non-aqueous processing are required to detect<br />
extracellular sites of early calcium and phosphorus <strong>en</strong>richm<strong>en</strong>t<br />
in mineralizing osteoblastic cultures. Use of dry<br />
sectioning proved to be a critical step in the preservation<br />
of calcium and phosphorus. Also, electron spectroscopic<br />
imaging demonstrated that darkly stained vesicles within<br />
extracellular biomineralization foci are <strong>en</strong>riched in calcium<br />
and phosphorus prior to the detection of crystalline mineral<br />
(Wang et al., 2009). We now plan to use this method to<br />
determine if osteoblastic cells in vitro and in vivo utilize a<br />
single or dual vesicle mineralization mechanism (Gorski et<br />
al., 2004; Midura et al., 2009).<br />
Space does not permit us to cite all the relevant publications.<br />
Please refer to our rec<strong>en</strong>t publication: Studer et al.,<br />
2011 for a more complete citation list.<br />
Address correspond<strong>en</strong>ce to: Jeff P. Gorski, Ph.D., Dept. of<br />
Oral Biology, School of D<strong>en</strong>tistry, University of Missouri-Kansas<br />
City, 650 East 25th Street, Kansas City, MO 64108.<br />
Phone: 815-235-2537; fax: 816-235-5524; gorskij@umkc.edu<br />
Contact<br />
Jeff P. Gorski, Ph.D.<br />
Professor<br />
UMKC C<strong>en</strong>ter of Excell<strong>en</strong>ce in Mineralized Tissues<br />
Departm<strong>en</strong>t of Oral Biology<br />
School of D<strong>en</strong>tistry<br />
University of Missouri-Kansas City<br />
gorskij@umkc.edu<br />
Dr. sc. nat. Daniel Studer<br />
Institute of Anatomy, University of Bern, Bern, Switzerland<br />
daniel.studer@ana.unibe.ch<br />
Refer<strong>en</strong>ces<br />
1. Anderson, H.C. (1967) Electron microscopic studies of induced<br />
cartilage developm<strong>en</strong>t and calcifi cation. J Cell Biol 35:<br />
81-101.<br />
2. Ars<strong>en</strong>ault, A.L., F.P. Ott<strong>en</strong>smeyer (1984) Visualization of early<br />
intramembranous ossifi cation by electron microscope and<br />
spectroscopic imaging. J Cell Biol 98: 911-921.<br />
3. Bonucci, E. (1967) Fine structure of early cartilage calcifi cation.<br />
J Ultrastruct Res 20, 33-50.<br />
4. Driess<strong>en</strong>s, F.C., J.W. van Dijk, J.M. Borggrev<strong>en</strong> (1978) Biological<br />
calcium phosphates and their role in the physiology<br />
of bone and d<strong>en</strong>tal tissues. 1. Composition and solubility of<br />
calcium phosphates. Calcif Tissue Res 26: 127–137.<br />
5. Gorski, J.P., A. Wang, D. Lovitch, D. Law, K. Powell, R.J. Midura<br />
(2004) Extracellular bone acidic glycoprotein-75 defi nes<br />
cond<strong>en</strong>sed mes<strong>en</strong>chyme regions to be mineralized and localizes<br />
with bone sialoprotein during intramembranous bone<br />
formation. J Biol Chem 279: 25455–25463.<br />
6. Huffman, N.T., J.A. Keightley, C. Chaoying, R.J. Midura,<br />
D. Lovitch, P.A. V<strong>en</strong>o, S.L. Dallas, J.P. Gorski (2007)<br />
Association of specifi c proteolytic processing of bone<br />
sialoprotein and bone acidic glycoprotein-75 with mineralization<br />
within biomineralization foci. J Biol Chem 282:<br />
26002–26013.<br />
BIOLOGY<br />
Fig. 4: After pseudo non-aqueous processing, mineralized BMF were <strong>en</strong>riched in calcium and phosphorus. Cells were<br />
grown id<strong>en</strong>tically to those in Figures 2 and 3. A: Zero loss <strong>en</strong>ergy image depicting dark appearing vesicle. B: Electron<br />
spectroscopic imaging of calcium signal. C: Electron spectroscopic imaging of phosphorus. D: Superimposed images of the<br />
views in A-C.<br />
7. Midura, R.J., A. Wang, D. Lovitch, D. Law, K. Powell, J.P.<br />
Gorski (2004) Bone acidic glycoprotein-75 delineates the<br />
extracellular sites of future bone sialoprotein accumulation<br />
and apatite nucleation in osteoblastic cultures. J Biol Chem<br />
279: 25464–25473.<br />
8. Midura, R.J., A. Vasanii, X. Su, S.B. Midura, J.P. Gorski<br />
(2009) Isolation of calcospherulites from the mineralization<br />
front of bone. Cells Tissues Organs. 189:75-79.<br />
9. Omelon, S., J. Georgiou, Z.J. H<strong>en</strong>neman, L.M. Wise, B. Sukhu,<br />
T. Hunt, C. Wynnyckyj, D.Holmyard, R. Bielecki, M.D.<br />
Grynpas (2009) Control of vertebrate skeletal mineralization<br />
by polyphosphates. PLoS One 4: e5634.<br />
10. Studer, D., T. Hillman-Marti, N.T. Huffman, J.P. Gorski (2011)<br />
Eliminating Exposure to Aqueous Solv<strong>en</strong>ts Is Necessary for<br />
the Early Detection and Ultrastructural Elem<strong>en</strong>tal Analysis<br />
of Sites of Calcium and Phosphorus Enrichm<strong>en</strong>t in Mineralizing<br />
UMR106-01 Osteoblastic Cultures. Cells Tissues Organs<br />
May 30. [Epub ahead of print].<br />
11. Wang, C., Y. Wang, N.T. Huffman, C. Cui, X. Yao, S. Midura,<br />
R.J. Midura, J.P. Gorski (2009) Confocal laser Raman microspectroscopy<br />
of biomineralization foci in UMR 106 osteoblastic<br />
cultures reveals temporally synchronized protein changes<br />
preceding and accompanying mineral crystal deposition. J<br />
Biol Chem 284: 7100–7113.<br />
NANOTECHNOLOGY 15
INDUSTRY<br />
A Word on Cathodoluminesc<strong>en</strong>ce<br />
Cathy Johnson, Nanotechnology Division, Leider Lane, Buffalo Grove, IL<br />
Cathodoluminesc<strong>en</strong>ce microanalysis is an emerging technique that is fast gaining popularity in the world of materials<br />
sci<strong>en</strong>ce. CL is a light emission ph<strong>en</strong>om<strong>en</strong>a resulting from the electron beam excitation of a luminesc<strong>en</strong>t material. As electronic<br />
transitions occur betwe<strong>en</strong> the conduction and val<strong>en</strong>ce bands, CL photons are g<strong>en</strong>erated and detected. Electronic<br />
transitions due to defect levels within the band gap, particularly in the case of semiconductors and devices, can also<br />
infl u<strong>en</strong>ce CL data. Data acquisition results in a mapping of the optical activity for a specim<strong>en</strong>.<br />
Cathy Johnson, <strong>Leica</strong> <strong>Microsystems</strong><br />
CL data can indicate defects such as imperfections or impurities<br />
within the microstructure of a material phase. These<br />
defects can have an effect on the material’s optical, electrical<br />
and mechanical properties. Utilizing the high resolution<br />
capability of a SEM or STEM, a spectrum can be acquired<br />
at each point location (i.e. hyperspectral imaging). As such,<br />
it serves as an important spectroscopy and imaging technique<br />
in the characterization of materials. Image resolution<br />
is dep<strong>en</strong>d<strong>en</strong>t on instrum<strong>en</strong>t confi guration, experim<strong>en</strong>tal parameters<br />
and specim<strong>en</strong> interaction, but can range from < 10<br />
nanometers to the micron level.<br />
The fi rst MAS Cathodoluminesc<strong>en</strong>ce Topical Confer<strong>en</strong>ce<br />
was hosted October 24-28, 2011 by the National Institute<br />
of Standards and Technology (NIST) in Gaithersburg, MD.<br />
This confer<strong>en</strong>ce was sponsored by the Microbeam Analysis<br />
Society (MAS), and was co-sponsored by the Australian<br />
Microbeam Analysis Society (AMAS). The four day program<br />
included a pre-confer<strong>en</strong>ce tutorial targeted for the CL<br />
novice on October 24 th . The remaining three days included<br />
a combination of technical pres<strong>en</strong>tations, hands-on laboratory<br />
demonstrations and a contributed poster session. Pres<strong>en</strong>tation<br />
topics included: CL theory, data quantifi cation,<br />
advances in instrum<strong>en</strong>tation, analysis and databases. Applications<br />
in geological, semiconductor and nanomaterial<br />
disciplines including sample preparation and Correlative<br />
CL in conjunction with complem<strong>en</strong>tary techniques such as<br />
EBIC and EBSD were also addressed.<br />
Instrum<strong>en</strong>ts rel related to this sample preparation:<br />
<strong>Leica</strong> EM TXP<br />
Target Surfacing System<br />
<strong>Leica</strong> EM TIC 3X<br />
Ion Beam Slope Cutter<br />
<strong>Leica</strong> EM RES101<br />
Ion Milling System<br />
Contact<br />
Cathy Johnson<br />
<strong>Leica</strong> <strong>Microsystems</strong><br />
Nanotechnology Division<br />
1700 Leider Lane<br />
Buffalo Grove, IL 60089<br />
Cathy.Johnson@leica-microsystems.com<br />
Panchromatic cathodoluminesc<strong>en</strong>ce image of cassiterite mineral (SnO 2 )<br />
Image Credits<br />
Scott Wight 1 , Ed Vic<strong>en</strong>zi 2 , Doug Meier 1 , and Kurt B<strong>en</strong>kstein 1<br />
1 National Institute of Standards and Technology<br />
2 Smithsonian Institution<br />
Source: Smithsonial National Mineral Collection, Preparation: Cut<br />
and polished with the <strong>Leica</strong> EM TXP Data Collection: FEI Company<br />
QuantaTM 200F SEM with Gatan, MonoCL4 Elite System
Atomic Force Microscopy<br />
Study of a Stretched Impact<br />
Copolymer<br />
INDUSTRY<br />
Dalia G. Yablon, Jean Grabowski, and Andy H. Tsou, Exxon Mobil Research and Engineering, Clinton, New Jersey, USA.<br />
Abstract<br />
Atomic force microscopy (AFM) is a powerful tool in<br />
the suite of nanoscale characterization techniques that<br />
provides a variety of information including topography,<br />
mechanical properties, and electrical properties with nanoscale<br />
lateral and sub-nanometer vertical resolution.<br />
Cryoultramicrotomy is an ess<strong>en</strong>tial tool for effective polymer<br />
sample preparation for atomic force microscopy (AFM)<br />
in order to get rid of the polymer skin from processing and<br />
to <strong>en</strong>sure a smooth surface for analysis. We pres<strong>en</strong>t an<br />
AFM study of the effect of t<strong>en</strong>sile stress on a cryotomed<br />
impact copolymer (ICP), a multicompon<strong>en</strong>t material typically<br />
used in automotive and appliance applications where a<br />
balance of stiffness and toughness is needed to investigate<br />
material deformation and interface adhesion as a function<br />
of t<strong>en</strong>sile stress.<br />
Article<br />
The fi eld of atomic force microscopy (AFM), which was<br />
inv<strong>en</strong>ted in the mid 1980’s, has revolutionized our capabilities<br />
to explore and understand nanoscale ph<strong>en</strong>om<strong>en</strong>a by<br />
allowing unpreced<strong>en</strong>ted characterization of surface and<br />
interface reactions and molecular and sub-molecular structures.<br />
Especially with commercial instrum<strong>en</strong>ts available for<br />
widespread academic and industrial research beginning in<br />
the early 1990’s, the atomic force microscope (AFM) has<br />
become a main tool in the suite of techniques available for<br />
characterization, and is included in most characterization<br />
facilities alongside optical and electron microscopes.<br />
AFM now can routinely provide ~10nm lateral resolution<br />
and angstrom vertical resolution on a variety of surfaces<br />
and in fl exible <strong>en</strong>vironm<strong>en</strong>ts including ambi<strong>en</strong>t and in situ<br />
fl uid imaging and is routinely used to provide a wealth<br />
of information including topography, mechanical properties,<br />
electrical and magnetic properties on a variety of<br />
materials ranging from biological cells to semiconductors<br />
to polymers. The heart of the AFM measurem<strong>en</strong>ts lies in<br />
the precisely monitored interaction betwe<strong>en</strong> a very sharp<br />
tip (~10nm in diameter) mounted on a cantilever (typically<br />
100’s of microns long, t<strong>en</strong>s of microns wide and a few<br />
microns thick) and the surface of interest via optical detection.<br />
Through this tip-sample interaction, multiple surface<br />
properties can be probed on the nanoscale, including<br />
nanomechanical properties of polymeric materials. Specifi<br />
cally, an AFM mode called tapping mode or amplitude<br />
modulation mode is employed to image polymeric surfaces<br />
where the cantilever is oscillated at a resonance frequ<strong>en</strong>cy<br />
and thus g<strong>en</strong>tly “taps” along the surface through intermitt<strong>en</strong>t<br />
contact, resolving features in the material based on its<br />
mechanical properties such as stiffness and other viscoelastic<br />
properties.<br />
Sample preparation of polymeric samples via ultracryomicrotomy<br />
for AFM analysis is critical for two reasons. First,<br />
a smooth surface is ess<strong>en</strong>tial for effective AFM analysis<br />
as the maximum vertical range on AFM is typically less<br />
than 5 um. This is also means that if there are features that<br />
are taller than 5 um (or whatever the specifi cation on the<br />
particular AFM instrum<strong>en</strong>t), that surface will not be able<br />
to be imaged. Second, many polymer materials come in a<br />
processed form where the material has either be<strong>en</strong> injection<br />
molded or compression molded and thus forms a rough<br />
skin on the surface that is not repres<strong>en</strong>tative of the bulk<br />
material and needs to be removed.<br />
Cryomicrotomy is able to remove the surface skin and provide<br />
a smooth surface (all at cold temperatures below Tg<br />
of the polymer, which is ess<strong>en</strong>tial, otherwise the surface<br />
features of interest will not be resolved). The <strong>Leica</strong> EM UC6<br />
system provides conv<strong>en</strong>i<strong>en</strong>t AFM attachm<strong>en</strong>ts where samples<br />
can be cryofaced in conjunction with the <strong>Leica</strong> EM FC6<br />
and directly transferred to the AFM for conv<strong>en</strong>i<strong>en</strong>t analysis<br />
without removing the specim<strong>en</strong>, <strong>en</strong>suring a smooth fl at<br />
surface for AFM imaging.<br />
We show here AFM data examining the rubber/matrix<br />
interface of a commercially important material, a polypropyl<strong>en</strong>e<br />
based impact copolymer. The interface of the two<br />
compon<strong>en</strong>ts in this material is examined by inserting a<br />
cryotomed dogbone of the impact copolymer material into<br />
an AFM t<strong>en</strong>sile stage (NanoRack Asylum Research).<br />
Dalia G. Yablon<br />
NANOTECHNOLOGY 17
INDUSTRY<br />
Fig. 1 a: Stretching of impact Copolymer in neutral position Fig. 1 b: Stretching of impact Copolymer in stretched position<br />
18 reSOLUTION<br />
Fig. 1 c: Stretching of impact Copolymer in<br />
overnight after stretching<br />
A t<strong>en</strong>sile stress is th<strong>en</strong> exerted on the dogbone and the<br />
material imaged under t<strong>en</strong>sile stress with AFM (MFP-3D<br />
Asylum Research). The dogbone was cryotomed in the <strong>Leica</strong><br />
EM UC6 / FC6 system with a custom-built hemispherical<br />
accessory onto which the dogbone is glued allowing for<br />
the dogbone mid section to protrude out towards the knife.<br />
Cryotoming conditions were at -60C, a diamond knife<br />
speed of 0.3-0.6 mm/s and feed of 100-250 nm. Shown<br />
in Figure 1a is an AFM tapping mode phase image with<br />
approximately dim<strong>en</strong>sions of 5 um x 5 um of a cryotomed<br />
impact copolymer. The commercial impact copolymer used<br />
for this study is composed of a polypropyl<strong>en</strong>e (PP) matrix<br />
with micron-sized domains of ethyl<strong>en</strong>e-propyl<strong>en</strong>e (EP) rubber<br />
domains, which further contain ethyl<strong>en</strong>e inclusions<br />
produced in a serial polymerization reactor. In the image,<br />
the PP matrix is observed as the surrounding purple medium,<br />
and the EP rubber domain as the large round bright<br />
yellow domain in the middle. Within this EP rubber domain<br />
there is a further smaller purple inclusion which is composed<br />
of ethyl<strong>en</strong>e. The color contrast in this phase image<br />
is due to a convolution of various mechanical properties<br />
where the EP rubber is softer than the surrounding stiffer<br />
PP matrix.
Fig. 2 a,b: Large scale image of a topography... and b: phase of a crack in polypropyl<strong>en</strong>e matrix<br />
Fig. 3 a,b: High resolution image of a topography... and b: of a crack in polypropyl<strong>en</strong>e matrix<br />
In Figure 1b, this impact copolymer was elongated in<br />
the direction of the black arrow by 1.7% (this elongation<br />
l<strong>en</strong>gth is below the yield strain of PP) resulting in the AFM<br />
image shown in Figure 1b where the same rubber compon<strong>en</strong>t<br />
is tracked from Figure 1a. Several new features are<br />
visible in this new image. First, rips and tears that were<br />
pres<strong>en</strong>t within the rubber in Figure 1a (circled in blue),<br />
have now grown and elongated in Figure 1b (also circled<br />
in blue). Second, stretch marks (circled in red) betwe<strong>en</strong><br />
the rubber and the polypropyl<strong>en</strong>e matrix have developed<br />
at the north and south poles of the rubber domain, indicating<br />
a mismatch in Poisson ratios betwe<strong>en</strong> the EP and PP<br />
materials. If the EP domain is stretched mainly along the<br />
equatorial line as in the experim<strong>en</strong>t conducted here, th<strong>en</strong><br />
stretch marks would develop mainly at top and bottom of<br />
the EP rubber domain as observed in the AFM image in<br />
Figure 1b.<br />
INDUSTRY<br />
NANOTECHNOLOGY 19
INDUSTRY<br />
20 reSOLUTION<br />
Furthermore these marks are asymmetric about the EP rubber<br />
domain and appear to be most promin<strong>en</strong>t at the bottom<br />
of the domain, though stretch marks are also observed on<br />
the top portion of the domain. The sample was allowed<br />
to sit overnight at 1.7% elongation and the next morning<br />
revealed a disappearance of the stretch marks as shown in<br />
the AFM image of Figure 1c, suggesting the yielding of the<br />
PP matrix overnight.<br />
Finally, the effect of the stress within the PP matrix at 2%<br />
elongation is shown in Figure 2. Both topography (a) and<br />
phase (b) images of a large-area (15um) scan size show a<br />
number of areas where cracks have formed at the EP-PP<br />
interface and propagated into the PP matrix; some of the<br />
cracks are highlighted in blue/orange circles. The developm<strong>en</strong>ts<br />
of cracks or shear bands and micro-voids may come<br />
from stress amplifi cation in the ICP material due to the pres<strong>en</strong>ce<br />
of EP rubber domains. Maximum stress amplifi cation<br />
by a spherical EP rubber domain is inversely proportional<br />
to the square root of the crack tip radius and occurs at the<br />
poles of the EP rubber domain. All these cracks and shear<br />
bands in Figure 2 appear to originate at the polar locations<br />
of the EP rubber domains, probably at sharp corners of the<br />
rubber domain with extremely small crack tip radii (and<br />
therefore maximum stress amplifi cation resulting in a stress<br />
singularity at that point). The appearance of these shear<br />
bands and micro-voids suggests that the local stresses well<br />
exceed the yield stress despite the 2% global deformation.<br />
The larger cracks propagate several microns within the<br />
polypropyl<strong>en</strong>e matrix. However, there are also several<br />
cracks with signifi cantly smaller dim<strong>en</strong>sions of a couple<br />
hundred nm in l<strong>en</strong>gth and t<strong>en</strong>s of nm in width. Zooming in<br />
on the crack circled in orange from Figure 2 is shown in<br />
Figure 3 and reveals tiny PP fi brils stretching across the<br />
<strong>en</strong>tire width of the track, as shown in the corresponding<br />
topography 3(a) and phase 3(b) images, at about 45 degree<br />
to the stretching direction suggesting that the cracking is<br />
induced by shear deformation. This particular crack is measured<br />
to be ~80 nm in depth and ~600 nm in width.<br />
Summary<br />
Morphology and interface adhesion of an impact copolymer<br />
(ICP) were studied using atomic force microscopy. Effects<br />
of deformation were observed within both PP and EP<br />
compon<strong>en</strong>ts as well as at the interface betwe<strong>en</strong> the two<br />
materials. A continued stretching of the ICP could lead to<br />
delamination of EP from PP matrix. The strain required to<br />
separate the EP domains from the PP matrix could be used<br />
as a measure of the interfacial adhesion betwe<strong>en</strong> EP and<br />
PP. Most importantly, the corresponding local interfacial<br />
stretching ext<strong>en</strong>t or void l<strong>en</strong>gth betwe<strong>en</strong> EP and PP upon<br />
delamination, which can be measured directly by AFM, can<br />
be used to calculate the interfacial str<strong>en</strong>gth betwe<strong>en</strong> EP<br />
and PP. Pres<strong>en</strong>tly, there are no direct measurem<strong>en</strong>t methods<br />
available to determine interfacial adhesive str<strong>en</strong>gth<br />
of nano- and microscale domains within polymer bl<strong>en</strong>ds,<br />
especially bl<strong>en</strong>ds g<strong>en</strong>erated in situ in polymerization reactors.<br />
This AFM examination of micro-domain deformation<br />
described qualitatively here could be used for direct determination<br />
of interfacial adhesion in complex polymer containing<br />
materials such as bl<strong>en</strong>ds and composites.<br />
Figures reproduction permission<br />
Figures 1, 2, and 3 are reprinted with permission from<br />
Microscopy and Analysis 25(3):11-13 (AM), 2011, Copyright<br />
2011 John Wiley and Sons Ltd.<br />
Contact<br />
Dr. Dalia G. Yablon<br />
Corporate Strategic Research<br />
ExxonMobil Research and Engineering<br />
Annandale, NJ<br />
dalia.g.yablon@exxonmobil.com<br />
Instrum<strong>en</strong>ts related to this sample preparation:<br />
<strong>Leica</strong> EM UC6 and <strong>Leica</strong> EM FC6 the predecessor models of <strong>Leica</strong> EM UC7 and <strong>Leica</strong> EM FC7<br />
<strong>Leica</strong> EM UC7<br />
Ultramicrotome for Perfect Sectioning at Room Temperature and Cryo<br />
<strong>Leica</strong> EM UC7 with Cryochamber EM FC7
University of Wollongong<br />
Electron Microscopy C<strong>en</strong>tre<br />
Darr<strong>en</strong> Attard1 and Tony Romeo2 1 Institute for Superconducting and Electronic Materials (ISEM),<br />
Australian Institute for Innovative Materials (AIIM) Facility, University<br />
of Wollongong, Squires Way, North Wollongong NSW 2500<br />
2 Intellig<strong>en</strong>t Polymer Research Institute (IPRI), AIIM Facility,<br />
University of Wollongong, Squires Way, North Wollongong<br />
The University of Wollongong has a diverse range of materials<br />
research programs that includes metallurgy for mining,<br />
manufacturing, steel making and transport; polymers<br />
for solar cells, <strong>en</strong>ergy storage and bionic implants; and<br />
superconducting and electronic materials for commercialization,<br />
<strong>en</strong>ergy storage, telecommunications and medical<br />
applications. Electron microscopy is an integral part of this<br />
research, due to the chemical and structural information<br />
that can be provided down to the atomic scale. However,<br />
as the performance of electron microscopes and analytical<br />
techniques has evolved, they have become increasingly<br />
s<strong>en</strong>sitive to <strong>en</strong>vironm<strong>en</strong>tal effects and the quality of specim<strong>en</strong><br />
preparation has become ev<strong>en</strong> more of a crucial factor<br />
to the success of applied materials studies.<br />
To address a number of performance issues related to<br />
electron microscopy, the University of Wollongong has<br />
constructed a purpose built electron microscopy c<strong>en</strong>tre<br />
that was completed in July 2011, and purchased a compreh<strong>en</strong>sive<br />
suite of specim<strong>en</strong> preparation equipm<strong>en</strong>t that<br />
is now operational for materials and life sci<strong>en</strong>ces. The<br />
c<strong>en</strong>tre will house up to 7 electron microscopes with two<br />
preparation laboratories, and has be<strong>en</strong> designed to exceed<br />
the <strong>en</strong>vironm<strong>en</strong>tal specifi cations for the curr<strong>en</strong>t g<strong>en</strong>eration<br />
of commercially available electron microscopes including<br />
aberration corrected S/TEMs. Curr<strong>en</strong>tly two FEGSEm’s and<br />
a TEM have be<strong>en</strong> relocated to the facility and are fully operational.<br />
<strong>Leica</strong> was selected as a major supplier for the<br />
specim<strong>en</strong> preparation equipm<strong>en</strong>t based on equipm<strong>en</strong>t<br />
specifi cations, product integration, demonstrated capability,<br />
ease of use, automation and applications support. These<br />
will be supplem<strong>en</strong>ted with an <strong>Leica</strong> M205 A stereo, <strong>Leica</strong><br />
DM2500 M and <strong>Leica</strong> DM6000 M optical microscopes for<br />
quality control during specim<strong>en</strong> preparation and their value<br />
as stand-alone research tools. These factors will facilitate<br />
production of high quality specim<strong>en</strong>s, and the training of a<br />
large user-base typical of a university <strong>en</strong>vironm<strong>en</strong>t.<br />
The <strong>Leica</strong> EM TXP, EM TIC020 and EM RES101 were purchased<br />
to prepare materials for SEM and TEM based studies.<br />
The <strong>Leica</strong> EM TXP was selected for its ability to prepare<br />
TEM specim<strong>en</strong>s and perform target grinding. The ability to<br />
perform these functions while being viewed directly to assess<br />
quality and increase specim<strong>en</strong> throughput was se<strong>en</strong><br />
as a major advantage. The <strong>Leica</strong> EM TIC020 was selected<br />
for its ability to prepare large, damage free areas of specim<strong>en</strong>s<br />
for low voltage, high resolution SEM imaging, Electron<br />
Backscatter Diffraction (EBSD) and Energy Dispersive<br />
Spectroscopy (EDS). The <strong>Leica</strong> EM TXP and EM TIC020 instrum<strong>en</strong>ts<br />
have already be<strong>en</strong> utilized for the preparation of<br />
Magnesium diboride (MgB 2 ) superconducting wires. MgB 2<br />
is a chall<strong>en</strong>ge to prepare because it is brittle and s<strong>en</strong>sitive<br />
to water. Of particular interest are defects such as pores,<br />
cracks or impurities at the Mg and B grain boundaries after<br />
processing, which preparation artefacts can infl u<strong>en</strong>ce.<br />
Transverse and longitudinal ori<strong>en</strong>tations of MgB 2 wires <strong>en</strong>capsulated<br />
in Niobium (Nb) metal and Inconel alloys, were<br />
prepared using the <strong>Leica</strong> EM TXP and EM TIC020 instrum<strong>en</strong>ts.<br />
The specim<strong>en</strong>s were glued to the small <strong>Leica</strong> EM<br />
TIC sample holders, th<strong>en</strong> clamped for preparation on the<br />
<strong>Leica</strong> EM TXP using the procedure in Table 1.<br />
Tool Insert RPM Force limit Pump/mL E-W speed/mms-1 Diamond disc cutter 15000 - 18 0.025<br />
Silicon carbide foil, 15μm 1000 8 8 0.2<br />
Diamond lapping foil, 9μm 2000 8 8 0.2<br />
Table 1: <strong>Leica</strong> EM TXP preparation of MgB 2 superconduting wires<br />
INDUSTRY<br />
Darr<strong>en</strong> Attard Tony Romeo<br />
NANOTECHNOLOGY 21
INDUSTRY<br />
Fig. 1: a Ion polished transverse section of the superconducting wire, and b detail of the MgB 2 core.<br />
Fig. 2: a Ion polished longitudinal section of the superconducting wire, and b detail of the MgB 2 core.<br />
Fig. 3: X-ray maps of the MgB2 superconducting material showing a the distribution of a) Magnesium, b) Boron, c) oxyg<strong>en</strong> and<br />
d) all elem<strong>en</strong>ts overlaid to show the spatial relationship.<br />
22 reSOLUTION<br />
Ethanol was used as a lubricant and disp<strong>en</strong>sed using the<br />
<strong>Leica</strong> EM TXP pump. The polishing procedure on the <strong>Leica</strong><br />
EM TXP only used coarse lapping foils to provide a plane<br />
surface for fi nal preparation with the <strong>Leica</strong> EM TIC020. A<br />
mechanical polishing procedure will be developed shortly<br />
to produce the best possible surface fi nish.<br />
To minimize the effects of surface oxidation after preparation<br />
on the <strong>Leica</strong> EM TXP, the specim<strong>en</strong>s were transferred<br />
directly to the <strong>Leica</strong> EM TIC020 and placed under vacuum.<br />
The specim<strong>en</strong>s were ion milled with gun <strong>en</strong>ergies of 7kV<br />
and gun curr<strong>en</strong>ts of 2.6mA. After polishing, the specim<strong>en</strong>s<br />
were transferred directly to the SEM to minimize exposure<br />
to air. Figure 1a shows the transverse section with<br />
the Nb metal sheath <strong>en</strong>capsulating the MgB 2 superconducting<br />
core. The ion polished surface and the interface<br />
betwe<strong>en</strong> the dissimilar materials, are free of polishing<br />
artefacts. Figure 1b shows the MgB 2 core in more detail,<br />
with pores pres<strong>en</strong>t at some grain boundaries. Figure 2a<br />
shows the longitudinal section of the superconducting<br />
wire where the elongated grains in the drawing direction<br />
are easily observed. Figure 2b shows the MgB2 core in<br />
more detail, where no physical defects were observed.<br />
Figure 3 shows X-ray maps of a) Mg, b) B and c) O in the<br />
transverse section of the MgB 2 superconducting wire. The<br />
x-ray maps show the elem<strong>en</strong>tal conc<strong>en</strong>tration as a function<br />
of the colour int<strong>en</strong>sity in each respective map. Figure<br />
3d shows all of the elem<strong>en</strong>tal maps superimposed.<br />
Here, it can be se<strong>en</strong> that O is pres<strong>en</strong>t in low conc<strong>en</strong>trations,<br />
mostly at the Mg grain boundaries where the superconducting<br />
properties can be affected.<br />
The electron microscopy c<strong>en</strong>tre will also need to support<br />
growing areas in biology-based research projects needing<br />
TEM and SEM. A <strong>Leica</strong> EM UC7 ultramicrotome and EM<br />
FC7 cryo-attachm<strong>en</strong>t have be<strong>en</strong> purchased to section soft<br />
polymers and biological materials to cater for the new<br />
research interests. Similarly, a <strong>Leica</strong> EM CPD030 critical<br />
point dryer will allow controlled drying of soft biological<br />
tissues and gels for SEM observation, and completes the<br />
suite of <strong>Leica</strong> instrum<strong>en</strong>ts that will be installed in the new<br />
c<strong>en</strong>tre.<br />
Contact<br />
Darr<strong>en</strong> Attard<br />
Microscopist and Services Coordinator<br />
AIIM Electron Microscopy C<strong>en</strong>tre, Innovation Campus<br />
University of Wollongong, Sydney<br />
darr<strong>en</strong>a@uow.edu.au
Instrum<strong>en</strong>ts related to this sample preparation:<br />
<strong>Leica</strong> EM TXP and <strong>Leica</strong> EM TIC020 (the predecessor of <strong>Leica</strong> EM TIC 3X)<br />
<strong>Leica</strong> EM TXP<br />
Target Surfacing System<br />
<strong>Leica</strong> EM TIC 3X<br />
Ion Beam Slope Cutter<br />
Register for Upcoming<br />
reSOLUTION Issues<br />
Would you like to read future issues of reSOLUTION, too?<br />
The following link will take you straight to the registration form:<br />
www.leica-microsystems.com/registration.01<br />
Choose betwe<strong>en</strong> differ<strong>en</strong>t reSOLUTION editions and we would also be glad<br />
to hear your opinion of our magazine and any suggestions for topics.<br />
You can find this issue and all past issues of reSOLUTION on our<br />
website at:<br />
www.leica-microsystems.com/magazines.01<br />
Order no.: English 11924257 ∙ IX/12/LX/B.H. ∙ Copyright © by <strong>Leica</strong> Mikrosysteme GmbH,<br />
Vi<strong>en</strong>na, Austria, 2012. Subject to modifications. LEICA and the <strong>Leica</strong> Logo are registered<br />
trademarks of <strong>Leica</strong> <strong>Microsystems</strong> IR GmbH.<br />
IMPRINT<br />
Publisher<br />
<strong>Leica</strong> Mikrosysteme GmbH<br />
Hernalser Hauptstraße 219<br />
A - 1170 Vi<strong>en</strong>na, Austria<br />
www.leica-microsystems.com<br />
Editor in Chief<br />
Ian Lamswood<br />
Marketing Manager <strong>LNT</strong><br />
<strong>Leica</strong> <strong>Microsystems</strong>, Vi<strong>en</strong>na, Austria<br />
Ian.Lamswood@leica-microsystems.com<br />
Contributing Editors<br />
Akos Kulik<br />
Cathy Johnson<br />
Dalia G. Yablon<br />
Daniel Studer<br />
Daniel Althof<br />
Darr<strong>en</strong> Attard<br />
Günter P. Resch<br />
Jeff P. Gorski<br />
Karin Trimmel<br />
Marl<strong>en</strong>e Brandstetter<br />
Martin W. Goldberg<br />
Nicole Fellner<br />
Thérèse Hillmann<br />
Tony Romeo<br />
Layout<br />
Uwe Neumann,<br />
<strong>Leica</strong> <strong>Microsystems</strong> GmbH<br />
Communications & Corporate Id<strong>en</strong>tity<br />
Isabelle Elmann<br />
Marketing <strong>LNT</strong><br />
<strong>Leica</strong> <strong>Microsystems</strong>, Vi<strong>en</strong>na, Austria<br />
Cover Picture<br />
Cathy Johnson<br />
<strong>Leica</strong> <strong>Microsystems</strong><br />
Printing Date<br />
4th October 2012<br />
INDUSTRY<br />
NANOTECHNOLOGY 23
Image Is Everything<br />
And We‘ve Got It Covered<br />
The new Coater range from <strong>Leica</strong>