EXTENDED CONCEPTUALIZATION OF EXPECTATION While the SERVQUAL instrument h<strong>as</strong> been productively used for me<strong>as</strong>uring service quality in many studies - e.g., public recreation programs (Cromp<strong>to</strong>n <strong>and</strong> Mackay, 1989), hospitals, health care or medical care settings (Babakus <strong>and</strong> Mangold, 1992; Steffen, 1992), US Postal Service (Kilkenny, 1992), higher education (Boulding, Kalra, Staelin <strong>and</strong> Zeithaml, 1993; Ford, Josep <strong>and</strong> Joseph, 1993), <strong>and</strong> the Air National Guard (Orwig, 1994)-it h<strong>as</strong> also raised, questions about the interpretation <strong>and</strong> operationalization of expectations (e.g., Te<strong>as</strong>. 1994, 1993). In response <strong>to</strong> that, their later work on the nature of expectation (Par<strong>as</strong>uraman, et. al., in different order of names, 1994a, 1994b, 1994c, <strong>and</strong> 1993) resulted in the conceptualization <strong>and</strong> operationalization of expectation in<strong>to</strong> two levels: Desired Service - the service level cus<strong>to</strong>mers believe organizations can <strong>and</strong> should deliver; <strong>and</strong>, Adequate Service - the minimum service level cus<strong>to</strong>mers consider acceptable. The comparison of perception <strong>to</strong> desired service level <strong>and</strong> adequate service level generate a "Me<strong>as</strong>ure of Service Superiority" (MSS or perceived service relative <strong>to</strong> desired service) <strong>and</strong> a "Me<strong>as</strong>ure of Service Adequacy" (MSA or perceive service relative <strong>to</strong> adequate service) respectively. Therefore, for the original gap 5, the comparison between desired service <strong>and</strong> perceived service is the perceived service superiority gap; Par<strong>as</strong>uraman, et. al. (1994) call this perceived service quality (PSQ) Gap 5A. On the other h<strong>and</strong>, the comparison between adequate service <strong>and</strong> perceived service is the perceived adequacy gap; they call this PSQ Gap 5B. The higher the perceived service relative <strong>to</strong> desired service level, the higher the Perceived Service Superiority; <strong>and</strong> accordingly for adequate service level. These two service quality <strong>as</strong>sessments, therefore, replace the single Gap 5 <strong>and</strong> 1 in the Gaps model (Zeithaml, et. al., 1993). Figure 2 shows gap 5 in its new form. Separating adequate service <strong>and</strong> desired service levels is the "zone of <strong>to</strong>lerance" (ZoT) (Par<strong>as</strong>uraman et. al., 1994a, 1994b, 1994c; Zeithalm et. al., 1993). The service performance is considered satisfac<strong>to</strong>ry (<strong>to</strong>lerated), but not superior, if the perceived service score lies in between the desired service score <strong>and</strong> adequate service score. Stamatis (1996:165) suggested that, in the absence of competition, achieving 98
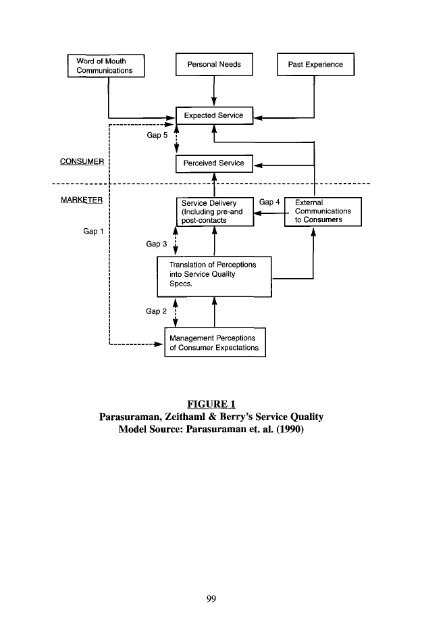
Word of Mouth Communications CONSUMER MARKETER Gap 1 Gap 5 Gap 3 Gap 2 Personal Needs P<strong>as</strong>t Experience Expected Service Perceived Service Service Delivery (Including pre-<strong>and</strong> post-contacts Translation of Perceptions in<strong>to</strong> Service Quality Specs. Management Perceptions of Consumer Expectations Gap 4 External Communications <strong>to</strong> Consumers FIGURE 1 Par<strong>as</strong>uraman, Zeithaml & Berry's Service Quality Model Source: Par<strong>as</strong>uraman et. al. (1990) 99
- Page 1 and 2:
PRODUKTIVm SUPPLIER DEVELOPMENT IN
- Page 3 and 4:
pRODUKnvm PENASIHAT Tuan Haji Ismai
- Page 5 and 6:
BIODATA OF RALIMOHD NOR Rali Mohd N
- Page 7 and 8:
The supplier development concept ha
- Page 9 and 10:
4. SCOPE AND LIMITATIONS OF THE STU
- Page 11 and 12:
Annual Master Plan (AMP) Long Range
- Page 13 and 14:
6.2 SELECTION OF SUPPLIERS The supp
- Page 15 and 16:
Cases/ Company Company A Company B
- Page 17 and 18:
Proton inherited the automobile tec
- Page 19 and 20:
such as of technical know-how, supp
- Page 21 and 22:
A point worth noting in the Malaysi
- Page 23 and 24:
finished products. In short, the JI
- Page 25 and 26:
Car Assembly Production © Reverse
- Page 27 and 28:
Appendix 1: Cost Breakdown of Proto
- Page 29 and 30:
Departments Procurement & Vendor De
- Page 31 and 32:
Average ration of share parts Produ
- Page 33 and 34:
Sako, M, (1992), "Prices, Quality a
- Page 35 and 36:
JUST-IN-TIME (JIT) PRINCIPLES AND S
- Page 37 and 38:
UJ UJ Figure 1.1: Existing Layout o
- Page 39 and 40:
At the University of Bradford (UOB)
- Page 41 and 42:
Presently, tools for all the machin
- Page 43 and 44:
2.3 Proposed Layout Improvement No.
- Page 45 and 46:
MC NO. Al A2 A4 A5 A6 47 A8 A9 A10
- Page 47 and 48:
Controller who plans the production
- Page 49 and 50:
Figure A4r i > \ 2 \l C c / ) 1.8 P
- Page 51 and 52: Raw Mat. Store Tool Storage Area To
- Page 53 and 54: above, the forklift is not required
- Page 55 and 56: The remaining of the production los
- Page 57 and 58: 4.10 Set-up Time Reduction Saving T
- Page 59 and 60: TABLE 2.2 Standard Price List for P
- Page 61 and 62: 5.3 Project Achievements The propos
- Page 63 and 64: REFERENCES 1. Alaya, S.E.B.H., Elim
- Page 65 and 66: 27. Monden Y., Toyota Production Sy
- Page 67 and 68: BIODATA OF ALIAS RADAM Alias Radam
- Page 69 and 70: an investment-driven strategy towar
- Page 71 and 72: country's dependence on chemical im
- Page 73 and 74: distance ratio: OB/OF in order to m
- Page 75 and 76: productivity growth in the context
- Page 77 and 78: egistered the largest increase in m
- Page 79 and 80: Productivity Growth Measurement Two
- Page 81 and 82: CONCLUSION Chemical related industr
- Page 83 and 84: Chambers, R. (1988) Applied Product
- Page 85 and 86: Maisom, A. (1995) "Total Factor Pro
- Page 87 and 88: TABLE 1 TYend in Production, Employ
- Page 89 and 90: MIC Code 35111 35119 35120 35130 35
- Page 91 and 92: Year 1983 1984 1985 1986 1987 1988
- Page 93 and 94: TABLE 8 Malmquist Index, Technical
- Page 95 and 96: FIGURE 2 Malmquist Index and Produc
- Page 97 and 98: BIODATA OF DR. SHARIFUDDIN ZAINUDDI
- Page 99 and 100: However, the extremely few existing
- Page 101: SERVICE QUALITY MODEL According to
- Page 105 and 106: any point in the ZoT might be consi
- Page 107 and 108: who pay a nominal fee and received
- Page 109 and 110: RESEARCH FINDINGS Hypothesis la: Ac
- Page 111 and 112: TABLE 2 Manova and Paired Sample T-
- Page 113 and 114: It could be real that government fa
- Page 115 and 116: REFERENCES Adam, E.E. Jr., J.C. Her
- Page 117 and 118: McKinney, Jerome B., 1995. Understa
- Page 119 and 120: SYMBOLISM AND BUSINESS EDGAR J. RID
- Page 121 and 122: Once it is understood that we live
- Page 123 and 124: must be eliminated because racism n
- Page 125 and 126: which are people of color, out of t
- Page 127 and 128: The productivity problems of Americ