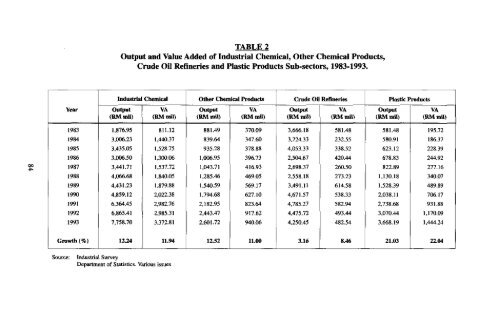
Year 1983 1984 1985 1986 1987 1988 1989 1990 1991 1992 1993 Growth (%) TABLE 2 Output <strong>and</strong> Value Added of Industrial Chemical, Other Chemical Products, Crude Oil Refineries <strong>and</strong> Pl<strong>as</strong>tic Products Sub-sec<strong>to</strong>rs, 1983-1993. Industrial Chemical Output (RMmll) 1,876.95 3,006.23 3,435.05 3,006.50 3,441.71 4,066.68 4,431.23 4,859.12 6,364.45 6,865.41 7,758.70 12.24 VA (RMmil) 811.12 1,440.37 1,528.75 1,300.06 1,537.72 1,840.05 1,879.88 2,022.38 2,982.76 2,985.31 3,372.81 11.94 Source: Industrial Survey Department of Statistics. Various issues Other Chemical Products Output (RM mil) 881.49 839.64 935.28 1,006.95 1,043.71 1,285.46 1,540.59 1,794.68 2,182.95 2,443.47 2,601.72 12.52 VA (RMmil) 370.09 347.60 378.88 396.73 416.93 469.05 569.17 627.10 823.64 917.62 940.06 11.00 Crude Oil Refineries Output (RMmil) 3,666.18 3,724.33 4,053.33 2,504.67 2,698.37 2,558.18 3,491.11 4,671.57 4,785.27 4,475.72 4,250.45 3.16 VA (RM mil) 581.48 232.55 338.52 420.44 260.50 273.23 614.58 538.33 582.94 493.44 482.54 8.46 Output (RMmil) Pl<strong>as</strong>tic Products 581.48 580.91 623.12 678.83 822.89 1,130.18 1,528.39 2,038.11 2,738.68 3,070.44 3,668.19 21.03 VA (RMmil) 195.72 186.37 228.39 244.92 277.16 340.07 489.89 706.17 931.88 1,170.09 1,444.24 22.04
MIC Code 35111 35119 35120 35130 35210 35220 35231 35239 35290 35300 35600 Industry Description Industrial g<strong>as</strong>es TABLE 3 Output, Value Added, Employment <strong>and</strong> Value of Capital by Sub-sec<strong>to</strong>r, 1993 Other b<strong>as</strong>ic industrial chemical, except fertilizer Fertilizer <strong>and</strong> pesticides Synthetic resins, pl<strong>as</strong>tic <strong>and</strong> materials <strong>and</strong> manmade fibres - except gl<strong>as</strong>s Paints, varnishes <strong>and</strong> lacquers Drugs <strong>and</strong> medicines Soap <strong>and</strong> cleaning preparations Perfumes, cosmatics <strong>and</strong> other <strong>to</strong>ilet preparations Chemical products, n.e.c. Crude oil refineries Pl<strong>as</strong>tics products, n.e.c. Total Source: Annual Statistics of Manufacturing Industries, Part A: 1993 Output (RM'OOO) 3,633,242 1,703,440 1,029,670 1,392,351 630,937 312,169 754,146 149,497 754,970 4,250,454 3,668,185 18,279,061 % Share 19.88 9.32 5.63 7.62 3.45 1.71 4.13 0.82 4.13 23.25 20.07 100.00 Value Added (RMOOO) 2,216,245 570,167 257,890 328,503 213,299 139,151 246,284 71,155 270,173 482,543 1,444,243 6,239,653 % Share 35.52 9.14 4.13 5.26 3.42 2.23 3.95 1.14 4.33 7.73 23.15 100.00 No. of Employment 3,473 3,919 2,215 3,709 2,352 3,296 3,090 835 3,953 1,296 54,759 82,897 % Share 4.19 4.73 2.67 4.47 2.84 3.98 3.73 1.01 4.77 1.56 66.06 100.00 Wage <strong>and</strong> Salaries (RMOOO) 91,855 77,563 58,088 73,697 48,941 39,395 59,898 11,743 71,196 53,528 468,926 1,054,830 % Share 8.71 7.35 5.51 6.99 4.64 3.73 5.68 1.11 6.75 5.07 44.46 100.00 Capital (RMOOO) 5,682,776 2,442,898 476,705 1,579,530 167,351 164,937 216,964 27,720 347,230 1,181,447 2,203,613 14,491,17 % Share 39.22 16.86 3.29 10.90 1.15 1.14 1.50 0.19 2.40 8.15 15.21 100.00
- Page 1 and 2:
PRODUKTIVm SUPPLIER DEVELOPMENT IN
- Page 3 and 4:
pRODUKnvm PENASIHAT Tuan Haji Ismai
- Page 5 and 6:
BIODATA OF RALIMOHD NOR Rali Mohd N
- Page 7 and 8:
The supplier development concept ha
- Page 9 and 10:
4. SCOPE AND LIMITATIONS OF THE STU
- Page 11 and 12:
Annual Master Plan (AMP) Long Range
- Page 13 and 14:
6.2 SELECTION OF SUPPLIERS The supp
- Page 15 and 16:
Cases/ Company Company A Company B
- Page 17 and 18:
Proton inherited the automobile tec
- Page 19 and 20:
such as of technical know-how, supp
- Page 21 and 22:
A point worth noting in the Malaysi
- Page 23 and 24:
finished products. In short, the JI
- Page 25 and 26:
Car Assembly Production © Reverse
- Page 27 and 28:
Appendix 1: Cost Breakdown of Proto
- Page 29 and 30:
Departments Procurement & Vendor De
- Page 31 and 32:
Average ration of share parts Produ
- Page 33 and 34:
Sako, M, (1992), "Prices, Quality a
- Page 35 and 36:
JUST-IN-TIME (JIT) PRINCIPLES AND S
- Page 37 and 38: UJ UJ Figure 1.1: Existing Layout o
- Page 39 and 40: At the University of Bradford (UOB)
- Page 41 and 42: Presently, tools for all the machin
- Page 43 and 44: 2.3 Proposed Layout Improvement No.
- Page 45 and 46: MC NO. Al A2 A4 A5 A6 47 A8 A9 A10
- Page 47 and 48: Controller who plans the production
- Page 49 and 50: Figure A4r i > \ 2 \l C c / ) 1.8 P
- Page 51 and 52: Raw Mat. Store Tool Storage Area To
- Page 53 and 54: above, the forklift is not required
- Page 55 and 56: The remaining of the production los
- Page 57 and 58: 4.10 Set-up Time Reduction Saving T
- Page 59 and 60: TABLE 2.2 Standard Price List for P
- Page 61 and 62: 5.3 Project Achievements The propos
- Page 63 and 64: REFERENCES 1. Alaya, S.E.B.H., Elim
- Page 65 and 66: 27. Monden Y., Toyota Production Sy
- Page 67 and 68: BIODATA OF ALIAS RADAM Alias Radam
- Page 69 and 70: an investment-driven strategy towar
- Page 71 and 72: country's dependence on chemical im
- Page 73 and 74: distance ratio: OB/OF in order to m
- Page 75 and 76: productivity growth in the context
- Page 77 and 78: egistered the largest increase in m
- Page 79 and 80: Productivity Growth Measurement Two
- Page 81 and 82: CONCLUSION Chemical related industr
- Page 83 and 84: Chambers, R. (1988) Applied Product
- Page 85 and 86: Maisom, A. (1995) "Total Factor Pro
- Page 87: TABLE 1 TYend in Production, Employ
- Page 91 and 92: Year 1983 1984 1985 1986 1987 1988
- Page 93 and 94: TABLE 8 Malmquist Index, Technical
- Page 95 and 96: FIGURE 2 Malmquist Index and Produc
- Page 97 and 98: BIODATA OF DR. SHARIFUDDIN ZAINUDDI
- Page 99 and 100: However, the extremely few existing
- Page 101 and 102: SERVICE QUALITY MODEL According to
- Page 103 and 104: Word of Mouth Communications CONSUM
- Page 105 and 106: any point in the ZoT might be consi
- Page 107 and 108: who pay a nominal fee and received
- Page 109 and 110: RESEARCH FINDINGS Hypothesis la: Ac
- Page 111 and 112: TABLE 2 Manova and Paired Sample T-
- Page 113 and 114: It could be real that government fa
- Page 115 and 116: REFERENCES Adam, E.E. Jr., J.C. Her
- Page 117 and 118: McKinney, Jerome B., 1995. Understa
- Page 119 and 120: SYMBOLISM AND BUSINESS EDGAR J. RID
- Page 121 and 122: Once it is understood that we live
- Page 123 and 124: must be eliminated because racism n
- Page 125 and 126: which are people of color, out of t
- Page 127 and 128: The productivity problems of Americ