

(jit) principles and systematic layout planning as tools to improve ...
(jit) principles and systematic layout planning as tools to improve ...
(jit) principles and systematic layout planning as tools to improve ...

You also want an ePaper? Increase the reach of your titles
YUMPU automatically turns print PDFs into web optimized ePapers that Google loves.
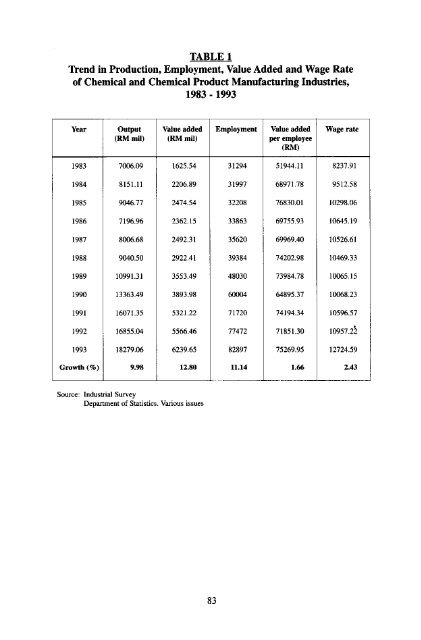
TABLE 1<br />
TYend in Production, Employment, Value Added <strong>and</strong> Wage Rate<br />
of Chemical <strong>and</strong> Chemical Product Manufacturing Industries,<br />
1983 -1993<br />
Year<br />
1983<br />
1984<br />
1985<br />
1986<br />
1987<br />
1988<br />
1989<br />
1990<br />
1991<br />
1992<br />
1993<br />
Growth (%)<br />
Output<br />
1 KM mil)<br />
7006.09<br />
8151.11<br />
9046.77<br />
7196.96<br />
8006.68<br />
9040.50<br />
10991.31<br />
13363.49<br />
16071.35<br />
16855.04<br />
18279.06<br />
9.98<br />
Value added<br />
(KM mil)<br />
1625.54<br />
2206.89<br />
2474.54<br />
2362.15<br />
2492.31<br />
2922.41<br />
3553.49<br />
3893.98<br />
5321.22<br />
5566.46<br />
6239.65<br />
12.80<br />
Source: Industrial Survey<br />
Department of Statistics. Various issues<br />
83<br />
Employment<br />
31294<br />
31997<br />
32208<br />
33863<br />
35620<br />
39384<br />
48030<br />
60004<br />
71720<br />
77472<br />
82897<br />
11.14<br />
Value added<br />
per employee<br />
(RM)<br />
51944.11<br />
68971.78<br />
76830.01<br />
69755.93<br />
69969.40<br />
74202.98<br />
73984.78<br />
64895.37<br />
74194.34<br />
71851.30<br />
75269.95<br />
1.66<br />
Wage rate<br />
8237.91<br />
9512.58<br />
10298.06<br />
10645.19<br />
10526.61<br />
10469.33<br />
10065.15<br />
10068.23<br />
10596.57<br />
10957.22<br />
12724.59<br />
2.43